Abstract
Experimental techniques allowing longitudinal studies of vascular disease progression or treatment effects are not readily available for most animal models. Thus, most existing studies are destined to either study individual time points or use large cohorts of animals. Here we describe a noninvasive technique for studying vascular disease that is based on in vivo imaging of the long posterior ciliary artery (LPCA) in the iris of albino rats. Using a slit-lamp biomicroscope, images of the LPCA were taken weekly in conscious normotensive Wistar Kyoto rats (WKY, n = 10) and spontaneously hypertensive rats (SHR, n = 10) for 10 wk. Using imaging software, we found that lumen diameter was significantly smaller and the wall-to-lumen (W/L) ratio larger in SHR than in WKY. Wall thickness was not different. Blood pressure correlated with the W/L ratio. Histology of the abdominal aorta also revealed a smaller lumen diameter and greater W/L ratio in SHR compared with WKY. Corneal application of the muscarinic receptor agonist pilocarpine elicited a dose-dependent vasodilation of the LPCA that could be antagonized by inhibition of nitric oxide synthase, suggesting that the pilocarpine response is mainly mediated by endothelium-derived nitric oxide. Consistent with endothelial dysfunction in SHR, pilocarpine-induced vasodilation was greater in WKY rats than in SHR. These findings indicate that in vivo imaging of the LPCA allows assessment of several structural and functional vascular parameters in conscious rats and that the LPCA responds to disease insults and pharmacologic treatments in a fashion that will make it a useful model for further studies.
Keywords: lumen diameter, wall thickness, wall-to-lumen ratio, pilocarpine, l-NAME, endothelial function, papaverine, slit-lamp biomicroscope
structural and functional vascular responses to environmental factors (5, 14), genetic predispositions (1, 19), or pathophysiologic conditions (29) can lead to cardiovascular morbidity and mortality, such as stroke (26) and myocardial infarction (35). Conversely, therapeutic interventions can slow down or even reverse such vascular alterations (22, 27). Structural and functional vascular responses to pathogenic or therapeutic factors typically develop as a chronic process over several weeks to months (8, 20, 34, 39). Thus, a complete characterization of vascular responses to pathogenic or therapeutic factors requires establishing the time course of such responses. While in vivo techniques based on ultrasound imaging techniques or plethysmography exist to study vascular structure and function in humans (6, 12, 31), the majority of these techniques have not been adopted to smaller experimental animals, such as rats and mice. Even high-resolution ultrasound devices (e.g., Vevo 770; VisualSonics, Toronto, Canada) only provide a resolution of 30 μm. While this resolution may be sufficient to measure lumen diameter and wall thickness of larger conduit arteries, it does not appear to be sufficient to measure wall thickness of resistance arteries in rodents, which is in the range of 10 μm. As a result, time course studies on vascular properties of resistance arteries in experimental animals are often performed in individual groups of subjects for each time point. Besides the undesirable use of a large number of animals, statistical power is lower in an experimental design based on independent groups compared with a repeated-measures design. Thus, there is a need for in vivo techniques that allow for repeated assessment of microvascular structure and function over a chronic time period in small experimental animals, such as rats and mice.
From recent ophthalmologic studies of the iris of albino mice (3, 36) we have observed that the vasculature of the iris is readily observable in albino animals. The rationale for our present studies was to test whether imaging of this vasculature could be developed to a point empowering longitudinal studies of vascular disease. Such an approach could offer many advantages, including relatively inexpensive, noninvasive in vivo assessment of vascular structure and function of a true resistance artery (lumen diameter ∼30–50 μm) in conscious animals, repeated applicability in longitudinal studies, and potential adaptation to mice.
To test feasibility and refine methodology, three experimental protocols were initiated. In a first protocol, the hypothesis was tested that in vivo imaging of the long posterior ciliary artery (LPCA) in conscious rats can be used to detect differences in the lumen diameter, wall thickness, and wall-to-lumen (W/L) ratio of this artery in hypertensive and normotensive rats. To test this hypothesis, images of the LPCA of spontaneously hypertensive rats (SHR) and normotensive Wistar Kyoto rats (WKY) were taken over an observation period of 10 wk and the time course of the lumen diameter, wall thickness, and W/L ratio of the LPCA was monitored and correlated to systolic blood pressure.
In a second protocol, the hypothesis was tested that in vivo imaging of the LPCA in conscious rats can be used to study endothelial function by monitoring the vascular response to eye drops containing a drug that is expected to cause endothelium-dependent vasodilation. To test this hypothesis, we first determined the time course and dose-response curve of the effect of pilocarpine-containing eye drops (muscarinic agonist) on lumen diameter of the LPCA. We then determined the nitric oxide (NO)-mediated component of this response using eye drops containing the NO synthase inhibitor Nω-nitro-l-arginine methyl ester hydrochloride (l-NAME). Finally, we compared the vasodilator response of the LPCA to pilocarpine in conscious SHR and WKY.
In a third protocol, we tested whether maximum vasodilation of the LPCA can be achieved by corneal application of papaverine, a drug that acts directly on vascular smooth muscle cells to induce vasodilation in large parts by inhibition of Ca2+-channels (13). As in the second protocol, this part of the study involved establishing the time course of the vasodilator response elicited by a single application of the drug and a dose response curve. Furthermore, the vasodilator response to papaverine was compared between SHR and WKY rats.
MATERIAL AND METHODS
Animals
Experiments were performed with normotensive Sprague Dawley rats (Harlan Laboratories, Haslett, MI), normotensive WKY rats and SHR (both from Charles River Laboratories International, Wilmington, MA). Only male rats were included in the study. Rats had free access to a standard rat chow diet and drinking water. Temperature (24 ± 2°C), humidity (60 ± 10%), and light periods (12:12-h light-dark cycle, lighting 06:00 to 18:00 h) were controlled. All experiments have been approved by the Institutional Animal Care and Use Review Committee at The University of Iowa.
In vivo Imaging of the LPCA in Conscious Rats
Setup and procedure.
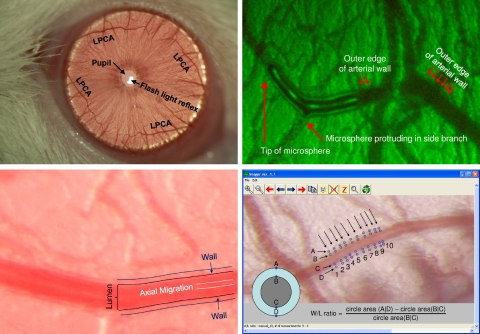
The irises of the left eye of the rats were photographed through slit-lamp biomicroscopes (model SL-D7; Topcon, Tokyo, Japan or model FS-2; Nikon Instruments, Melville, NY) using ×40 (Topcon SL-D7) or ×30 (Nikon FS-2) objective lenses and Nikon D100 (6 megapixels on Topcon SL-D7) or Canon 50D (15 megapixels on Nikon FS-2) digital cameras (37). To increase optical resolution, ×2 (Topcon SL-D7) or ×3 teleconverters (Nikon FS-2) were inserted between the slit-lamp and the digital camera, resulting in optical magnifications of ×80 (Topcon SL-D7) or ×90 (Nikon FS-2). Together with the resolutions of the cameras, the final digital image resolutions were 0.75 μm/pixel (Topcon SL-D7) and 0.53 μm/pixel (Nikon FS-2). To obtain maximal image quality the cameras were operated at the highest resolution and highest quality setting, and the images were stored in lossless Tagged Image File (TIF) or RAW formats. An example of a photograph of the iris showing the superior and inferior branches of the lateral and medial LPCA is shown in Fig. 1, top, left. The imaging procedure was done in conscious animals manually held in front of the slit-lamp biomicroscope by one investigator while a second investigator operated the slit-lamp and the digital camera. The procedure takes < 1 min for each rat and was well tolerated.
Fig. 1.
Top left: iris of a rat photographed through a slit-lamp biomicroscope (Topcon SL-D7) with a ×40 objective lens (no teleconverter used for this image). The light reflex from the flash light can be seen within the pupil. Four branches of the long posterior ciliary artery (LPCA) can be seen in the superior and inferior and lateral and medial aspects of the iris. The blood vessels projecting in perpendicular direction to the LPCA can be used as anatomical landmarks to identify the same section of the LPCA in subsequent imaging sessions. Top right: identification of the structures representing the vessel wall and lumen was accomplished by intravenous injection of a fluorescent-labeled bolus. The outer edges of the fluorescent-labeled bolus mark the lumen of the blood vessel. Dark lines outside the vessel lumen mark the vessel wall. Bottom left: magnified view of the LPCA. Dark lines outside the vessel lumen mark the outer edges of the vessel wall. A brighter line in the center of the vessel lumen is caused by axial migration of erythrocytes that reflect the flash light more than the translucent plasma in the outer zones of the vessel lumen. Bottom right: determination of wall-to-lumen (W/L) ratio using the Imager software. The outer and inner edges of the vessel wall (points A, B, C, and D) are manually marked using a cross-hair cursor on 10 cross sections of the vessel (indicated by the 10 arrows). For each cross section, the W/L ratio is calculated as the difference of the circle areas determined by the diameters (A D) and (B C) divided by the circle area determined by the diameter (B C). The average of these 10 W/L ratios is used for statistical analysis.
Identification of the wall and lumen of the LPCA.
To identify the structures within the images of the LPCA that correspond to the wall and lumen of the arteriole, a fluorescent-labeled dye was injected intravenously (in conscious rats, through a previously implanted femoral vein catheter), and the LPCA was imaged immediately after the injection using appropriate excitation and emission filters. Fig. 1, top, right shows a bolus of the dye within the LPCA. The fluorescent-labeled bolus marks the inner edge of the vessel wall, while a faint dark line outside of the lumen marks the outer edge of the vessel wall. Brightfield images of the LPCA (Fig. 1, bottom, left) clearly show these structures representing the outer and inner vessel wall. Furthermore, a bright line within the center of the vessel lumen can be identified. We speculate that this optical phenomenon corresponds to axial migration of erythrocytes. Erythrocytes may reflect the flash light causing a bright center line within the vessel lumen, while plasma may be more translucent and may not reflect the flash light as much as erythrocytes.
Image analysis.
The photographs were analyzed using an image processing software (Fig. 1, bottom, right) that is included with the freely available HemoLab software package (http://www.haraldstauss.com/HemoLab/HemoLab.html). This software visualizes the images such that each pixel within the digital photograph is displayed at exactly one pixel of the computer screen, thus avoiding scaling or interpolation and providing the highest possible image resolution for data analysis. Using a crosshair cursor, the investigator marks four points in perpendicular orientation to the longitudinal axis of the artery. Two of the four points mark the outer edges of the vessel wall and two points mark the inner edges of the vessel wall corresponding to the lumen of the artery (Fig. 1, bottom, right). Based on these four points the Imager software calculates the cross-sectional area of the artery (ACS, area of a circle with the diameter determined by the outer edges of the vessel wall, points A and D in Fig. 1, bottom, right) and the lumen area (AL, area of a circle with the diameter determined by the inner edges of the vessel wall, points B and C in Fig. 1, bottom, right). The W/L ratio is then calculated as W/L ratio = (ACS − AL)/AL.
For each image, 10 measurements are taken, and the average of the 10 measurements is used for statistical analysis. The variability within these 10 measurements taken from one image is indicated in Table 1.
Table 1.
Variability of measurements taken from photomicrographs of the long posterior ciliary artery
| WKY |
SHR |
|||
|---|---|---|---|---|
| Parameter | AVG | STDEV | AVG | STDEV |
| Lumen diameter, μm | 51.6 ± 1.6 | 2.0 ± 0.24 | 35.2 ± 1.9 | 1.6 ± 0.23 |
| Wall thickness, μm | 8.4 ± 0.4 | 0.93 ± 0.14 | 8.2 ± 0.3 | 0.75 ± 0.08 |
| W/L ratio, no units | 0.77 ± 0.058 | 0.11 ± 0.018 | 1.20 ± 0.086 | 0.16 ± 0.024 |
Data are means ± SE of 10 animals per strain. Average (AVG) values for lumen diameter, wall thickness, and W-to-L ratio in Wistar Kyoto (WKY) and spontaneously hypertensive (SHR) rats. Week 1 values of data are shown in Fig. 4 together with the average SD (STDEV) of the 10 measurements obtained from each single iris image. W/L, wall-to-lumen.
Protocol 1: Time Course of Vascular Parameters in WKY and SHR
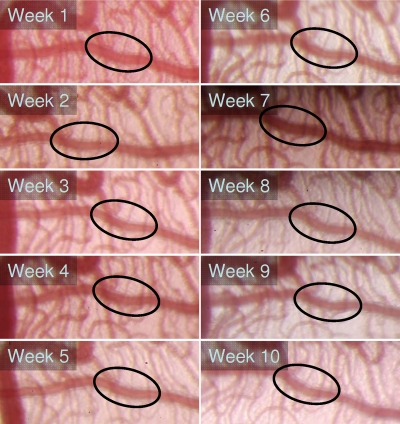
The experimental protocol was carried out in normotensive WKY rats (n = 10, age: 8 ± 1 wk at start of protocol) and hypertensive SHR (n = 10, age: 9 ± 2 wk at start of protocol). Body weight, systolic blood pressure (BPSYS; tail cuff), heart rate (HR; tail cuff), lumen diameter, wall thickness, and W/L ratio of the LPCA were monitored weekly for an observation period of 10 wk. The same section along the LPCA was imaged and analyzed in consecutive (weekly) imaging sessions (Fig. 2). At the end of the 10-wk observation period, rats were killed and the abdominal aorta was taken for histomorphological determination of lumen area, wall area, and W/L ratio.
Fig. 2.
Weekly photographs of the LPCA in a spontaneously hypertensive rat (SHR). The same location within the LPCA was used for determination of W/L ratio in consecutive (weekly) photographs as indicated by the ellipses.
BPSYS and HR monitoring.
BPSYS and HR monitoring was done by tail plethysmography in conscious rats as described by Widdop and Li (38). However, instead of a piezoelectric pulse transducer an optoelectronic sensor was used to detect pulse-synchronous oscillations in tail blood flow.
Histology of abdominal aorta.
Paraformaldehyde-fixed abdominal aortas were embedded in Tissue-Tek optimal cutting temperature compound (Sakura Finetek, Torrance, CA) and mounted in a microtome (model 855; American Optical Scientific Instruments, Buffalo, NY) at −20°C with the distal portion of the aorta (bifurcation) oriented upwards. Consecutive cryosections (40 μm) were obtained at the bifurcation of the iliac arteries with the abdominal aorta until the bifurcation ended and the iliac arteries merged into the more proximal abdominal aorta. From this point on, 25 sections (1 mm) were discarded and the following sections were used for analysis. This ensured that the same section of the abdominal aorta was analyzed for each rat. The sections were stained with hematoxylin and eosin and digitized using a complementary metal-oxide-semiconductor (CMOS) camera mounted on an inverted microscope. The wall and lumen cross-sectional areas were determined using the ImageJ software (National Institutes of Health, Public Domain, Bethesda, MD), and the W/L ratio was calculated as the ratio of the two areas.
Protocol 2: Assessment of Endothelial Function
Endothelial function was assessed by the vascular response of the LPCA to corneal application of the muscarinic receptor agonist pilocarpine that causes endothelium-dependent vasodilation through multiple mechanisms, including endothelial release of NO, endothelial-derived hyperpolarizing factor, prostacyclin, and others (4, 7, 21, 28). All experiments were done in conscious rats.
Time to maximum response.
In a first set of experiments, 30 μl of a 1% pilocarpine solution (Pilocarpine Hydrochloride Ophthalmic Solution, Falcon Pharmaceuticals, Forth Worth, TX) was applied on the cornea of 8-wk-old Sprague Dawley rats (n = 10) after a baseline image of the LPCA was taken. Subsequently, images of the LPCA were taken every 3 min for 36-min total.
Dose-response curve for pilocarpine.
After a baseline image of the LPCA was taken, increasing concentrations of pilocarpine (0.01%, 0.03%, 0.1%, 0.3%, 1%, and 3%; 30 μl solution for each concentration) were applied on the cornea of male, 8 wk-old Sprague Dawley rats (n = 6) every 15 min. Ten minutes after each application (time point of maximum response) images of the LPCA were taken.
Inhibition of the vascular response to pilocarpine by l-NAME.
To determine the NO-dependent component of the vascular response to pilocarpine, 8 wk-old Sprague Dawley rats (n = 6) were pretreated by corneal applications of 30 μl of the NO-synthase inhibitor l-NAME (cat. no. N5751, Sigma-Aldrich, St. Louis, MO) at concentrations of 0% (placebo), 1%, 2%, or 4% after baseline images of the LPCA had been taken. Five minutes after l-NAME application pilocarpine (1%, 30 μl = maximum of dose response curve) was administered on the cornea and 10 min thereafter (time point of maximum response) images of the LPCA were taken.
Endothelial function in WKY and SHR.
After baseline images of the LPCA were taken in WKY rats (n = 6, estimated age 6 mo) and SHR (n = 6, estimated age 4–5 mo), 30 μl of a 1% pilocarpine solution was instilled on the cornea and a second set of images of the LPCA was taken 10 min after pilocarpine application. Then 15 min after pilocarpine application the NO-synthase inhibitor l-NAME (30 μl, 4% solution) was applied to the cornea and a third set of images of the LPCA was taken 10 min after l-NAME application.
Protocol 3: Endothelium-Independent Vasodilation
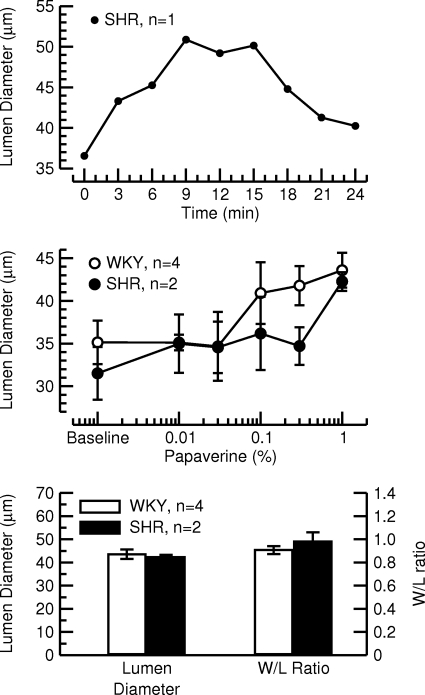
In an attempt to elicit endothelium-independent maximal vasodilation, we tested the vasodilator papaverine. Similar to the pilocarpine experiments described above, we first established the time course of the vasodilator response of a 1% papaverine solution (corneal application, 30 μl, diluted in ddH2O) in one SHR. Second, we tested the vasodilator response to increasing concentrations of papaverine (0.01%, 0.03%, 0.1%, 0.3%, 1%, and 2%, 30 μl for each dose, diluted in ddH2O, images taken 10 min following drug application = maximum response in time course experiment) in WKY (n = 4) and SHR (n = 2).
Statistical Analysis
Data are expressed as means ± SE. Two-way ANOVA with one repeated (time course) and one independent (rat strains) level was used to analyze weekly body weight, BPSYS, HR, LPCA lumen diameter, LPCA wall thickness, and LPCA W/L ratios in WKY and SHR (Figs. 3 and 4). In case of statistical significance in the two-way ANOVA, post hoc Fisher tests (correction for multiple comparisons was achieved by using the studentized range distribution that accounts for the number of groups being compared in the post hoc tests) were performed for comparisons between individual groups and time points. Unpaired Student's t-tests were performed to compare lumen area, wall area, and W/L ratio of the abdominal aortas in WKY and SHR (Fig. 5). Linear regression analysis was done to study the correlation between BPSYS and W/L ratio of the LPCA (Fig. 6) using two approaches: 1) data from both rat strains and from all 10 wk pooled; 2) using partial correlation analysis, we corrected for the factor of strain of rat. One-way ANOVA for repeated measures were used to analyze the time course and dose-response curves for pilocarpine and the inhibition of the pilocarpine response by different doses of l-NAME (Fig. 7). Two-way ANOVA for one repeated (drugs) and one independent (rat strain) measure with post hoc Fisher tests (correction for multiple comparisons as above) were used to analyze the vascular responses of the LPCA to pilocarpine and l-NAME in WKY and SHR (Fig. 8). Statistical significance was assumed for P < 0.05.
Fig. 3.
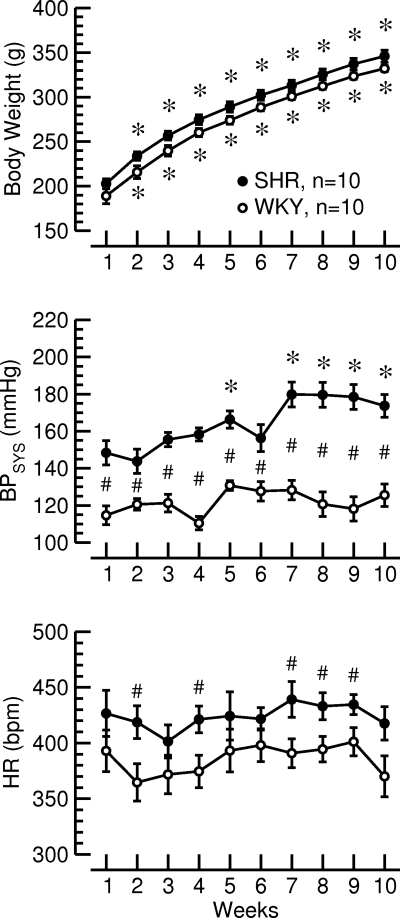
Time courses of body weight (top), systolic blood pressure (BPSYS, middle), and heart rate (HR, bottom) during the 10-wk observation period in normotensive Wistar Kyoto (WKY) rats and SHR. *P < 0.05 vs. week 1; #P < 0.05 WKY vs. SHR.
Fig. 4.
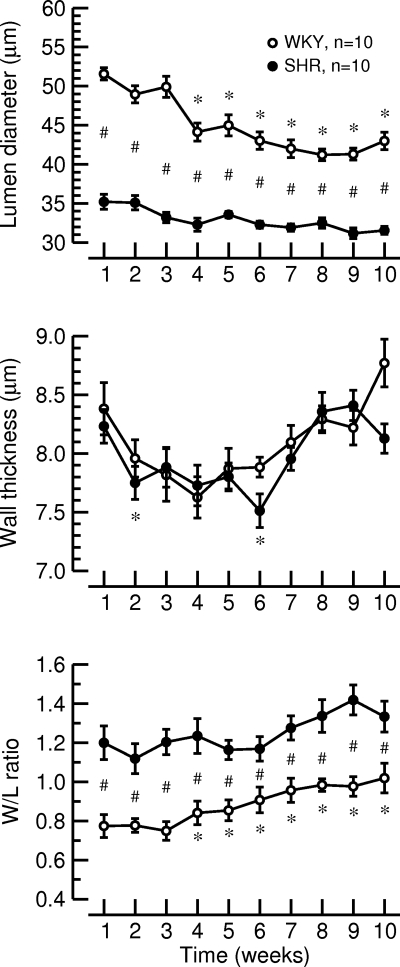
Time courses of the lumen diameter (top), wall thickness (middle), and W/L ratio of the LPCA (bottom) during the 10-wk observation period in normotensive WKY rats and SHR. *P < 0.05 vs. week 1; #P < 0.05 WKY vs. SHR.
Fig. 5.
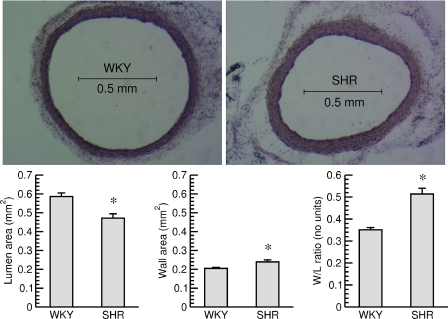
Top: cross sections of the abdominal aorta (hematoxylin and eosin staining) from a normotensive WKY rat, (left) and an SHR (right). The sections were taken just above the bifurcation of the aorta. Bottom: lumen area (left), wall area (middle), and W/L ratio (right) of the abdominal aortas in normotensive WKY rats and SHR. *P < 0.05 WKY vs. SHR.
Fig. 6.
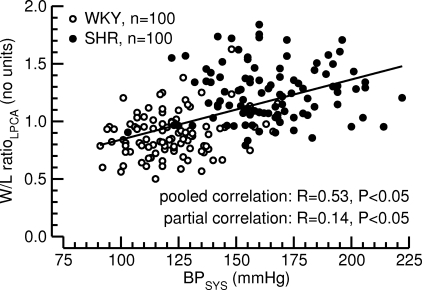
Correlation between systolic blood pressure (BPSYS, x-axis) and W/L ratio of the LPCA (W/L ratioLPCA, y-axis). Pooled (BPSYS-W/L ratioLPCA data pairs from all 20 rats of both strains and all 10 time points pooled) and partial (corrected for factor of strain of rat) correlation analyses were calculated. Significant (P < 0.05) linear correlations were found in both analyses.
Fig. 7.
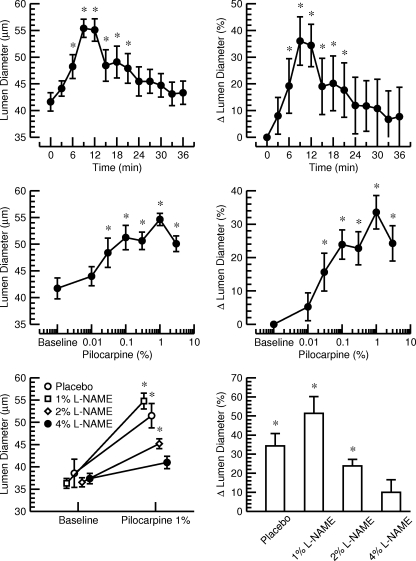
Top: time course of the lumen diameter of the LPCA in absolute units (left) and %changes (right) after a single corneal application of 30 μl of a 1% pilocarpine solution in 10 normotensive Sprague Dawley rats. The maximum response was observed after 9–12 min. *P < 0.05 vs. baseline before drug application (time point 0 min). Middle: Dose response curve for the effect of increasing concentrations of pilocarpine (corneal application, 30 μl) on the lumen diameter of the LPCA in absolute units (left) and percent changes (right). Experiments were performed in 6 normotensive Sprague Dawley rats. The maximum response was obtained at a concentration of 1% pilocarpine. *P < 0.05 vs. baseline before drug application. Bottom: effect of a single corneal application of 1% pilocarpine (30 μl) on lumen diameter of the LPCA in absolute units (left) and %changes (right) after pretreatment with placebo or increasing concentrations of l-NAME. Pretreatment with 4% l-NAME (30 μl) prevented a significant increase in lumen diameter in response to pilocarpine. *P < 0.05 vs. baseline before drug application.
Fig. 8.
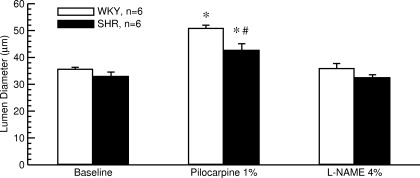
Effect of a single corneal application of 30 μl of a 1% pilocarpine solution followed by a second corneal application of 30 μl of a 4% l-NAME solution on lumen diameter of the LPCA in 6 normotensive WKY rats and 6 SHR. Pilocarpine caused a greater dilation of the LPCA in WKY than in SHR. *P < 0.05 vs. baseline before drug application; #P < 0.05 WKY vs. SHR.
RESULTS
Protocol 1: Time Course of Vascular Parameters in WKY and SHR
The purpose of this protocol was to test whether in vivo imaging of the LPCA can reproduce the well-established finding of hypertensive vascular remodeling in SHR (9, 10, 24, 32).
Body weight, BPSYS, and HR.
In this protocol, WKY (n = 10) and SHR (n = 10) were monitored over a time period of 10 wk. At the beginning of the protocol WKY were 8 ± 1 wk of age and SHR were 9 ± 2 wk old. Body weight increased similarly in both strains of rats, and there was no significant difference in body weight between strains (Fig. 3, top). Throughout the protocol, BPSYS was higher in SHR than in WKY, and BPSYS continued to rise in SHR but did not change during the observation period of 10 wk in WKY (Fig. 3, middle). HR was higher in SHR than in WKY (Fig. 3, bottom). Thus, SHR and WKY demonstrated the expected time course changes in body weight, BPSYS, and HR.
Vascular parameters of the LPCA.
At each week of the observation period, lumen diameter of the LPCA was significantly smaller in SHR than in WKY. In WKY, lumen diameter decreased significantly over time, while lumen diameter in SHR remained constant throughout the observation period (Fig. 4, top). Wall thickness of the LPCA was not different between WKY and SHR (Fig. 4, middle). At each time point, the W/L ratio of the LPCA was significantly larger in SHR than in WKY. The W/L ratio in WKY increased with time, while W/L ratio in SHR remained at a constantly elevated level throughout the protocol (Fig. 4, bottom). These morphological findings are in line with previous reports of reduced lumen diameter and increased W/L ratio without media hypertrophy in renal resistance arteries from SHR compared with WKY (32) and, therefore, suggest that in vivo imaging of the LPCA allows reliable assessment of vascular morphologic parameters in conscious rats.
Vascular parameters of the abdominal aorta.
The luminal area of the abdominal aorta was significantly smaller in SHR compared with WKY and the wall area was significantly larger in SHR than in WKY. As a result, the W/L ratio in SHR was significantly larger than in WKY rats (Fig. 5). These findings demonstrate that hypertensive vascular remodeling identified in resistance arteries by in vivo imaging of the LPCA are accompanied by likewise alterations in conduit arteries in our cohort of experimental animals.
Correlation between BPSYS and W/L ratio of the LPCA.
Fig. 6 demonstrates a significant linear relationship between BPSYS and W/L ratio of the LPCA (R = 0.53, P < 0.05). Because SHR generally had greater W/L ratios than WKY, one may argue that the significant correlation between BPSYS and the W/L ratio of the LPCA is a strain effect rather than a BP effect. However, a partial correlation analysis that corrects for the factor of strain of rat revealed a weak but significant relationship between BPSYS and W/L ratio of the LPCA (R = 0.14, P < 0.05). This finding suggests a close relationship between vascular morphology of the LPCA and BPSYS in SHR and WKY.
Collectively, the findings of this experimental protocol on the time course of vascular parameters in WKY rats and SHR demonstrate that in vivo imaging of the LPCA can reproduce the well-established finding of hypertensive vascular remodeling in SHR.
Protocol 2: Assessment of Endothelial Function
The purpose of this protocol was to test whether in vivo imaging of the LPCA in combination with corneal drug application (eye drops) allows assessment of endothelial function and whether it can reproduce the well-established finding of endothelial dysfunction in SHR (16, 25).
Time to maximum vasodilator response to pilocarpine.
In normotensive Sprague Dawley rats (n = 10), the maximum vasodilator response of the LPCA to a single corneal application of 30 μl of a 1% pilocarpine solution was found after 9–12 min (Fig. 7, top). The lumen diameter returned to levels not significantly different from baseline after 24 min. The lumen diameter of the LPCA increased by a maximum of 36.0 ± 9.1% (minute 9). Thus, maximal vascular responses of the LPCA to a corneal application of pilocarpine should be assessed ∼10 min following drug application.
Dose-response curve for pilocarpine.
The greatest vasodilator response of the LPCA in normotensive Sprague Dawley rats (n = 6) was found at a dose of pilocarpine of 30 μl of a 1% solution. At this dose, the lumen of the LPCA increased by 33.6 ± 5.0%. A higher dose (30 μl of a 3% solution) did not further increase the lumen diameter of the LPCA (+24.3 ± 5.3%, Fig. 7, middle). Thus, if a single dose of pilocarpine is used to assess endothelial function of the LPCA, application of 30 μl of a 1% solution is recommended because this dose will result in the largest vascular response.
Inhibition of the vascular response to pilocarpine by l-NAME.
A dose-dependent inhibition of the pilocarpine-induced vasodilator response of the LPCA by l-NAME was observed in normotensive Sprague Dawley rats (n = 6). Pretreatment with corneal application of 30 μl of a 4% l-NAME solution prevented a significant increase in lumen diameter in response to 30 μl of a 1% pilocarpine solution, suggesting that pilocarpine-mediated vasodilation of the LPCA is mainly mediated by endothelial NO release (Fig. 7, bottom).
Endothelial function in WKY and SHR.
Endothelial function in WKY and SHR was assessed in SHR (n = 6) and WKY (n = 6) that we obtained as retired breeders from Charles River Laboratories International. The company does not exactly specify the age for retired breeders. At the time of the experiments, body weight was 427 ± 2 g in WKY rats and 334 ± 6 g in SHR. Based on the body weights shown in Fig. 3 and based on the literature (15), we estimate the age of the SHR as ∼4–5 mo and the age of the WKY rats as ∼6 mo. BPSYS and HR determined by the tail-cuff technique in conscious animals were 200 ± 2 vs. 122 ± 7 mmHg (P < 0.05) and 326 ± 14 vs. 379 ± 13 beats/min (P < 0.05) in SHR and WKYrats, respectively. Lumen diameter of the LPCA did not differ significantly between SHR and WKY under baseline conditions (Fig. 8). Ten minutes following corneal application of 30 μl of a 1% pilocarpine solution, the lumen diameter of the LPCA was significantly increased in both strains of rats. However, the lumen increased to a greater diameter in WKY than in SHR (Fig. 8), suggesting reduced endothelium-dependent vasodilation in SHR compared with WKY, thus confirming previous reports of endothelial dysfunction in SHR (16, 25). Inhibition of endothelial NO-synthase by 30 μl of a 4% l-NAME solution (15 min after pilocarpine application) returned the lumen diameter to baseline levels in both strains of rats (Fig. 8), again suggesting that the pilocarpine response is mainly mediated by endothelial NO release.
Collectively, the findings of this experimental protocol confirm that assessing the vascular response of the LPCA to corneal application of pilocarpine allows assessment of endothelial function in conscious rats and can reproduce the well-established finding of endothelial dysfunction in SHR.
Protocol 3: Endothelium-Independent Vasodilation
The purpose of this protocol was to use papaverine to elicit maximal vasodilation to evaluate structural properties of the LPCA without the confounding effect of vascular tone.
The same animals used for protocol 2 were also used in protocol 3. The maximum vasodilator response was obtained 9–15 min after a single corneal application of a 1% papaverine solution (Fig. 9, top). The dose response curve for the vasodilator action of papaverine is shown in Fig. 9, middle. After corneal application of papaverine at a 2% concentration, the cornea was covered with white residue (presumably papaverine that did not stay in solution) and, thus, we could only analyze the dose response curve up to a concentration of 1%. In both strains of rat, this concentration still fell within the increasing part of the dose response curve and a plateau was not reached. Lumen diameter and W/L ratio of the LPCA following a corneal application of 1% papaverine are shown in Fig. 9, bottom for WKY and SHR. We did not perform a statistical analysis on these data because of the low number of animals. However, no marked differences between WKY and SHR were observed for lumen diameter or W/L ratio at this submaximal dose of papaverine.
Fig. 9.
Top: time course of the lumen diameter of the LPCA after a single corneal application of 30 μl of a 1% papaverine solution in 1 SHR. The maximum response was observed after 9–15 min. Middle: dose response curve for the effect of increasing concentrations of papaverine (corneal application, 30 μl) on the lumen diameter of the LPCA. Experiments were performed in 4 normotensive WKY rats and 2 SHR. At concentrations > 1%, papaverine did not stay in solution after corneal application. A plateau was not reached at this highest concentration (1%). Bottom: effect of a single corneal application of 1% papaverine (30 μl) on lumen diameter (left) and W/L ratio (right) of the LPCA in 4 WKY and 2 SHR. A statistical analysis was not performed due to the low number of animals.
DISCUSSION
There are two major findings of this study. First, in vivo imaging of the iris in conscious rats can provide high-resolution digital photographs of morphological structures of the LPCA that allow assessment of the lumen diameter, wall thickness, and W/L ratio of this artery. Second, drugs can be administered as eye drops to study vascular function of the LPCA in conscious rats.
Based on its anatomy, the LPCA might be considered a model for resistance arteries of the cerebral circulation. Fig. 1, top, left shows the anatomical location of the four branches of the LPCA within the iris. Two LPCAs branch off the ophthalmic artery (a branch of the internal carotid artery) and enter the globe lateral and medial from the optic nerve. Both, the lateral and the medial LPCA then divide into a superior and inferior branch, which collectively constitute the circulus arteriosus major around the circumference of the iris. Because of the anatomical origin of the LPCA from the internal carotid and ophthalmic artery, the LPCA may be considered a cerebral artery. In addition, the LPCA is considered to be part of the blood-aqueous barrier (33), an ocular equivalent of the blood-brain barrier. Thus, assessing structure and function of the LPCA by in vivo imaging may potentially be of considerable interest in research areas related to the cerebral circulation or stroke. Furthermore, the lumen diameter of the LPCA in rats, as identified in this study, ranges between 30 and 60 μm, depending on strain and age of rats. Based on this size, the LPCA can be classified as an arteriole and resistance vessel (30).
Our findings with the LPCA matched expectations based on previous work of other vessels in SHR. As expected, systolic blood pressure increased from 9 wk of age to 19 wk of age in SHR, while systolic blood pressure did not change during the 10-wk observation period in WKY. Furthermore, systolic blood pressure was significantly higher in SHR than in WKY at each time point of the protocol. Hypertension in SHR was associated with a smaller lumen diameter and greater W/L ratio of the LPCA compared with normotensive WKY. Since wall thickness was not different between SHR and WKY, vascular remodeling of the LPCA in SHR can be best characterized as inward eutrophic remodeling typically seen in resistance arteries in essential hypertension (23, 24). These results in the LPCA were confirmed by histomorphometric examination of the abdominal aorta, demonstrating smaller lumen areas and greater wall areas and W/L ratios in SHR than in WKY. This finding is consistent with other studies in larger arteries, demonstrating similar results in the carotid (40) and mesenteric (11) arteries of SHR compared with WKY. Finally, the W/L ratio of the LPCA was positively correlated with systolic blood pressure, further suggesting that the greater W/L ratio in SHR than in WKY is directly related to hypertension. Collectively, these results suggest that in vivo imaging of the LPCA in conscious rats is a valid technique to assess the time course of the remodeling of resistance arteries in hypertension.
Our results also demonstrate that in vivo imaging of the LPCA in combination with corneal drug application allows for studying vascular function in conscious rats. Pilocarpine, a muscarinic receptor agonist that causes endothelium-dependent vasorelaxation elicited its maximal vasodilator response in the LPCA ∼10 min after corneal application of the drug. This relatively long time to maximal effect is consistent with observations by others (33) and may be related to diffusion through the cornea and subsequently across the blood-aqueous barrier into the vessel. We also determined the NO-dependent component of the pilocarpine-induced vasodilation. Pretreatment with increasing doses of the NO synthase inhibitor l-NAME dose dependently attenuated the vasodilator response of 30 μl of a 1% pilocarpine solution, which is the dose that yielded the greatest vascular response in the pilocarpine dose-response curve. A dose of 30 μl of a 4% l-NAME solution prevented a significant increase in lumen diameter by pilocarine, indicating that endothelial NO release is the major factor contributing to pilocarpine-induced vasodilation. Finally, the pilocarpine response of the LPCA in ∼4- to 5-mo-old SHR was smaller than the response in ∼6-mo-old WKY. Consistent with findings in the carotid artery in SHR and WKY (40), baseline lumen diameter of the LPCA was no longer significantly smaller in SHR than in WKY at these ages. In the chronic experiment (protocol 1) young WKY (8 wk of age) demonstrated a steady decline in lumen diameter over the 10-wk observation period (Fig. 4, top). It is possible that this trend continued and that at the age of ∼6 mo the lumen diameter in WKY (in the experiments of protocols 2 and 3) had declined to the level of ∼4- to 5-mo-old SHR. However, following pilocarpine application, lumen diameter was significantly greater in WKY than in SHR, indicating a smaller pilocarpine-response in SHR compared with WKY rats. This result is consistent with findings demonstrating a reduced in vitro response to acetylcholine in isolated ciliary arteries from 20-wk-old SHR compared with WKY (7). These results demonstrate that in vivo imaging of the LPCA in combination with corneal drug application can be used to assess functional properties of the LPCA, such as endothelial (dys)function.
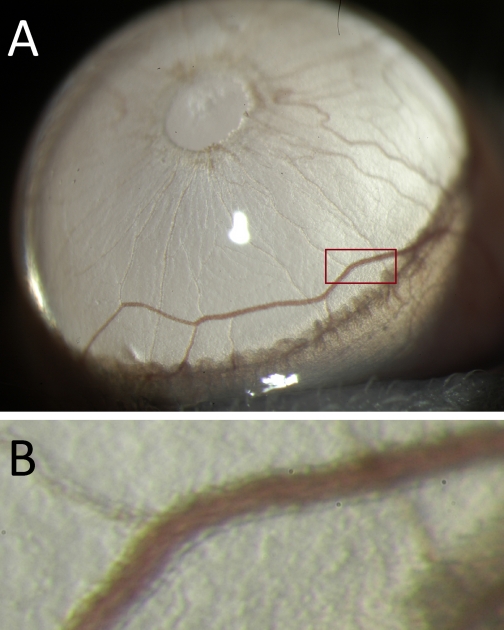
There are several strengths of the in vivo imaging technique of the LPCA. Besides being a relatively inexpensive technique, other strengths of this methodology include the possibility to assess vascular structure and function in conscious (vs. anesthetized) rats because anesthetic drugs have a major impact on vascular function (2). The option to perform repeated measurements of vascular structure and function in individual animals, such as done in this study, provides the opportunity to perform time course experiments with minimal number of animals and optimal statistical power using repeated-measurement designs. The fact that the LPCA can be considered an arteriole or a true resistance artery can also be considered an advantage because other techniques, such as isolated microvessel preparations, are technically very challenging and difficult to perform, whereas in vivo imaging of the LPCA using a slit-lamp biomicroscope is far less difficult or technically challenging (although it requires some experience to obtain well-focused images). Finally, a strength of the technique is the potential possibility to apply it to mice. Pilot experiments performed in our laboratory suggest that this may indeed be possible. Fig. 10 shows a photomicrograph of an LPCA taken in a conscious mouse using the same technique as described here for rats. This option could provide access to a wide range of transgenic animal models and make in vivo imaging of the LPCA a highly attractive technique in a variety of biomedical research areas.
Fig. 10.
A: Iris of an albino B6(Cg)-Tyrc-2J/J mouse photographed through a slit-lamp biomicroscope (Topcon SL-D7) with a ×40 objective lens. B: magnified view of the area indicated by the red rectangle in A. The wall of the LPCA can clearly be detected as the more translucent structure on each side of the vessel lumen.
As with every experimental technique, there are some limitations inherent to the in vivo imaging technique of the LPCA. First, high-quality images can only be obtained in albino animals, because the LPCA is almost invisible in a pigmented iris. Of course, nonalbino rat or mice strains can be bred into an albino strain to circumvent this limitation. Another limitation is that it is not possible to discern morphological vs. functional properties of the LPCA without application of vasodilator drugs. One would have to determine lumen diameter, wall thickness, and W/L ratio in a completely relaxed LPCA to assess the true structural properties of the blood vessel in the absence of vascular tone. For example, we cannot exclude the possibility that the smaller lumen diameter and greater W/L ratio in SHR compared with WKY observed during the 10-wk observation period in this study is simply due to greater vascular tone (or greater responsiveness to stress associated with handling conscious rats) in SHR than in WKY and that there are no true structural differences. Our attempt to completely relax the LPCA using papaverine (Fig. 9) was not successful because we were unable to apply papaverine at doses that elicit a maximal vasodilation. However, the findings that lumen diameter of the LPCA (Fig. 8) was significantly smaller and the W/L ratio (1.02 ± 0.075 in SHR vs. 0.86 ± 0.036 in WKY, P < 0.05) was significantly larger in SHR than in WKY rats following pilocarpine-induced vasorelaxation suggests that the observed differences in morphological parameters of the LPCA during the 10-wk observation period mainly reflect structural differences between SHR and WKY. While local drug application by eye drops has the advantage of preventing systemic drug effects, it also has some disadvantages. Because cornea thickness varies between animal strains (17, 18), absorption through the cornea may also vary from strain to strain and, therefore, contribute to the variability of the effective dose of a drug. The theoretical possibility to inject drugs through the cornea utilizing an injection needle has not been explored in this study but would certainly be possible. Furthermore, as our papaverine experiments demonstrate, water solubility of some drugs (e.g., Ca2+-channel blockers, papaverine) is low and, therefore, it may not be possible to apply maximal doses of some drugs, because ethanol or DMSO cannot be used as solvents for corneal application of drugs. Finally, another limitation of the in vivo imaging technique is that the relationship between transmural pressure of the LPCA and intraocular pressure can be a confounding factor in studies in which intraocular pressure is not constant.
In conclusion, the results of this study demonstrate that in vivo imaging of the LPCA allows assessment of structural and functional parameters of this resistance artery in conscious rats. In addition, drugs can be applied locally as eye drops, allowing for a variety of functional vascular studies, including assessment of endothelial function. Finally, the technique has the potential to be adapted to the smaller anatomy of mice and may allow for even more advanced vascular examinations, such as studying vascular compliance and possibly shear rate and shear stress.
Perspectives and Significance
Based on our initial experiences with this technique, we envision several opportunities for continued refinements that would broaden its applicability. First, it might be possible to determine vascular compliance of the LPCA by synchronizing the shutter of the digital camera with the cardiac cycle. Such synchronization would allow capturing images during systole and diastole. The relation between pulse pressure and systolic/diastolic lumen diameter difference may then be used as a measure of vascular compliance. Of course, such experiments should also be performed in pharmacologically relaxed blood vessels. Second, the observation that axial migration of erythrocytes causes a bright band in the center line of the vessel lumen (Fig. 1, lower left) might offer another potential application of this technique. If it were possible to establish the relationships between the width of this center line, the magnitude of axial migration of erythrocytes, and the shear rate and/or shear stress within the blood vessel, in vivo imaging of the LPCA may be used to study the interaction between shear rate, shear stress, and structural and functional properties of the LPCA.
GRANTS
This study was primarily supported by grants from the American Heart Association Midwest Affiliate (09GRNT2260948) and the Biological Sciences Funding Program of The University of Iowa. M. G. Anderson is supported by National Institute of Arthritis and Musculoskeletal and Skin Diseases Grant AR055697 and National Eye Institute Grant EY017673.
DISCLOSURES
No conflicts of interest, financial or otherwise, are declared by the author(s).
REFERENCES
- 1. Akasaka H, Katsuya T, Saitoh S, Sugimoto K, Ohnishi H, Congrains A, Ohnishi M, Ohishi M, Rakugi H, Ogihara T, Shimamoto K. A promoter polymorphism of lamin A/C gene is an independent genetic predisposition to arterial stiffness in a Japanese general population (the Tanno and Sobetsu study). J Atheroscler Thromb 16: 404–409, 2009 [DOI] [PubMed] [Google Scholar]
- 2. Akata T. General anesthetics and vascular smooth muscle: direct actions of general anesthetics on cellular mechanisms regulating vascular tone. Anesthesiology 106: 365–391, 2007 [DOI] [PubMed] [Google Scholar]
- 3. Anderson MG, Hawes NL, Trantow CM, Chang B, John SW. Iris phenotypes and pigment dispersion caused by genes influencing pigmentation. Pigment Cell Melanoma Res 21: 565–578, 2008 [DOI] [PMC free article] [PubMed] [Google Scholar]
- 4. Bellien J, Thuillez C, Joannides R. Contribution of endothelium-derived hyperpolarizing factors to the regulation of vascular tone in humans. Fundam Clin Pharmacol 22: 363–377, 2008 [DOI] [PubMed] [Google Scholar]
- 5. Berenson GS, Srinivasan SR, Bao W, Newman WP, III, Tracy RE, Wattigney WA. Association between multiple cardiovascular risk factors and atherosclerosis in children and young adults. The Bogalusa Heart Study. N Engl J Med 338: 1650–1656, 1998 [DOI] [PubMed] [Google Scholar]
- 6. Bianchini E, Bozec E, Gemignani V, Faita F, Giannarelli C, Ghiadoni L, Demi M, Boutouyrie P, Laurent S. Assessment of carotid stiffness and intima-media thickness from ultrasound data: comparison between two methods. J Ultrasound Med 29: 1169–1175 [DOI] [PubMed] [Google Scholar]
- 7. Dong Y, Watabe H, Cui J, Abe S, Sato N, Ishikawa H, Yoshitomi T. Reduced effects of endothelium-derived hyperpolarizing factor in ocular ciliary arteries from spontaneous hypertensive rats. Exp Eye Res 90: 324–329 [DOI] [PubMed] [Google Scholar]
- 8. Dupuis J, Tardif JC, Cernacek P, Theroux P. Cholesterol reduction rapidly improves endothelial function after acute coronary syndromes. The RECIFE (reduction of cholesterol in ischemia and function of the endothelium) trial. Circulation 99: 3227–3233, 1999 [DOI] [PubMed] [Google Scholar]
- 9. Folkow B, Gothberg G, Lundin S, Ricksten SE. Structural “resetting” of the renal vascular bed in spontaneously hypertensive rats (SHR). Acta Physiol Scand 100: 270–272, 1977 [DOI] [PubMed] [Google Scholar]
- 10. Folkow B, Svanborg A. Physiology of cardiovascular aging. Physiol Rev 73: 725–764, 1993 [DOI] [PubMed] [Google Scholar]
- 11. Gao YJ, Yang LF, Stead S, Lee RM. Flow-induced vascular remodeling in the mesenteric artery of spontaneously hypertensive rats. Can J Physiol Pharmacol 86: 737–744, 2008 [DOI] [PubMed] [Google Scholar]
- 12. Guthikonda S, Sinkey CA, Haynes WG. What is the most appropriate methodology for detection of conduit artery endothelial dysfunction? Arterioscler Thromb Vasc Biol 27: 1172–1176, 2007 [DOI] [PubMed] [Google Scholar]
- 13. Iguchi M, Nakajima T, Hisada T, Sugimoto T, Kurachi Y. On the mechanism of papaverine inhibition of the voltage-dependent Ca2+ current in isolated smooth muscle cells from the guinea pig trachea. J Pharmacol Exp Ther 263: 194–200, 1992 [PubMed] [Google Scholar]
- 14. Johnson HM, Gossett LK, Piper ME, Aeschlimann SE, Korcarz CE, Baker TB, Fiore MC, Stein JH. Effects of smoking and smoking cessation on endothelial function: 1-year outcomes from a randomized clinical trial. J Am Coll Cardiol 55: 1988–1995, 2010 [DOI] [PMC free article] [PubMed] [Google Scholar]
- 15. Kurtz TW, Morris RC., Jr Biological variability in Wistar-Kyoto rats. Implications for research with the spontaneously hypertensive rat. Hypertension 10: 127–131, 1987 [DOI] [PubMed] [Google Scholar]
- 16. Li JS, Schiffrin EL. Effect of short-term treatment of SHR with the novel calcium channel antagonist mibefradil on function of small arteries. Am J Hypertens 10: 94–100, 1997 [DOI] [PubMed] [Google Scholar]
- 17. Lively GD, Jiang B, Hedberg-Buenz A, Chang B, Petersen GE, Wang K, Kuehn MH, Anderson MG. Genetic dependence of central corneal thickness among inbred strains of mice. Invest Ophthalmol Vis Sci 51: 160–171 [DOI] [PMC free article] [PubMed] [Google Scholar]
- 18. Lively GD, Koehn D, Hedberg-Buenz A, Wang K, Anderson MG. Quantitative trait loci associated with murine central corneal thickness. Physiol Genomics 42: 281–286 [DOI] [PMC free article] [PubMed] [Google Scholar]
- 19. Manzoli A, Andreotti F, Leone AM, Sperti G, Zecchi P, Di Sciascio G. Vascular and haemostatic gene polymorphisms associated with non-fatal myocardial infarction: A critical review. Ital Heart J 1: 184–193, 2000 [PubMed] [Google Scholar]
- 20. Martinez-Lemus LA, Hill MA, Meininger GA. The plastic nature of the vascular wall: a continuum of remodeling events contributing to control of arteriolar diameter and structure. Physiology 24: 45–57, 2009 [DOI] [PubMed] [Google Scholar]
- 21. Moncada S, Palmer RM, Higgs EA. Nitric oxide: physiology pathophysiology, pharmacology. Pharmacol Rev 43: 109–142, 1991 [PubMed] [Google Scholar]
- 22. Morimoto S, Maki K, Aota Y, Sakuma T, Iwasaka T. Beneficial effects of combination therapy with angiotensin II receptor blocker and angiotensin-converting enzyme inhibitor on vascular endothelial function. Hypertens Res 31: 1603–1610, 2008 [DOI] [PubMed] [Google Scholar]
- 23. Mulvany MJ. Vascular remodelling in hypertension. Eur Heart J 14, Suppl C: 2–4, 1993 [DOI] [PubMed] [Google Scholar]
- 24. Mulvany MJ. Vascular remodelling of resistance vessels: can we define this? Cardiovasc Res 41: 9–13, 1999 [DOI] [PubMed] [Google Scholar]
- 25. Payne JA, Reckelhoff JF, Khalil RA. Role of oxidative stress in age-related reduction of NO-cGMP-mediated vascular relaxation in SHR. Am J Physiol Regul Integr Comp Physiol 285: R542–R551, 2003 [DOI] [PubMed] [Google Scholar]
- 26. Rashid P, Leonardi-Bee J, Bath P. Blood pressure reduction and secondary prevention of stroke and other vascular events: a systematic review. Stroke 34: 2741–2748, 2003 [DOI] [PubMed] [Google Scholar]
- 27. Roman MJ, Alderman MH, Pickering TG, Pini R, Keating JO, Sealey JE, Devereux RB. Differential effects of angiotensin converting enzyme inhibition and diuretic therapy on reductions in ambulatory blood pressure, left ventricular mass, and vascular hypertrophy. Am J Hypertens 11: 387–396, 1998 [DOI] [PubMed] [Google Scholar]
- 28. Rush JW, Ford RJ. Nitric oxide, oxidative stress and vascular endothelium in health and hypertension. Clin Hemorheol Microcirc 37: 185–192, 2007 [PubMed] [Google Scholar]
- 29. Sasaki R, Yamano S, Yamamoto Y, Minami S, Yamamoto J, Nakashima T, Takaoka M, Hashimoto T. Vascular remodeling of the carotid artery in patients with untreated essential hypertension increases with age. Hypertens Res 25: 373–379, 2002 [DOI] [PubMed] [Google Scholar]
- 30. Schleier J. Der Energieverbrauch in der Blutbahn. Archiv für die Gesamte Physiologie des Menschen und der Thiere 173: 172–204, 1918 [Google Scholar]
- 31. Schmieder RE, Weihprecht H, Schobel H, John S, Weidinger G, Gatzka C, Veelken R. Is endothelial function of the radial artery altered in human essential hypertension? Am J Hypertens 10: 323–331, 1997 [DOI] [PubMed] [Google Scholar]
- 32. Skov K, Mulvany MJ, Korsgaard N. Morphology of renal afferent arterioles in spontaneously hypertensive rats. Hypertension 20: 821–827, 1992 [DOI] [PubMed] [Google Scholar]
- 33. Smith RL, Raviola G. The structural basis of the blood-aqueous barrier in the chicken eye. Invest Ophthalmol Vis Sci 24: 326–338, 1983 [PubMed] [Google Scholar]
- 34. Takata M, Ueno H, Hirai T, Oh-hashi S, Yasumoto K, Inoue H. Time course of the effects of temocapril on cardiovascular structure and function in patients with essential hypertension. J Cardiovasc Pharmacol 34: 561–566, 1999 [DOI] [PubMed] [Google Scholar]
- 35. Touze E, Varenne O, Chatellier G, Peyrard S, Rothwell PM, Mas JL. Risk of myocardial infarction and vascular death after transient ischemic attack and ischemic stroke: a systematic review and meta-analysis. Stroke 36: 2748–2755, 2005 [DOI] [PubMed] [Google Scholar]
- 36. Trantow CM, Hedberg-Buenz A, Iwashita S, Moore SA, Anderson MG. Elevated oxidative membrane damage associated with genetic modifiers of lyst-mutant phenotypes. PLoS Genet 6: e1001008, 2010 [DOI] [PMC free article] [PubMed] [Google Scholar]
- 37. Trantow CM, Mao M, Petersen GE, Alward EM, Alward WL, Fingert JH, Anderson MG. Lyst mutation in mice recapitulates iris defects of human exfoliation syndrome. Invest Ophthalmol Vis Sci 50: 1205–1214, 2009 [DOI] [PMC free article] [PubMed] [Google Scholar]
- 38. Widdop RE, Li XC. A simple versatile method for measuring tail cuff systolic blood pressure in conscious rats. Clin Sci (Lond) 93: 191–194, 1997 [DOI] [PubMed] [Google Scholar]
- 39. Yang AL, Jen CJ, Chen HI. Effects of high-cholesterol diet and parallel exercise training on the vascular function of rabbit aortas: a time course study. J Appl Physiol 95: 1194–1200, 2003 [DOI] [PubMed] [Google Scholar]
- 40. Zanchi A, Brunner HR, Hayoz D. Age-related changes of the mechanical properties of the carotid artery in spontaneously hypertensive rats. J Hypertens 15: 1415–1422, 1997 [DOI] [PubMed] [Google Scholar]


