

Abstract
Activation of G protein-coupled receptors (GPCRs) is a complex phenomenon. Here, we applied Induced Fit docking (IFD) in tandem with linear discriminant analysis (LDA) to generate hypotheses on the conformational changes induced to the β2-adrenergic receptor by agonist binding, preliminary to the sequence of events that characterize activation of the receptor. This analysis, corroborated by a follow-up molecular dynamics study, suggested that agonists induce subtle movements to the fifth transmembrane domain (TM5) of the receptor. Furthermore, molecular dynamics also highlighted a correlation between movements of TM5 and the second extracellular loop (EL2), suggesting that freedom of motion of EL2 is required for the agonist-induced TM5 displacement. Importantly, we also showed that the IFD/LDA procedure can be used as a computational means to distinguish agonists from blockers on the basis of the differential conformational changes induced to the receptor. In particular, the two most predictive models obtained are based on the RMSD induced to Ser207 and on the counterclockwise rotation induced to TM5.
INTRODUCTION
G protein-coupled receptors (GPCRs) constitute the largest and most ubiquitous superfamily of membrane receptors [1]. Structurally, they are constituted by a single polypeptide chain that spans the plasma membrane with seven transmembrane domains (TMs, numbered from TM1 to TM7) connected by three extracellular and three intracellular loops (ELs and ILs, numbered from EL1 to EL3 and from IL1 to IL3). Being the most common target of pharmacological intervention, GPCRs represent an extremely attractive field for pharmaceutical research. For these reasons, many efforts have been directed toward their structural characterization and, thanks to important technological and scientific breakthroughs, brought to the recent solution of the structure of a few of the members of the superfamily [2–5]. Importantly, these structures provide detailed information directly applicable to drug discovery, allowing for an effective identification of novel ligands through virtual screening [6–14]. Moreover, they also serve as a platform to calibrate and further the accuracy of theoretical structures derived from homology modeling and molecular docking [11–17].
Many pharmacological, biophysical and computational studies have been devoted to the investigation of the mechanisms underlying GPCR activation. These combined efforts led to the hypothesis that local conformational changes induced by agonist binding are propagated through a number of subsequent structural rearrangements that gradually provoke a transition from the inactive to a variety of active conformations. Ultimately, these activated states are responsible for triggering complex G protein dependent or independent signaling pathways [1, 18–23]. Of note, GPCR activation has also been proposed to be associated with changes of the dimeric interface of the receptors [24, 25].
While GPCR activation is a complex phenomenon, here we describe computational studies intended to generate hypotheses on the immediate conformational changes induced by agonists to the β2-adrenergic receptor (β2-AR), preliminary to the transition of the receptor to the activated state. Specifically, we studied the local conformational changes that agonists and blockers differentially induce to the β2-AR by applying linear discriminant analysis (LDA) [26] in tandem with a docking procedure [27] that takes into account the flexibility of receptor and ligands (Figure 1). The study was conducted in an unbiased manner, analyzing all possible conformational changes occurring within the domains of the receptor that line the interhelical cavity. In particular, flexibility was granted to three large receptor segments, each of which comprising the exofacial half of two adjacent transmembrane domains and the extracellular loop that connects them (Figure 2). Importantly, the hypotheses on agonist binding resulting from LDA analysis of flexible docking data were also corroborated by follow-up molecular dynamics simulations, conducted after embedding the receptor in a hydrated lipid bilayer model. Moreover, our study indicated that LDA analysis of flexible docking data, besides being applicable to the generation of structural hypotheses on ligand binding, can also offer an effective computational procedure for the differentiation of ligands into agonists and blockers.
Figure 1.

Flowchart showing the different phases implicated in the development of the IFD/LDA models.
Figure 2.
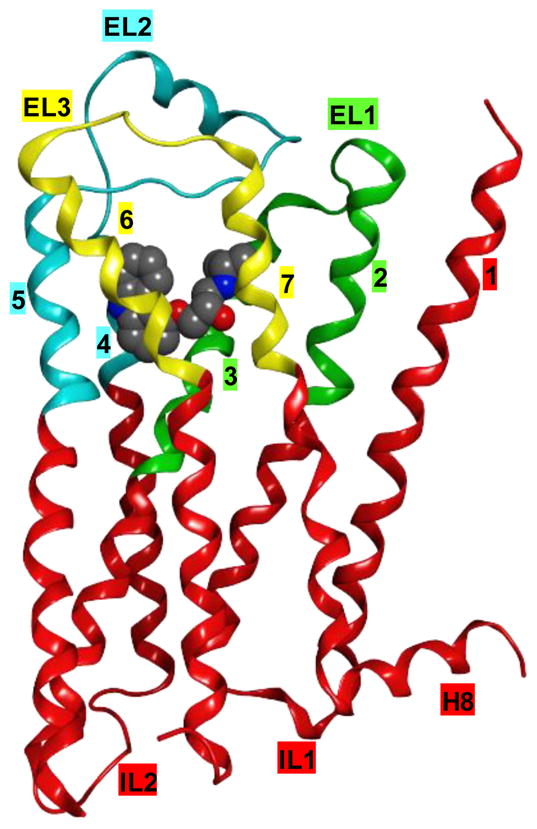
Ribbon representation of the β2-AR (PDB ID: 2RH1) indicating the residues treated as flexible in the IFD procedure. Segment 1 (from Met82 to Ile121) is colored in green, segment 2 (from Thr164 to Tyr209) in cyan and segment 3 (from Trp286 to Tyr316) in yellow. The co-crystallized carazolol is represented in space filling mode. Labels indicate the seven TMs, numbered from 1 to 7, extracellular and intracellular loops (ELs and ILs), and the amphipathic helix 8 (H8). The third intracellular loop (IL3) is not represented because it was replaced with T4-lysozyme in the crystal structure.
The β2-AR, and GPCRs in general, can couple to multiple G proteins and can signal through G protein independent pathways, in a ligand-dependent manner [22]. Throughout this paper, whenever we refer to agonists and blockers of the β2-AR, we refer to compounds capable of stimulating or blocking receptor-mediated Gs activation.
RESULTS
A previously collected database of 66 β2AR ligands [10] – 34 agonists and 32 blockers of the Gs stimulation pathway, see Table S1 of the Supporting Information – was docked by means of Schrödinger’s Induced Fit docking (IFD) [27] procedure at the crystal structure of the β2-AR obtained in complex with the inverse agonist carazolol (PDB ID: 2RH1) [28, 29]. Notably, we define agonists all compounds with intrinsic activity greater than 15% of that measured for the full agonist isoproterenol (including partial agonists and full agonists), while we define blockers all the remaining compounds (including very weak partial agonists, neutral antagonists and inverse agonists). As shown in Figure 2, in the IFD procedure we allowed flexibility to all the residues contained within three specific sequence segments that form the exofacial half of the receptor and enclose the interhelical binding cavity. Specifically, each segment was composed by the exofacial half of two adjacent TMs and the entire interconnecting loop: TM2-EL1-TM3 (from Met822.53 to Ile1213.40), TM4-EL2-TM5 (from Thr1644.56 to Tyr2095.48), and TM6-EL3-TM7 (from Trp2866.48 to Tyr3167.43). The N-terminus and the exofacial half of TM1 were not granted flexibility because of their distance from the ligand binding site.
For each docked ligand, the IFD procedure yielded a number of complexes, each with a specific ligand pose and a specific binding pocket conformation. After having detected for each ligand the most populated cluster of docking poses, we eliminated all the spurious poses, defined as those having an RMSD (root mean square deviation) higher than 3Å from the lowest energy structure of the main cluster. For most of the compounds, the main cluster of poses featured the positively charged amino group interacting with Asp1133.32 and the aromatic moiety pointing towards TM5, in line with what was shown for carazolol by the crystal structure [28, 29]. However, for 5 ligands (acebutolol, carvedilol, fenoterol, formoterol and T-0509) the main cluster did not show these well known interactions. Thus, for these ligands we discarded the first cluster and considered, instead, the second most populated cluster.
We subsequently used the ensemble of receptor conformations produced for each of the docked ligands to calculate the average RMSD of each flexible residue and the average rotation of each flexible TM segment, with respect to the crystal structure of the receptor in complex with its inverse agonist carazolol. Notably, the monitoring of the rotation of the TMs was possible because the region to which we granted flexibility in the docking procedure contained uninterrupted TM segments.
Classification models based on the residue RMSDs
To identify the individual residues most differentially affected by agonists and blockers, we subjected all the calculated RMSD values to linear discriminant analysis (LDA) [26], using the forward stepwise algorithm for variable selection. As a result, we found a group of residues located in TM5 to be the most discriminating. In particular, high RMSD levels for these residues were associated with docking of agonists and low RMSD levels were associated with docking of blockers. This is also graphically evident from the plots shown in Figure 3, which compare side-by-side the average RMSD of the flexible residues detected for a representative agonist (isoproterenol) and a representative blocker (carazolol).
Figure 3.

Plots of the average RMSDs induced to the residues treated as flexible in the IFD procedure by a representative agonist (isoproterenol) and a representative inverse agonist (carazolol). Residues with RMSD values of zero were treated as rigid.
Details of the three models that yielded the best percentages of good classification are given in Table 1. The most predictive of these models is based on the RMSD of the backbone of Ser2075.46. In particular, we found that the probability of a compound to be an agonist (Pagonist) was related to the average RMSD induced by the compound on the backbone of Ser2075.46 through the following equation:
| (1) |
Table 1.
The RMSD induced by the ligands on all the residues treated as flexible in the Induced Fit docking procedure was subjected to a forward stepwise variable selection to identify the models endowed with the highest discriminatory power. The top three resulting LDA models are based on the RMSD of the backbone of Ser2075.46, Val2065.45 and Phe2085.47.
| Model 1 (RMSD_ Ser2075.46) | |||
| % CCa | CCb | MCc | |
| Agonist | 82.35 | 28 | 6 |
| Blockers | 93.75 | 30 | 2 |
| Total | 87.88 | 58 | 8 |
| U = 0.499 F (1,64) = 64.28809 p < 0.000 | |||
| Model 2 (RMSD_ Val2065.45) | |||
| % CC | CC | MC | |
| Agonist | 82.35 | 28 | 6 |
| Blockers | 81.25 | 26 | 6 |
| Total | 81.82 | 54 | 12 |
| U = 0.543 F (1,64) = 53.848 p < 0.000 | |||
| Model 3 (RMSD_ Phe2085.47) | |||
| % CC | CC | MC | |
| Agonist | 79.41 | 27 | 7 |
| Blockers | 87.50 | 28 | 4 |
| Total | 83.33 | 55 | 11 |
| U = 0.595 F (1,64) = 43.627 p < 0.000 | |||
% CC is the percentage of correctly classified compounds.
CC is the number of correctly classified compounds.
MC is the number of misclassified compounds. To test the quality of the derived discriminant function, we used Wilks’ statistic (U), Fisher ratio (F) and the significance level (p).
As graphically represented in Figure 4, according to this equation, a demarcation line corresponding to an average backbone RMSD of Ser2075.46 of 1.23 Å classified correctly 82.35% of the agonists and 93.75% of the blockers. The exception were six agonists that induced RMSDs lower than 1.23 Å – namely formoterol, salbutamol, sulfonterol, AH-3021, broxaterol, and T-0509 – and two blockers that induced RMSDs greater than 1.23 Å – namely (SRRR)-Nebivolol and sotalol.
Figure 4.

Plot of the average RMSD induced by the docked ligands to Ser2075.46: a demarcation line at 1.23 Å correctly classifies 82.35% of the agonists and 93.75 % of the blockers. Each dot represents the average RMSD induced by a particular compound. Agonists, defined as the compounds with an intrinsic activity greater than 15% relatively to isoproterenol, are in green, while blockers, defined as the compounds with an intrinsic activity lower than 15% relatively to isoproterenol, are in red. The misclassified agonists are formoterol, salbutamol, broxaterol, sulfonterol, AH-3021 and T-0509. The misclassified blockers are sotalol and (SRRR)-Nebivolol.
We also analyzed the RMSD of the entire residues, side chain included. The results are in line with those obtained with the backbone RMSD, although the percentages of good classification were slightly lower (data not shown).
Classification models based on TM rotations
As mentioned, in addition to RMSD values, we also monitored the rotations induced by the different ligands to the various TMs. Our LDA analysis revealed that the rotation of TM5 yielded by far the best discriminatory model (Table 2). Specifically, greater counterclockwise rotations of TM5 were associated with the binding of agonists, while smaller counterclockwise rotations of the same TM were associated with the binding of blockers. In particular, we found the probability of a compound to be an agonist to be related to the rotation that the compound induced on TM5 by the following equation:
| (2) |
Table 2.
LDA models based on the TM rotations measured after Induced Fit docking. The best model was obtained with the rotation of TM5, with percentages of good classification above 85%.
| TM2 rotation | |||
| % CCa | CCb | MCc | |
| Agonist | 47.06 | 16 | 18 |
| Blockers | 50.00 | 16 | 16 |
| Total | 48.48 | 32 | 34 |
| U = 0.972 F (1,64) = 1.873 p < 0.176 | |||
| TM3 rotation | |||
| % CC | CC | MC | |
| Agonist | 64.71 | 22 | 12 |
| Blockers | 68.75 | 22 | 10 |
| Total | 66.67 | 44 | 22 |
| U = 0.866 F (1,64) = 9.908 p < 0.003 | |||
| TM4 rotation | |||
| % CC | CC | MC | |
| Agonist | 58.82 | 20 | 14 |
| Blockers | 46.88 | 15 | 17 |
| Total | 53.03 | 35 | 31 |
| U = 0.999 F (1,64) = 0.023 p < 0.881 | |||
| TM5 rotation | |||
| % CC | CC | MC | |
| Agonist | 85.29 | 29 | 5 |
| Blockers | 87.50 | 28 | 4 |
| Total | 86.36 | 57 | 9 |
| U = 0.595 F (1,64) = 43.552 p < 0.000 | |||
| TM6 rotation | |||
| % CC | CC | MC | |
| Agonist | 79.41 | 27 | 7 |
| Blockers | 59.38 | 19 | 13 |
| Total | 69.70 | 46 | 20 |
| U = 0.819 F (1,64) = 14.176 p < 0.001 | |||
| TM7 rotation | |||
| % CC | CC | MC | |
| Agonist | 76.47 | 26 | 8 |
| Blockers | 56.25 | 18 | 14 |
| Total | 66.67 | 44 | 22 |
| U = 0.925 F (1,64) = 5.201 p < 0.026 | |||
% CC is the percentage of correctly classified compounds.
CC is the number of correctly classified compounds.
MC is the number of misclassified compounds. To test the quality of the derived discriminant function, we used Wilks’ statistic (U), Fisher ratio (F) and the significance level (p).
As graphically represented in Figure 5, according to this equation, a demarcation line corresponding to a counterclockwise rotation of TM5 of 6.18° classified correctly 85.3% of the agonists and 87.5% of the blockers. The exceptions were five agonists that induced counterclockwise rotations smaller than 6.18° – namely formoterol, salbutamol, sulfonterol, AH-3021, and zinterol – and four blockers that induced counterclockwise rotations greater than 6.18° – namely (SRRR)-Nebivolol, dichloroisoproterenol, H87, and xamoterol.
Figure 5.

Plot of the average counterclockwise rotation induced by the docked ligands to TM5: a demarcation line at 6.18° correctly classifies 85.29% of the agonists and 87.50% of the blockers – positives angles indicate counterclockwise rotations, negative angles indicate clockwise rotations. Each dot represents the average RMSD induced by a particular compound. Agonists, defined as the compounds with an intrinsic activity greater than 15% relatively to isoproterenol, are in green, while blockers, defined as the compounds with an intrinsic activity lower than 15% relatively to isoproterenol, are in red. The misclassified agonists are formoterol, salbutamol, sulfonterol, AH-3021 and zinterol. The misclassified blockers are dichloroisoproterenol, H87, xamoterol and (SRRR)-Nebivolol (outlier). Four blockers were predicted to have TM5 clockwise rotation upon the binding (carazolol, propranolol, nadolol and ICI-118551).
Notably, four compounds endowed with inverse agonistic activity, carazolol, propranolol, nadolol and ICI-118551, were predicted to induce clockwise rotations to TM5 upon binding, indicating a conformational change opposite to the one induced by agonists.
Molecular dynamics confirms the differential effect of agonists and blockers on TM5 and suggests a correlation between TM5 and EL2 movements
To further explore the effect of agonists and blockers on the conformation of TM5, we embedded the crystal structure of the β2AR in a lipid bilayer hydrated model and subjected the whole system to a series molecular dynamics simulations with Desmond [30]. In particular, we simulated the dynamics of the receptor in complex with either the co-crystallized inverse agonist carazolol or the full agonist isoproterenol – the simulations were repeated twice for each system and average results are reported. As indicated by the monitoring of the RMSD of the receptor backbone over the course of the trajectory, each system reached and maintained a stable equilibrium for at least the last 20 ns of the trajectory (Figure S1 of Supporting Information). As shown in Figure 6, TM5 underwent greater conformational changes in the simulation of the isoproterenol-bound receptor than in that of the carazolol-bound receptor, thus corroborating the observations derived from our IFD-LDA analysis. Pictures showing receptor-ligand complexes obtained for carazolol and isoproterenol after the energy minimization of the endpoint molecular dynamics structures are given in Figure 7. Both compounds bridged TM3 and TM5. In particular, they both interacted with Asp1133.32 through their positively charged amino group and with TM5 through their aromatic moieties. However, the distance between the nitrogen of the positively charged amine and the centroid of the aromatic moiety is generally shorter for agonist than blockers. In particular, in the bound conformation of isoproterenol and carazolol it amounts to 5.1 Å and 6.6 Å, respectively (see Figure S2 of Supporting Information). Thus, in light of this key difference, the agonist had the effect of pulling TM5 closer to TM3 as a result of the simulation.
Figure 6.

The evolution of the RMSD of the backbone of TM5 (a), from residues Gln197 to Gln229, and EL2 (b), from residues Cys191 to Asn196, over the 50 ns trajectory is shown for each simulation. The red trajectory is relative to the simulation in which the inverse agonist carazolol is bound. The green trajectory is relative to the simulation in which the agonist isoproterenol is bound. The black trajectory is relative to the simulation in which the agonist isoproterenol is bound and a harmonic restraint was applied to Phe193EL2.52.
Figure 7.

Pictures showing the minimized receptor-ligand complexes for carazolol and isoproterenol after the simulations (50 ns). The β2-AR-carazolol complex is shown with the residues in red, the ligand in magenta, and the receptor backbone as a thick ribbon colored according to residue position (blue: N-terminus, red: C-terminus). The β2-AR-isoproterenol complex is shown with the residues in green, the ligand in yellow, and the receptor backbone as a thin white line.
It is also evident from Figure 7 that, during the simulation, isoproterenol dropped more deeply into the binding cavity than carazolol, pulling down with it also the C-terminal portion of EL2. As a result, the simulation of the isoproterenol-bound system produced higher RMSDs not only for TM5 (Figure 6a) but also for the adjacent EL2 (Figure 6b), when compared to the simulation of the carazolol-bound system. Thus, to check if the detected EL2 movement was a requisite for that of TM5, we subjected the system to a third molecular dynamics simulation, also in this case performed in duplicate. In this last computational experiment, we simulated again the isoproterenol-bound system; however, this time we applied a harmonic positional restraint to Phe193EL2.52, which, as outlined by the crystal structures, is the β2AR residue that establishes the largest contacts with carazolol. Remarkably, the simulation conducted with the bound isoproterenol, but with a positional restraint applied to Phe193EL2.52, resulted in significantly lower TM5 movements, giving a response extremely similar to that registered in the simulations with the inverse agonist carazolol (Figure 6a).
DISCUSSION
Our Induced Fit docking experiments and molecular dynamics simulations results suggest that subtle translations and rotations of TM5 are an important component of agonist binding. In particular, in our in silico studies agonists had the effect of pulling TM5 closer to TM3, due to the shorter distance between positively charged amine and aromatic moiety that characterizes these compounds when compared to blockers.
In line with our results, the crystal structure of the β2-AR indicates that agonist binding would require a conformational change of TM5 in order to allow the experimentally postulated interactions with residues Ser2045.43 and Ser2075.46 [28, 29]. Similarly, on the basis of molecular modeling, Goddard et al. predicted that a substantial counterclockwise rotation of TM5 upon the binding of an agonist would allow this interaction to occur [31]. Through a systematic mapping of the rotational energy landscape of each of the seven TMs of the β2-AR, Vaidehi and coworkers also predicted an agonist induced counterclockwise rotation of TM5, viewed from the extracellular side [32, 33]. Moreover, Abagyan and coworkers also hypothesized a coupling between the binding of agonists of the β2-AR and TM5 movements [34].
Our study suggested that EL2 movements are also an important component of agonist binding and are interrelated with TM5 movements. In particular, our molecular dynamics simulations suggested that blocking the freedom of motion of EL2 consequently results in the prevention of agonist-induced TM5 displacements.
In line with our results, the importance of EL2 in GPCR-ligand recognition and receptor activation has been suggested by multiple experimental and computational studies [35–42]. Through molecular dynamics simulations, we previously proposed that agonist binding disrupts a salt bridge that, in the ground state of the P2Y6 receptor, connects an arginine of TM3 to an aspartate of EL2, located at the position corresponding to Phe193EL2.52 in the β2-AR [35]. Furthermore, molecular modeling studies of the FFA1 receptor suggested an analogous anchoring of EL2 to the helical bundle in the unliganded state, via a salt bridge between a TM5 arginine and a glutamate residue also located at position EL2.52 [37]. Experimentally, the general role of EL2 in ligand binding was examined in the case of the dopamine D2 receptors, as well [39]. By mutating various EL2 residues to cysteine and examining if disulfide formation inhibited ligand binding, the authors found that the flexibility of the loop is involved in the regulation of ligand activity. Moreover, a recent solid state 13C NMR study on rhodopsin showed a coupling between EL2 and TM5 movement upon retinal isomerization [40]. Finally, Kobilka et al. found through NMR spectroscopy that agonists and inverse agonists induced different conformational changes to the extracellular domains of the β2-AR [43]. In particular, their data suggested that the salt bridge between Lys3057.32, located at the boundary between TM7 and EL3, and Asp192EL2.51 is attenuated in the active conformation of the receptor. In light of these data, we monitored the distance between the carboxylate carbon atom of Asp192EL2.51 and the nitrogen atom of Lys3057.32 in our molecular dynamics similations. We detected the disruption of the salt bridge in every simulation. However, in agreement with what was seen by Kobilka and coworkers, we measured higher distances in the simulations with isoproterenol (average: 3.91 Å) compared to those with carazolol (average: 3.56 Å) or with isoproterenol and the positional restraint applied to Phe193EL2.52 (average: 3.61 Å) – see Supporting Information Figure S3.
As mentioned, activation is a complex phenomenon, which involves a cascade of events [21, 23] and, possibly, even changes in the dimeric or oligomeric state of the receptors [24, 25]. With our Induced Fit docking and our molecular dynamics simulations, we probably have captured only the initial conformational changes induced to the β2-AR by the agonist binding. Instead, we did not capture the subsequent conformational changes that lead to the activation of the receptor. The best characterized conformational changes thought to be coupled to β2-AR activation are a rotamer toggle switch composed of two aromatic TM6 residues, namely Trp2866.48 and Phe2906.52, and an ionic lock between Arg1313.50 in TM3 and Glu2686.30 in TM6, the disruption of which supposedly causes the two TMs to move further apart, thus opening a G protein docking site [44, 45]. We did not detect the movement of Trp2866.48 as shown by the monitoring of the evolution of the χ1 dihedral angle of this residue over the course of the 50 ns simulations (Supporting Information Figure S4). Moreover, the ionic lock between Arg1313.50 and Glu2686.30, already broken in the crystal structure, formed only transiently in the simulations with both the agonist and the blocker. We also did not detect the formation of contacts between the ligands and Asn2936.55, which has been proposed to establish interactions with the β-hydroxyl group of agonists [46]. However, biochemical experiments conducted by Kobilka and coworkers suggest that interactions involving the β-hydroxyl group take place on a slower time scale than other changes [18]. Longer simulations, in the microsecond time scale, analogous to those performed by Dror and coworkers for the β2-AR in complex with carazolol [47] have the potential of capturing further stages of the activation process.
CONCLUSIONS
Induced Fit docking (IFD) [27] in tandem with linear discriminant analysis (LDA), as well as molecular dynamics simulations, suggested that agonists induce to TM5 larger conformational changes, when compared to blockers. Furthermore, molecular dynamics also highlighted a correlation between movements of TM5 and EL2, suggesting that freedom of motion of EL2 is required for the subtle displacement of TM5 induced by agonists. This study also suggests that Induced Fit docking in tandem with linear discriminant analysis can be used as a computational means to distinguish agonists from blockers on the basis of differential conformational changes induced to the receptor. In the case of the β2-AR, the two most predictive models were based on the RMSD induced to Ser2075.46 (1) and on the counterclockwise rotation induced to TM5 (2).
Importantly, a key factor at the basis of our analysis was the way we defined the flexible region of the receptor, which was characterized by three uninterrupted segments, each of which composed by the exofacial portion of two adjacent TMs and the entire interconnecting extracellular loop (Figure 2). Due to its simplicity and the rapidity of the procedure, the Induced Fit docking/LDA analysis is suitable for the study of receptor-ligand interactions and the production of classification models on a large scale.
MATERIALS AND METHODS
GPCR residue identifiers
To facilitate the comparison among receptors, throughout the article, amino acid residues are designated not only with their residue number in the β2AR sequence but also with a superscript extension containing the GPCR residue identifier [48, 49]. This system was derived through the analysis of a multiple sequence alignment of Class A GPCRs by Ballesteros and Weinstein, who selected a reference position, usually occupied by the most conserved residue, for each TM. By convention, to this reference position is assigned the identifier X.50, where X is the TM number; the remaining residues in the TM are then numbered relatively to the reference. In the β2AR, the reference residues are: Asn511.50, Asp792.50, Arg1313.50, Trp1584.50, Pro2115.50, Pro2886.50, Pro3237.50. By extension, we assign the identifier EL2.50 to the conserved cysteine (Cys191EL2.50 in the β2-AR) that in most GPCRs is disulfide-bridged with Cys3.25.
Ligand dataset
The dataset used in this article was composed of 66 β2-AR ligands, divided into 34 agonists and 32 blockers, which we collected from the literature in a previous work (note that the previous work contained a list of 67 ligands, but we subsequently found that Halostachine and Mape are actually the same compound) [10]. Compounds with intrinsic activity lower than 15%, measured as the maximal cAMP level produced upon ligand binding relative to the full agonist isoproterenol, were considered as blockers (including weak partial agonists, antagonists, and inverse agonists), while all those with intrinsic activity higher than 15% were considered agonists. Ligands were sketched in Maestro and subjected to energy minimization with the MacroModel engine using the OPLS_2005 forcefield and water as implicit solvent (PRCG method, 10,000 maximal iterations, with a convergence gradient of 0.001) [50, 51].
Preparation of crystal structure for docking
The crystal structure of the β2-AR in complex with carazolol (PDB ID: 2RH1) [28, 29] was preprocessed with the Protein Preparation Workflow in the Maestro user interface of the Schrödinger package [52]. This procedure added hydrogens, which were subsequently minimized with the OPLS_2005 force field and the impact molecular mechanics engine while heavy atoms were constrained. Furthermore, it optimized the protonation state of His residues and the orientation of hydroxyl groups, Asn residues, and Gln residues. We gave more details on the protein preparation protocol in a previously published paper [53].
Induced-fit docking procedure
Ligands docking of was performed with the Induced Fit docking procedure implemented in the Schrödinger package [27, 54, 55]. Specifically, the procedure involved three consecutive steps: a) a Glide-based docking of the ligands at the receptor, with the standard precision (SP) mode and a vdW scaling factor of 0.5 applied to non polar atoms of receptor and ligands, defined as those with partial charge lower than 0.25e for the receptor and lower than 0.15e for the ligands; b) a Prime-based optimization of the binding pocket for all the complexes obtained in step (a); c) a Glide-based docking of the ligands at each of the optimized binding pockets obtained in step (b), with the extra precision (XP) mode and a vdW scaling factor of 0.8 for the non polar atoms of the ligands only (only the complexes within 30 kcal/mol from the best structure were subjected to this final docking run). For steps (a) and (c) the docking grid was centered on Val1143.33, and was given a size of 26Å. The ligand was treated as completely flexible in all the steps of the procedure. In step (b), flexibility was granted to three uninterrupted receptor segments, each of which was composed of the exofacial half of two adjacent TMs and the entire interconnecting loop (see Figure 2). For each ligand, the top scoring 20 complexes were collected and used for remainder of the study.
Pose Clustering
For each ligand, the most frequent binding mode was identified through the Molecular Operating Environment (MOE) [56], using a custom made SVL script. The spurious poses that did not belong to the most populated cluster were then eliminated.
Calculation of RMSDs
For each of the obtained complexes, the RMSD of the coordinates of the backbone of each flexible residue was measured through the “residue rmsd” script of VMD (version 1.8.3) [57], using as a reference the coordinates of the crystal structure. For each ligand, an average RMSD was then calculated for each flexible residue, taking into account all the accepted complexes relative to that particular ligand. These average residue RMSDs were then used for all subsequent statistical analyses.
Calculation of TM rotations
For each of the obtained complexes, the rotation of the flexible TM segments around their axis was measured through the TRAJELIX [58] program, using as a reference the coordinates of the crystal structure.. For each ligand, an average rotation was then calculated for each TM, taking into account all the accepted complexes relative to that particular ligand. These average TM rotations were then used for all subsequent statistical analyses.
Statistical Methods
The classification models were built through linear discriminant analysis (LDA) [26] carried out with the STATISTICA 8.0 package [59]. In the development of the classification functions, the binary values of 1 and 0 were assigned to agonists and blockers, respectively. The forward stepwise algorithm was used for variable selection. The models were based on the posterior classification probability of the cases, and their quality was tested analyzing Wilks’ statistic (U), Fisher ratio (F), significance level (p), and percentage of good classification.
Molecular Dynamics
All molecular dynamics simulations were performed with Desmond [30], as implemented in the Schrödinger package. The starting model for the carazolol-bound system was the published crystal structure, while for the isoproterenol-bound system we used a complex obtained docking the ligand to the crystal structure with Glide in SP mode. The complexes were preprocessed with the Protein Preparation Workflow in the Maestro user interface of the Schrödinger package [52], as specified above. In analogy to what described by Dror and coworkers, residue Glu-1223.41 was protonated prior to the simulation [47]. Besides receptor and ligands, only the palmitoyl group and the crystallographic water molecules were considered, while the other co-crystallized molecules were deleted. The system was embedded in a fully hydrated POPC (1-palmitoyl-2oleoyl-sn-glycero-3-phosphatidylchlorine) bilayer. The TIP3 model was used to describe the water molecules. Water molecules within 2 Å from the receptor were deleted, with the exclusion of the crystallographic ones. Counter-ions were added to neutralize the system, replacing solvent molecules with chlorine ions. The final system was composed of approximately 35,000 atoms. Before the simulation, the models were relaxed through the following procedure: 1) minimization of the full system, restraining the solute from moving through the application of a harmonic force of 50 kcal/mol/Å2, performed with a maximum 2,000 iterations of a hybrid of the steepest descent and the limited memory Broyden-Fletcher-Goldfarb-Shanno (LBFGS) algorithms, with a convergence threshold of 50.0 kcal/mol/Å2; 2) an unrestrained minimization using the same procedure with a convergence threshold of 5.0 kcal/mol/Å2; 3) a simulation in the NVT ensemble using a Berendsen thermostat, restraining all non-hydrogen solute atoms with a force constant of 50 kcal/mol/Å2, with a simulation time of 12 ps, a time step of 2 fs, a temperature of 10 K, and velocity resampling every 1 ps; 4) a simulation in the NPT ensemble using a Berendsen thermostat, restraining all non-hydrogen solute atoms with a force constant of 50 kcal/mol/Å2, with a simulation time of 24 ps, a time step of 2 fs, a temperature of 300 K, and velocity resampling every 1 ps; 5) a simulation in the NPT ensemble, without restraints, using a Berendsen thermostat with a simulation time of 24 ps, a time step of 2 fs, and a temperature of 300 K, and velocity resampling every 1 ps.
After the initial relaxation protocol, an equilibration consisting of 4 consecutive runs, each of 1 ns, was carried out in the NPT ensemble using a Berendsen thermostat with a temperature of 310 K applying gradually diminishing harmonic restraints: 1) in the first ns, a restraint of 100 kcal/mol/Å2 was applied to receptor, ligand, palmitoyl group, and crystallographic water, while a restraint of 10 kcal/mol/Å2 was applied to the oxygen atoms of the bulk water molecules; 2) in the second ns, a restraint of 10 kcal/mol/Å2 was applied to receptor backbone, ligand, and crystallographic water, while a restraint of 5 kcal/mol/Å2 was applied to the side chains of the receptor and the palmitoyl group and a restraint of 1 kcal/mol/Å2 was applied to the oxygen atoms of the bulk water molecules; 3) in the third ns, a restraint of 5 kcal/mol/Å2 was applied to receptor backbone, ligand and crystallographic water, while a restraint of 2.5 kcal/mol/Å2 was applied to the side chains of the receptor and the palmitoyl group and a restraint of 0.5 kcal/mol/Å2 was applied to the oxygen atoms of the bulk water molecules; 4) in the fourth ns, a restraint of 2.5 kcal/mol/Å2 was applied to receptor backbone, ligand and crystallographic water, while a restraint of 1 kcal/mol/Å2 was applied to the side chains of the receptor and the palmitoyl group and a restraint of 0.1 kcal/mol/Å2 was applied to the oxygen atoms of the bulk water molecules.
For the 50 ns of the production runs, a time step of 2 fs was used with the NPT ensemble using a Berendsen thermostat at 310 K and velocity resampling every 1 ps. In one of the simulations, a harmonic restraint of 500 kcal/mol/Å2 was applied to all the atoms of Phe193EL2.52 to prevent its motion. For statistical purposes, each system was simulated twice, using different random number seeds for the generation of the initial velocities.
Figures
The three-dimensional figures of the receptor and the receptor-ligand complexes were generated with MOE [56].
Supplementary Material
Acknowledgments
This research was supported by the Intramural Research Program of the NIH, NIDDK. We thank Nels Thorsteinson of Chemical Computing Group for providing the SVL script for the clustering of the docking poses.
Footnotes
Note Added after Initial Review of This Paper. While this manuscript was under review, an article was published by Kobilka and coworkers that unveiled the crystal structure of the Beta2-AR in its nanobody stabilized active state, in complex with a full agonist [60]. In striking agreement with our predictions, the authors noted that: “The greatest difference between inactive and active structures in the ligand-binding site is an inward bulge of TM5 centred around Ser 207(5.46), whose Calpha position shifts by 2.1Å”.
Publisher's Disclaimer: This is a PDF file of an unedited manuscript that has been accepted for publication. As a service to our customers we are providing this early version of the manuscript. The manuscript will undergo copyediting, typesetting, and review of the resulting proof before it is published in its final citable form. Please note that during the production process errors may be discovered which could affect the content, and all legal disclaimers that apply to the journal pertain.
References
- 1.Pierce K, Premont R, Lefkowitz R. Seven-transmembrane receptors. Nat Rev Mol Cell Biol. 2002;3:639–650. doi: 10.1038/nrm908. [DOI] [PubMed] [Google Scholar]
- 2.Hanson MA, Stevens RC. Discovery of new GPCR biology: one receptor structure at a time. Structure. 2009;17:8–14. doi: 10.1016/j.str.2008.12.003. [DOI] [PMC free article] [PubMed] [Google Scholar]
- 3.Costanzi S, Siegel J, Tikhonova I, Jacobson K. Rhodopsin and the others: a historical perspective on structural studies of G protein-coupled receptors. Curr Pharm Des. 2009;15:3994–4002. doi: 10.2174/138161209789824795. [DOI] [PMC free article] [PubMed] [Google Scholar]
- 4.Wu B, Chien EY, Mol CD, Fenalti G, Liu W, Katritch V, Abagyan R, Brooun A, Wells P, Bi FC, Hamel DJ, Kuhn P, Handel TM, Cherezov V, Stevens RC. Science. 2010. Structures of the CXCR4 Chemokine GPCR with Small-Molecule and Cyclic Peptide Antagonists. [DOI] [PMC free article] [PubMed] [Google Scholar]
- 5.Chien EY, Liu W, Zhao Q, Katritch V, Han GW, Hanson MA, Shi L, Newman AH, Javitch JA, Cherezov V, Stevens RC. Structure of the human dopamine D3 receptor in complex with a D2/D3 selective antagonist. Science. 2010;330:1091–1095. doi: 10.1126/science.1197410. [DOI] [PMC free article] [PubMed] [Google Scholar]
- 6.de Graaf C, Rognan D. Selective structure-based virtual screening for full and partial agonists of the beta2 adrenergic receptor. J Med Chem. 2008;51:4978–4985. doi: 10.1021/jm800710x. [DOI] [PubMed] [Google Scholar]
- 7.Kolb P, Rosenbaum D, Irwin J, Fung J, Kobilka B, Shoichet B. Structure-based discovery of beta2-adrenergic receptor ligands. Proc Natl Acad Sci U S A. 2009;106:6843–6848. doi: 10.1073/pnas.0812657106. [DOI] [PMC free article] [PubMed] [Google Scholar]
- 8.Katritch V, Jaakola V, Lane J, Lin J, Ijzerman A, Yeager M, Kufareva I, Stevens R, Abagyan R. Structure-based discovery of novel chemotypes for adenosine A(2A) receptor antagonists. J Med Chem. 2010;53:1799–1809. doi: 10.1021/jm901647p. [DOI] [PMC free article] [PubMed] [Google Scholar]
- 9.Carlsson J, Yoo L, Gao Z, Irwin J, Shoichet B, Jacobson K. Structure-based discovery of A2A adenosine receptor ligands. J Med Chem. 2010;53:3748–3755. doi: 10.1021/jm100240h. [DOI] [PMC free article] [PubMed] [Google Scholar]
- 10.Vilar S, Karpiak J, Costanzi S. Ligand and structure-based models for the prediction of ligand-receptor affinities and virtual screenings: Development and application to the beta(2)-adrenergic receptor. J Comput Chem. 2010;31:707–720. doi: 10.1002/jcc.21346. [DOI] [PMC free article] [PubMed] [Google Scholar]
- 11.Reynolds K, Katritch V, Abagyan R. Identifying conformational changes of the beta(2) adrenoceptor that enable accurate prediction of ligand/receptor interactions and screening for GPCR modulators. J Comput Aided Mol Des. 2009;23:273–288. doi: 10.1007/s10822-008-9257-9. [DOI] [PMC free article] [PubMed] [Google Scholar]
- 12.Katritch V, Rueda M, Lam P, Yeager M, Abagyan R. GPCR 3D homology models for ligand screening: lessons learned from blind predictions of adenosine A2a receptor complex. Proteins. 2010;78:197–211. doi: 10.1002/prot.22507. [DOI] [PMC free article] [PubMed] [Google Scholar]
- 13.Vilar S, Ferino G, Phatak SS, Berk B, Cavasotto CN, Costanzi S. Docking-based virtual screening for ligands of G protein-coupled receptors: Not only crystal structures but also in silico models. J Mol Graph Model. 2010 doi: 10.1016/j.jmgm.2010.11.005. [DOI] [PMC free article] [PubMed] [Google Scholar]
- 14.Phatak SS, Gatica EA, Cavasotto CN. Ligand-Steered Modeling and Docking: A Benchmarking Study in Class A G-Protein-Coupled Receptors. J Chem Inf Model. 2010 doi: 10.1021/ci100285f. [DOI] [PubMed] [Google Scholar]
- 15.Costanzi S. On the applicability of GPCR homology models to computer-aided drug discovery: a comparison between in silico and crystal structures of the beta2-adrenergic receptor. J Med Chem. 2008;51:2907–2914. doi: 10.1021/jm800044k. [DOI] [PMC free article] [PubMed] [Google Scholar]
- 16.Michino M, Abola EG, Brooks Cr, Dixon J, Moult J, Stevens R. 2008 Participants, Community-wide assessment of GPCR structure modelling and ligand docking: GPCR Dock 2008. Nat Rev Drug Discov. 2009;8:455–463. doi: 10.1038/nrd2877. [DOI] [PMC free article] [PubMed] [Google Scholar]
- 17.Costanzi S. Modelling G protein-coupled receptors: a concrete possibility. Chim Oggi. 2010;28:26–30. [PMC free article] [PubMed] [Google Scholar]
- 18.Swaminath G, Xiang Y, Lee TW, Steenhuis J, Parnot C, Kobilka BK. Sequential binding of agonists to the beta(2) adrenoceptor - Kinetic evidence for intermediate conformational states. J Biol Chem. 2004;279:686–691. doi: 10.1074/jbc.M310888200. [DOI] [PubMed] [Google Scholar]
- 19.Bockaert J, Fagni L, Dumuis A, Marin P. GPCR interacting proteins (GIP) Pharmacol Ther. 2004;103:203–221. doi: 10.1016/j.pharmthera.2004.06.004. [DOI] [PubMed] [Google Scholar]
- 20.Yao XJ, Parnot C, Deupi X, Ratnala VRP, Swaminath G, Farrens D, Kobilka B. Coupling ligand structure to specific conformational switches in the beta(2)-adrenoceptor. Nat Chem Biol. 2006;2:417–422. doi: 10.1038/nchembio801. [DOI] [PubMed] [Google Scholar]
- 21.Kobilka BK, Deupi X. Conformational complexity of G-protein-coupled receptors. Trends Pharmacol Sci. 2007;28:397–406. doi: 10.1016/j.tips.2007.06.003. [DOI] [PubMed] [Google Scholar]
- 22.Galandrin S, Oligny-Longpre G, Bouvier M. The evasive nature of drug efficacy: implications for drug discovery. Trends Pharmacol Sci. 2007;28:423–430. doi: 10.1016/j.tips.2007.06.005. [DOI] [PubMed] [Google Scholar]
- 23.Rosenbaum DM, Rasmussen SG, Kobilka BK. The structure and function of G-protein-coupled receptors. Nature. 2009;459:356–363. doi: 10.1038/nature08144. [DOI] [PMC free article] [PubMed] [Google Scholar]
- 24.Guo W, Shi L, Filizola M, Weinstein H, Javitch J. Crosstalk in G protein-coupled receptors: changes at the transmembrane homodimer interface determine activation. Proc Natl Acad Sci U S A. 2005;102:17495–17500. doi: 10.1073/pnas.0508950102. [DOI] [PMC free article] [PubMed] [Google Scholar]
- 25.Guo W, Urizar E, Kralikova M, Mobarec J, Shi L, Filizola M, Javitch J. Dopamine D2 receptors form higher order oligomers at physiological expression levels. EMBO J. 2008;27:2293–2304. doi: 10.1038/emboj.2008.153. [DOI] [PMC free article] [PubMed] [Google Scholar]
- 26.Hill T, Lewicki P. A Comprehensive Reference for Science, Industry and Data Mining. StatSoft; Tulsa: 2006. Statistical Methods and Applications. [Google Scholar]
- 27.Sherman W, Day T, Jacobson MP, Friesner RA, Farid R. Novel procedure for modeling ligand/receptor induced fit effects. J Med Chem. 2006;49:534–553. doi: 10.1021/jm050540c. [DOI] [PubMed] [Google Scholar]
- 28.Cherezov V, Rosenbaum D, Hanson M, Rasmussen S, Thian F, Kobilka T, Choi H, Kuhn P, Weis W, Kobilka B, Stevens R. High-resolution crystal structure of an engineered human beta2-adrenergic G protein-coupled receptor. Science. 2007;318:1258–1265. doi: 10.1126/science.1150577. [DOI] [PMC free article] [PubMed] [Google Scholar]
- 29.Rosenbaum D, Cherezov V, Hanson M, Rasmussen S, Thian F, Kobilka T, Choi H, Yao X, Weis W, Stevens R, Kobilka B. GPCR engineering yields high-resolution structural insights into beta2-adrenergic receptor function. Science. 2007;318:1266–1273. doi: 10.1126/science.1150609. [DOI] [PubMed] [Google Scholar]
- 30.Maestro-Desmond Interoperability Tools, version 2.2. Schrodinger; New York, NY: 2009. Desmond Molecular Dynamics System, version 2.2, D. E. Shaw Research, New York, NY, 2009. [Google Scholar]
- 31.Freddolino PL, Kalani MYS, Vaidehi N, Floriano WB, Hall SE, Trabanino RJ, Kam VWT, Goddard WA. Predicted 3D structure for the human beta 2 adrenergic receptor and its binding site for agonists and antagonists. Proc Natl Acad Sci USA. 2004;101:2736–2741. doi: 10.1073/pnas.0308751101. [DOI] [PMC free article] [PubMed] [Google Scholar]
- 32.Bhattacharya S, Hall SE, Li H, Vaidehi N. Ligand-stabilized conformational states of human beta(2) adrenergic receptor: Insight into G-protein-coupled receptor activation. Biophys J. 2008;94:2027–2042. doi: 10.1529/biophysj.107.117648. [DOI] [PMC free article] [PubMed] [Google Scholar]
- 33.Bhattacharya S, Vaidehi N. Computational mapping of the conformational transitions in agonist selective pathways of a G-protein coupled receptor. J Am Chem Soc. 2010;132:5205–5214. doi: 10.1021/ja910700y. [DOI] [PubMed] [Google Scholar]
- 34.Katritch V, Reynolds KA, Cherezov V, Hanson MA, Roth CB, Yeager M, Abagyan R. Analysis of full and partial agonists binding to beta(2)-adrenergic receptor suggests a role of transmembrane helix V in agonist-specific conformational changes. J Mol Recognit. 2009;22:307–318. doi: 10.1002/jmr.949. [DOI] [PMC free article] [PubMed] [Google Scholar]
- 35.Costanzi S, Joshi BV, Maddileti S, Mamedova L, Gonzalez-Moa MJ, Marquez VE, Harden TK, Jacobson KA. Human P2Y(6) receptor: Molecular modeling leads to the rational design of a novel agonist based on a unique conformational preference. J Med Chem. 2005;48:8108–8111. doi: 10.1021/jm050911p. [DOI] [PMC free article] [PubMed] [Google Scholar]
- 36.Kim JH, Jiang QL, Glashofer M, Yehle S, Wess J, Jacobson KA. Glutamate residues in the second extracellular loop of the human A(2a) adenosine receptor are required for ligand recognition. Mol Pharmacol. 1996;49:683–691. [PMC free article] [PubMed] [Google Scholar]
- 37.Tikhonova IG, Sum CS, Neumann S, Thomas CJ, Raaka BM, Costanzi S, Gershengorn MC. Bidirectional, iterative approach to the structural delineation of the functional “Chemoprint” in GPR40 for agonist recognition. J Med Chem. 2007;50:2981–2989. doi: 10.1021/jm0614782. [DOI] [PMC free article] [PubMed] [Google Scholar]
- 38.Kleinau G, Claus M, Jaeschke H, Mueller S, Neumann S, Paschke R, Krause G. Contacts between extracellular loop two and transmembrane helix six determine basal activity of the thyroid-stimulating hormone receptor. J Biol Chem. 2007;282:518–525. doi: 10.1074/jbc.M606176200. [DOI] [PubMed] [Google Scholar]
- 39.Shi L, Javitch JA. The second extracellular loop of the dopamine D-2 receptor lines the binding-site crevice. Proc Natl Acad Sci USA. 2004;101:440–445. doi: 10.1073/pnas.2237265100. [DOI] [PMC free article] [PubMed] [Google Scholar]
- 40.Ahuja S, Hornak V, Yan ECY, Syrett N, Goncalves JA, Hirshfeld A, Ziliox M, Sakmar TP, Sheves M, Reeves PJ, Smith SO, Eilers M. Helix movement is coupled to displacement of the second extracellular loop in rhodopsin activation. Nat Struct Mol Biol. 2009;16:168–175. doi: 10.1038/nsmb.1549. [DOI] [PMC free article] [PubMed] [Google Scholar]
- 41.Olah M, Jacobson K, Stiles G. Role of the second extracellular loop of adenosine receptors in agonist and antagonist binding. Analysis of chimeric A1/A3 adenosine receptors. J Biol Chem. 1994;269:24692–24698. [PMC free article] [PubMed] [Google Scholar]
- 42.Kleinau G, Claus M, Jaeschke H, Mueller S, Neumann S, Paschke R, Krause G. Contacts between extracellular loop two and transmembrane helix six determine basal activity of the thyroid-stimulating hormone receptor. J Biol Chem. 2007;282:518–525. doi: 10.1074/jbc.M606176200. [DOI] [PubMed] [Google Scholar]
- 43.Bokoch MP, Zou YZ, Rasmussen SGF, Liu CW, Nygaard R, Rosenbaum DM, Fung JJ, Choi HJ, Thian FS, Kobilka TS, Puglisi JD, Weis WI, Pardo L, Prosser RS, Mueller L, Kobilka BK. Ligand-specific regulation of the extracellular surface of a G-protein-coupled receptor. Nature. 2010;463:108–U121. doi: 10.1038/nature08650. [DOI] [PMC free article] [PubMed] [Google Scholar]
- 44.Shi L, Liapakis G, Xu R, Guarnieri F, Ballesteros JA, Javitch JA. Beta2 Adrenergic receptor activation. Modulation of the proline kink in transmembrane 6 by a rotamer toggle switch. J Biol Chem. 2002;277:40989–40996. doi: 10.1074/jbc.M206801200. [DOI] [PubMed] [Google Scholar]
- 45.Ballesteros JA, Jensen AD, Liapakis G, Rasmussen SGF, Shi L, Gether U, Javitch JA. Activation of the beta(2)-adrenergic receptor involves disruption of an ionic lock between the cytoplasmic ends of transmembrane segments 3 and 6. J Biol Chem. 2001;276:29171–29177. doi: 10.1074/jbc.M103747200. [DOI] [PubMed] [Google Scholar]
- 46.Wieland K, Zuurmond HM, Krasel C, Ijzerman AP, Lohse MJ. Involvement of Asn-293 in stereospecific agonist recognition and in activation of the beta(2)-adrenergic receptor. Proc Natl Acad Sci USA. 1996;93:9276–9281. doi: 10.1073/pnas.93.17.9276. [DOI] [PMC free article] [PubMed] [Google Scholar]
- 47.Dror RO, Arlow DH, Borhani DW, Jensen MO, Piana S, Shaw DE. Identification of two distinct inactive conformations of the beta(2)-adrenergic receptor reconciles structural and biochemical observations. Proc Natl Acad Sci USA. 2009;106:4689–4694. doi: 10.1073/pnas.0811065106. [DOI] [PMC free article] [PubMed] [Google Scholar]
- 48.Ballesteros JA, Weinstein H, Stuart CS. Integrated methods for the construction of three-dimensional models and computational probing of structure-function relations in G-protein coupled receptors. Methods Neurosci. 1995;25:366–428. [Google Scholar]
- 49.van Rhee AM, Jacobson KA. Molecular architecture of G protein-coupled receptors. Drug Develop Res. 1996;37:1–38. doi: 10.1002/(SICI)1098-2299(199601)37:1<1::AID-DDR1>3.0.CO;2-S. [DOI] [PMC free article] [PubMed] [Google Scholar]
- 50.Mohamadi F, Richards NGJ, Guida WC, Liskamp R, Lipton M, Caufield C, Chang G, Hendrickson T, Still WC. Macromodel - An Integrated Software System for Modeling Organic and Bioorganic Molecules Using Molecular Mechanics. J Comput Chem. 1990;11:440–467. [Google Scholar]
- 51.MacroModel, 9.8. Schrodinger, LLC; New York, NY, USA: www.schrodinger.com. [Google Scholar]
- 52.Maestro, 9.1. Schrodinger; LLC, New York, NY, USA: www.schrodinger.com. [Google Scholar]
- 53.Costanzi S. On the applicability of GPCR homology models to computer-aided drug discovery: A comparison between in silico and crystal structures of the beta(2)-adrenergic receptor. J Med Chem. 2008;51:2907–2914. doi: 10.1021/jm800044k. [DOI] [PMC free article] [PubMed] [Google Scholar]
- 54.Glide, 5.0. Schrodinger, LLC; New York, NY, USA: www.schrodinger.com. [Google Scholar]
- 55.Prime, 2.0. Schrodinger, LLC; New York, NY, USA: www.schrodinger.com. [Google Scholar]
- 56.The molecular operating environment (MOE) Chemical Computing Group, Inc; Montreal, Canada: 2009. p. 10. www.chemcomp.com. [Google Scholar]
- 57.Humphrey W, Dalke A, Schulten K. VMD: Visual molecular dynamics. J Mol Graphics. 1996;14:33–38. doi: 10.1016/0263-7855(96)00018-5. [DOI] [PubMed] [Google Scholar]
- 58.Mezei M, Filizola M. TRAJELIX: A computational tool for the geometric characterization of protein helices during molecular dynamics simulations. J Comput Aided Mol Des. 2006;20:97–107. doi: 10.1007/s10822-006-9039-1. [DOI] [PubMed] [Google Scholar]
- 59.Statistica, 8.0. StatSoft, Inc; Tulsa, OK, USA: www.statsoft.com. [Google Scholar]
- 60.Rasmussen SG, Choi HJ, Fung JJ, Pardon E, Casarosa P, Chae PS, Devree BT, Rosenbaum DM, Thian FS, Kobilka TS, Schnapp A, Konetzki I, Sunahara RK, Gellman SH, Pautsch A, Steyaert J, Weis WI, Kobilka BK. Structure of a nanobody-stabilized active state of the beta(2) adrenoceptor. Nature. 2011;469:175–180. doi: 10.1038/nature09648. [DOI] [PMC free article] [PubMed] [Google Scholar]
Associated Data
This section collects any data citations, data availability statements, or supplementary materials included in this article.