Abstract
Objectives
This study aimed to demonstrate three-dimensional (3D) visualization of early/inflammatory arterial atheroma using intravascular ultrasound (IVUS) and targeted echogenic immunoliposomes (ELIP). IVUS can be used as a molecular imaging modality with the use of targeted contrast agents for atheroma detection. Three-dimensional reconstruction of 2-dimensional IVUS images may provide improved atheroma visualization.
Materials and Methods
Atheroma were induced in arteries of Yucatan miniswine (n = 5) by endothelial cell denudation followed by a 4-week high cholesterol diet. The contralateral arteries were left intact and served as controls. Anti-intercellular adhesion molecule-1 (ICAM-1) and generic gammaglobulin (IgG) conjugated ELIP were prepared. Arteries were imaged using IVUS before and after ELIP injection. Images were digitized, manually traced, segmented, and placed in tomographic sequence for 3D visualization. Atheroma brightness enhancement was compared and reported as mean gray scale values. Plaque volume was quantified both from IVUS and histologic images.
Results
Anti-ICAM-1 ELIP highlighting of the atheroma in all arterial segments was different compared with baseline (P < 0.05). There was no difference in the mean gray scale values with IgG-ELIP. Arterial 3D IVUS images allowed visualization of the entire plaque distribution. The highlighted plaque/atheroma volume with anti-ICAM-1 ELIP was greater than baseline (P < 0.01).
Conclusion
This study demonstrates specific highlighting of early/inflammatory atheroma in vivo using anti-ICAM-1 ELIP. Three-dimensional IVUS reconstruction provides good visualization of plaque distribution in the arterial wall. This novel methodology may help to detect and diagnose pathophysiologic development of all stages of atheroma formation in vivo and quantitate plaque volume for serial and long-term atherosclerotic treatment studies.
Keywords: atherosclerosis, intravascular ultrasound, liposomes, targeted, 3D reconstruction
Atherosclerosis is a diffuse and highly variable disease disseminated throughout the arterial bed.1 It is an active process with continuous alterations in the biological and mechanical properties of formed atheroma.2,3 Atherosclerosis is clearly an inflammatory disease, which does not simply result from lipid accumulation, but is also induced by a complex sequence of specific inflammatory responses at both the molecular and cellular levels.4,5 It has been shown that inflammatory markers such as vascular cell adhesion molecule-1 and intercellular adhesion molecule-1 (ICAM-1) observed not only at the endothelial surface of the artery but also in the adventitial layers during all and especially the early stages of atheroma formation.6,7
Intravascular ultrasound (IVUS) allows highly precise anatomic identification of arterial structures8,9 compared with other imaging modalities. Moreover, IVUS can be used as a molecular imaging modality with the use of targeted contrast agents. Progression of atherosclerosis can also be assessed by quantifying both morphologic alteration and pathologic tissue composition using functional IVUS imaging. We have developed targeted echogenic immunoliposomes (ELIP) for site-specific ultrasound enhancement of thrombus in the left ventricular cavity and atheroma components in the arterial wall.10–13 The mean diameter of these ELIP is less than 1 μm. Thus, they can easily pass through pulmonary capillaries when injected intravenously.12 When conjugated to specific antibodies, ELIP can be used to target certain tissue and endothelial components. Unconjugated and antibody-conjugated ELIP are stable under various physiological conditions.14,15 ELIP can be also used as a targeted therapeutic delivery agent as they can be loaded with drugs or genes.16–19
Although two-dimensional (2D) IVUS images can provide useful information such as intima-media thickness and area, overall arterial morphology and atheroma distribution along the arterial direction cannot be obtained by 2D IVUS. Three-dimensional (3D) IVUS can provide better visualization of the arterial anatomy and improve understanding of the detailed plaque information. In addition, contrast agents can help IVUS to demonstrate the adventitial layers, which cannot be clearly delineated with IVUS alone.20
The present study describes an improved 3D volumetric IVUS visualization method to better demonstrate the extent and distribution of atherosclerotic components in the arterial structure in vivo using targeted ELIP. The ability of targeted ELIP to enhance the reflectivity of atheroma-associated endothelium and to quantify total plaque/atheroma volume was also investigated. To focus on improved targeted atheroma visualization with these 3D techniques, we used an identical targeting strategy and IVUS imaging methodology that has been previously presented and shown to provide targeted molecular enhancement in vivo.13
MATERIALS AND METHODS
Liposomal Preparation
Liposomes were prepared from a 69:8:8:15 molar mixture of L-α-phosphatidylcholine, 1,2-dipalmitoyl-sn-glycero-3-phosphoeth-anolamine-N-[4-(p-maleimidophenyl)butyrate], 1,2 dipalmitoyl-sn-glycero-3-phosphoglycerol, and cholesterol. ELIP were conjugated to mouse generic gammaglobulin (IgG) (2 mg) or to a monoclonal antihuman ICAM-1 preparation (NeoMarkers, Fremont, CA; 0.4 mg + 1.6 mg mouse IgG), utilizing 3-(2-pyridyldithio)propionic acid-N-hydroxysuccinimide ester (succinimidopyridyldithiopropionate [SPDP])-mediated thiolation, as previously described for rabbit IgG,21 except that ELIP-conjugated antibody (Ab) was separated from unconjugated Ab by chromatography on a 20-mL Sepharose CL-4B column by the method of Lasch et al.22 Conjugation efficiency (CE) of Ab-ELIP was determined by a quantitative immunoblot assay for liposomal IgG21 and was 17 to 20 μg Ab/mg lipid. Liposome enumeration and size distribution analysis with a Beckman Coulter Multisizer 3 instrument enabled us to determine the CE in terms of Ab molecules per liposome and per unit surface area. Those values were 1700 to 2200 and 7 to 9 × 10¹⁴/m2, respectively. The monoclonal anti-ICAM-1 antibody (MAb) conjugated to ELIP (clone 15.2) is cross-reactive with porcine endothelium (AbD Serotec, MorphoSys US, Raleigh, NC).
Enzyme-Linked Immunosorbent Assay Determination of Ab-ELIP Targeting Efficiency
Nunc MaxiSorp microtiter plates were coated with 5 μg/mL of a polyclonal antihuman ICAM-1 capture Ab (R&D Systems, Minneapolis, MN) in 0.05 M sodium bicarbonate, pH 9.6, overnight at 4°C. All incubation volumes were 50 μL/well. One-third of wells were left uncoated for determination of nonspecific binding. After aspirating well contents, all wells were blocked with conjugate buffer (1% bovine serum albumin in 0.05 M Tris buffer, pH 8.0, with 0.02% sodium azide) for 1 hour. From this point, all incubations were at 37°C. Each incubation was followed by aspiration of well contents and washes (3×) with PBS-T (0.02 M phosphate-buffered saline, pH 7.4, with 0.05% Tween 20).
All wells were incubated with 200 ng/mL of rshICAM-1 in 0.1% BSA/PBS-T diluent for 2 hours. For assay of intact MAb-ELIP, wells were washed with PBS after this incubation and the first wash after the Ab-EGIL incubation was also with PBS. Various dilutions of MAb (in PBS-T) or MAb-ELIP (in PBS) were incubated for 1 hour, followed by a 1-hour incubation with 1:1000 goat antimouse IgG-alkaline phosphatase (Bio-Rad Laboratories, Hercules, CA) in conjugate buffer. The substrate incubation consisted of 50 μL of substrate buffer (0.05 M glycine buffer, pH 10.5, with 1.5 mM magnesium chloride) + 50 μL p-nitrophenyl phosphate (Sigma Chem Co.; 4 mg/mL) in substrate buffer per well for 15 minutes. The reaction was stopped with 50 μL 1M sodium hydroxide per well.
The optical absorbance of each well at 405 nm (A405) was measured with a Tecan Saphir2 microplate reader. Net A405 was determined by subtracting the absorbance of background wells from that of capture Ab-coated wells. The dissociation constant (KD) of MAb or MAb-ELIP binding to rshICAM-1 was calculated according to the equation, A = Amax ([L]/(KD + [L])), where A = Net A405 and L = Ab.23 [Ab] for Ab-ELIP was calculated from the CE. KD was determined as the slope of a plot of Amax/A versus 1/[L]. Affinities determined by this method were averaged with KD values derived from b of the equation y = ax/(b + x), defining a hyperbolic fit of the enzyme-linked immunosorbent assay (ELISA) data.
Animal Preparation
An atherosclerotic Yucatan miniswine atheroma model was used (n = 5; 20–25 kg, Sinclair Research Center Inc., Columbia, MO). The animal protocol was approved by the Institutional Animal Care and Use Committee of the University of Texas Health Science Center at Houston. Following full anesthesia, the right common carotid and right femoral arteries (total of 10 arteries) were exposed with neck and groin incisions, and an arteriotomy was performed. A 4F Forgarty embolectomy balloon catheter was inserted, inflated until gentle resistance was felt, and moved back and forth over a 5-cm segment to partially denude the endothelium. This creates an early/inflammatory atheroma model while minimizing fibrosis of the segment. Contralateral arteries served as controls. The miniswine were fed a high-cholesterol diet containing 2% cholesterol and 15% lard (Diet ID93296, Harlan Teklad, Madison, WI) for 4 weeks prior to denudation and for additional 4 to 6 weeks postdenudation to induce atheroma formation. Two weeks prior to the second surgery for IVUS imaging, cholesterol levels ranged between 400 and 500 mg/dL (mean 453). At the time of the second surgery, miniswine were anesthetized and 6F or 5F sheaths were inserted in the carotid and femoral arteries, respectively, at least 5 cm distal to the injured segment.
Liposome Injections and IVUS Imaging
A 3.2F Sonicath Ultra 6 IVUS imaging catheter (20 MHz, Boston Scientific Inc, Sunnyvale, CA) was used with a CVIS IVUS imaging system (Boston Scientific Inc., Sunnyvale, CA). The IVUS catheter was inserted through the arterial sheath past the region of injury to image the arterial segments. After washout using saline, baseline IVUS images (a general cross-sectional B-Mode of operation, dynamic range of 60 dB) of the arterial segment of interest were obtained using an automatic pullback device at a constant speed of 0.5 mm/s and continuously recorded on ½ inch S-VHS videotape. Unconjugated ELIP (5 mg lipid/mL) or mouse-IgG conjugated ELIP (5 mg lipid/mL) were injected intra-arterially into the right-sided carotid and femoral arteries to assess nontargeted and nonspecific-targeted highlighting. Five minutes after each ELIP injection, 3 mL of saline was injected for washout, and IVUS imaging performed. Anti-ICAM-1 conjugated ELIP (5 mg lipid/mL) were then injected and IVUS images of the same arterial segments were recorded.
Electrocardiogram data were imported to the IVUS system in real time and recorded along with the IVUS images serving as a time reference. Instrument settings for gain (G19), zoom (Z45), compression (c1), and rejection (r0) levels were set such that the luminal border was visibly detectable at baseline for each artery. These settings remained constant throughout imaging. For the carotid arteries, the arterial segment from the aortocarotid junction to the arterial sheath (proximal to distal) was imaged. Similarly, for the femoral arteries, the segment from the ilio-femoral junction to the arterial sheath was imaged.
3D IVUS Reconstruction and Image Analysis
IVUS images were digitized to 640 × 480 pixel spatial resolution (0.038 – 0.076 mm/pixel) and 8-bit gray scale (256 levels) at 1 mm intervals with a frame rate of 30 f/s in consideration of the animal’s heart rate (average of 70 bpm). The arterial segments evaluated were relatively straight, with no curvature; thus, it was assumed that the catheter pullback was performed parallel to the axial direction of the artery. The endothelium/atheroma border and the outer edge of the dense adventitia in each image were manually segmented and a series of segmented images were placed in tomographic sequence for a volumetric 3D reconstruction. A graphical user interface-based interactive tracing and segmenting program was developed using MATLAB (Mathworks Inc., Natick, MA). To better demonstrate the extent and distribution of plaques, the slicing option (along the longitudinal direction) at an arbitrary angle was added to the user-developed program. ImageJ, a Java-based image-processing package developed and distributed by the National Institutes of Health (available at: http://rsb.info.nih.gov/ij/), was used to demonstrate the in vivo 3D volumetric arterial structures.
To quantitate the acoustic enhancement of plaque and atheroma by targeted ELIP, the mean gray scale value (MGSV) was calculated using Image-Pro Plus software (Media Cybernetics, Silver Spring, MD). For a pixel in an 8-bit bitmap image, an intensity value of 0 corresponds to no ultrasound reflectivity (black) whereas a value of 255 signifies maximal reflectivity (white). The MGSV refers to the average intensity value ranging between 0 and 255 over a certain region of interest. The MGSVs were calculated on the same arterial segment of interest before and after ELIP injection. Plaque/atheroma volume was calculated by measuring the evenly-spaced (1 mm) 2D plaque areas and adding them together (Simpson rule).8 Intraobserver variability and interobserver variability of plaque volume measurements were also determined (n = 10 each).
Histology
Following the experimental data acquisition, the animals were euthanized with saturated KCl. The arteries were injected with a barium mixture (0.24% ea 2-octanol + phenol, 0.05 M NaH2PO4, 0.025 M Na2HPO4, 1.7 M KI, 21% Gelatin, 4.8 M BaSO4), ligated at either end to preserve the shape and length, and put in 10% neutral buffered formalin for 12 to 24 hours. Arteries were cross-sectioned at 3 mm intervals and embedded in paraffin. Adjacent 4-μm sections were stained with hematoxylin and eosin (H and E) and a modified Movat’s pentachrome for evaluation of elastic tissue and collagen at every 100 μm. All the slides were imaged at 4× magnification. Plaque volumes were measured and compared with those obtained from IVUS images. Three-dimensional histologic reconstruction was also performed by a similar procedure as the 3D IVUS reconstruction described earlier in the text. Matching arterial segments from histology to the corresponding IVUS data was performed by taking into consideration the distances of landmarks such as aorta-carotid arterial bifurcation and qualitatively confirmed by plaque location and narrowing of the lumen in the 3D images.
Statistical Analysis
SigmaStat (Version 3.5, Systat Software Inc., Point Richmond, CA) was used for data analysis. The Mann-Whitney rank sum test with a 2-tailed P value was used to assess differences in plaque volume between the saline and anti-ICAM-1 ELIP groups. Analysis of variance was performed for multiple group comparison in MGSV between the saline, unconjugated ELIP and anti-ICAM-1 ELIP groups. A P value of 0.05 was considered as statistically significant. Data are reported as mean ± SD.
RESULTS
Verification of Specific ICAM-1 Binding
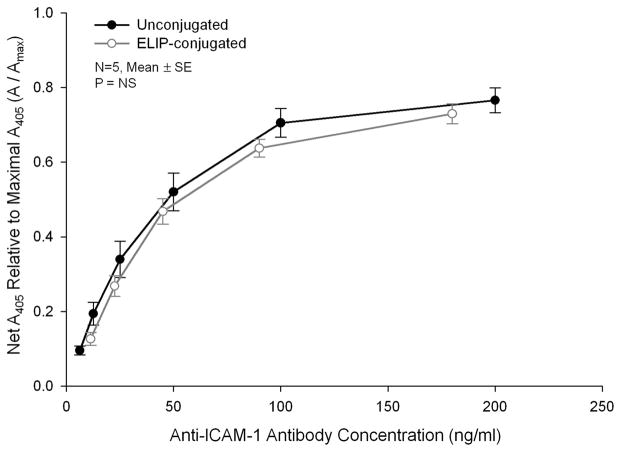
High-affinity binding to human ICAM-1 by both unconjugated and ELIP-conjugated preparations of an antibody known to cross-react with porcine ICAM-1 was confirmed with a sandwich ELISA procedure (Fig. 1). Affinities of the 2 preparations were 0.27 ± 0.04 nM (n = 5) and 0.94 ± 0.34 nM (n = 6, P < 0.01), respectively.
FIGURE 1.
Sandwich intercellular adhesion molecule (ICAM)-1 ELISA composite dose-response curves of an un-conjugated and echogenic immunoliposomes (ELIP)-conjugated monoclonal antibody specific for human ICAM-1 that also reacts with the porcine antigen. Net absorbances at 405 nm (A405) of data from individual assays were normalized relative to maximal absorbances determined from hyperbolic regression analyses.
Volumetric IVUS Visualization of Atheroma
Acoustic enhancement of endothelium and atherosclerotic plaques was visibly observed in both 2D and 3D IVUS images. Figure 2A represents a 3D-volumetric IVUS image after saline injection (baseline) and Figure 2B 5 minutes after anti-ICAM-1 ELIP injection. A longitudinal section of the artery is displayed to better demonstrate the extent and distribution of plaque on the endothelial surface and across the arterial wall. The dark luminal region indicates the bifurcation of the common carotid artery and is used as a landmark ensuring that the same arterial segment has been selected in both baseline and ELIP treatment images. Acoustic enhancement by anti-ICAM-1 ELIP was clearly observed across the arterial wall as well as over the endothelial surface, especially beyond the bifurcation point. A 2D IVUS image is displayed on the right showing detailed enhancement of endothelium and plaque by anti-ICAM-1 ELIP on the cross-sectional view along the yellow line in the 3D image on the left.
FIGURE 2.
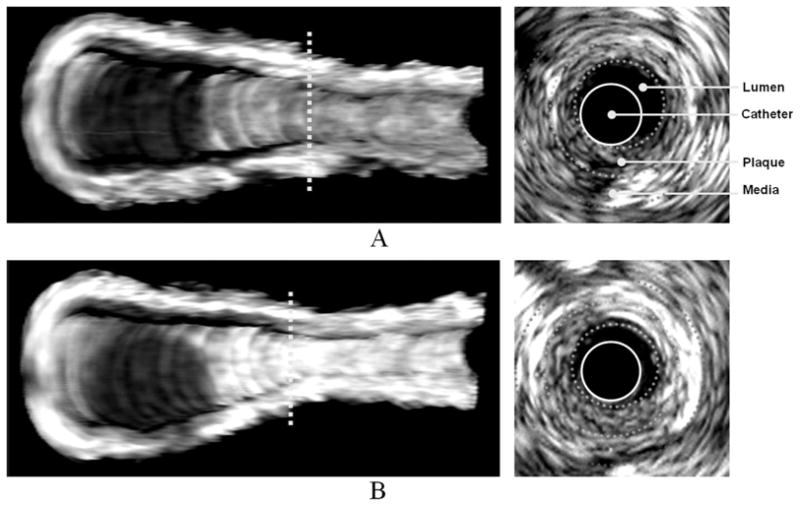
Three-dimensional volumetric IVUS images of a half-cut atheroma-induced carotid artery; A, Before anti-ICAM-1 ELIP injection; B, Five minutes after anti-ICAM-1 ELIP injection. Two-dimensional IVUS images on the right correspond to the cross-sectional views on the dotted lines in the 3D IVUS images.
Volumetric IVUS images of a balloon-injured femoral artery are shown in Figure 3. Similar to the carotid artery, acoustic enhancement by anti-ICAM-1 ELIP was observed over the entire arterial segment. Additionally, it was observed that acoustic enhancement of adventitia, comparable to that of the endothelial surface, resulted from injection of anti-ICAM-1 ELIP into the arterial lumen.
FIGURE 3.
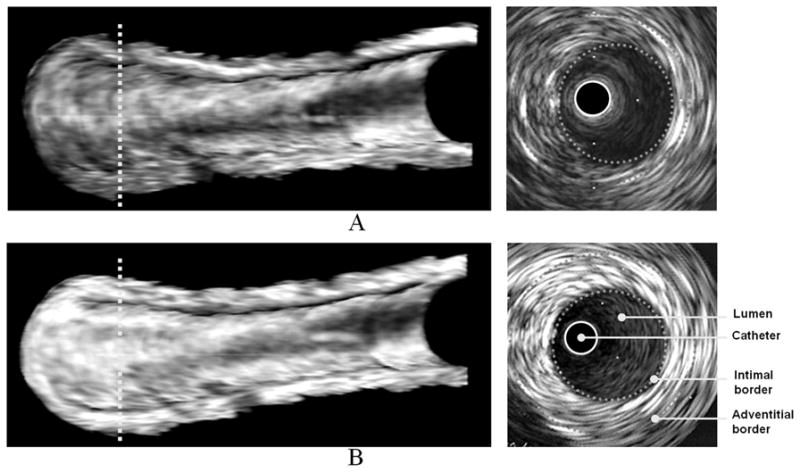
Three-dimensional volumetric IVUS images of a half-cut atheroma-induced femoral artery; A, Baseline; B, Five minutes after anti-ICAM-1 ELIP injection. Two-dimensional IVUS images on the right correspond to the cross-sectional views on the dotted lines in the 3D IVUS images.
Acoustic Enhancement by ELIP
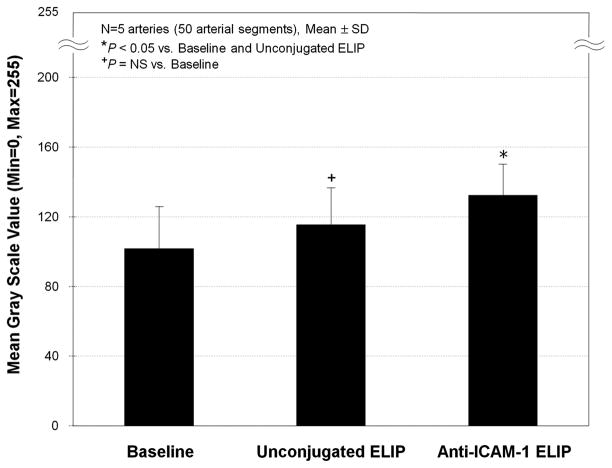
The MGSV changes at baseline and after ELIP injection are shown in Table 1. Anti-ICAM-1 ELIP highlighting of the atheroma in all arterial segments was different compared with baseline (P < 0.05). There was no difference in the MGSV examined following injection of unconjugated ELIP compared with baseline (P = NS). Figure 4 demonstrates the MGSVs obtained from all the arterial segments at baseline, and after unconjugated or anti-ICAM-1 ELIP injection. The average MGSV increase following anti-ICAM-1 ELIP injection was 44% (P < 0.05) compared with baseline, and this enhancement, especially along the longitudinal direction, can be clearly observed with the 3D visualization technique developed in this study.
TABLE 1.
MGSVs of Balloon-Injured (Atheroma-Induced) Endothelial Segments With Saline, Unconjugated ELIP and Anti-ICAM-1 ELIP Injection
| Atheroma-Induced Artery | Mean Gray Scale Value
|
||
|---|---|---|---|
| Saline (Baseline) | Unconjugated ELIP | Anti-ICAM-1 ELIP | |
| 1 | 114 ± 7.6 | 122 ± 12.1* | 142 ± 5.1† |
| 2 | 64 ± 8.5 | — | 128 ± 9.9† |
| 3 | 126 ± 14.8 | 138 ± 5.2 | 145 ± 6.9† |
| 4 | 114 ± 9.5 | 116 ± 11.5* | 143 ± 10.6† |
| 5 | 92 ± 3.8 | 86 ± 10.1* | 103 ± 6.6† |
Data are presented as mean ± SD (n = 10 arterial segments/artery).
P = NS vs. baseline, ANOVA analysis.
P < 0.05 vs. baseline.
Anti-ICAM-1 indicates anti-intercellular adhesion molecule-1; ELIP, echogenic immunoliposomes; MGSV, mean gray scale value.
FIGURE 4.
MGSVs of the atheroma-induced arterial wall segments with saline, unconjugated ELIP, and anti-ICAM-1 ELIP injection.
Plaque Volume Measurements
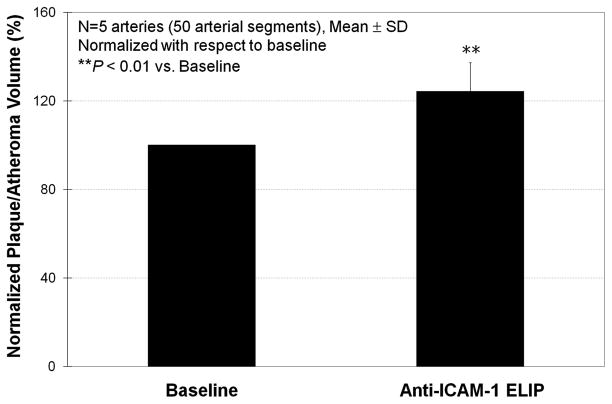
Plaque/atheroma volumes measured from IVUS images at baseline and after anti-ICAM-1 ELIP injection are shown in Table 2. Anti-ICAM-1 ELIP application better demonstrated the early-stage plaque volume. The average percent increase of the measured plaque/atheroma volume by anti-ICAM-1 ELIP application versus baseline was 24.3% (P < 0.01; Fig. 5). Plaque volumes measured after mouse-IgG ELIP injections and those after unconjugated ELIP injections were not different. Intra- and interobserver variability of the plaque volumes from the repeated IVUS image analyses were 2% ± 1.0% and 4% ± 3.4%, respectively.
TABLE 2.
Plaque/Atheroma Volumes of 1 cm Balloon-Injured Carotid Arteries Measured From IVUS With Saline and Anti-ICAM-1 ELIP Injection
| Atheroma-Induced Artery | Plaque Volume (mm3)
|
||
|---|---|---|---|
| Saline | Anti-ICAM-1 ELIP | Percent Increase (%) | |
| 1 | 37.3 | 51.5 | 38.1 |
| 2 | 73.1 | 99.1 | 35.6 |
| 3 | 91.5 | 115.1 | 25.8 |
| 4 | 110.2 | 125.2 | 13.6 |
| 5 | 93.8 | 101.8 | 8.5 |
Anti-ICAM-1 indicates anti-intercellular adhesion molecule-1; ELIP, echogenic immunoliposomesl; IVUS, intravascular ultrasound.
FIGURE 5.
Normalized plaque/atheroma volume increase measured from IVUS images 5 minutes after anti-ICAM-1 ELIP injection.
The average plaque volumes measured from IVUS images with and without anti-ICAM-1 ELIP application were 17% larger and 55% smaller than that measured from histology, respectively.
3D Histologic Reconstruction
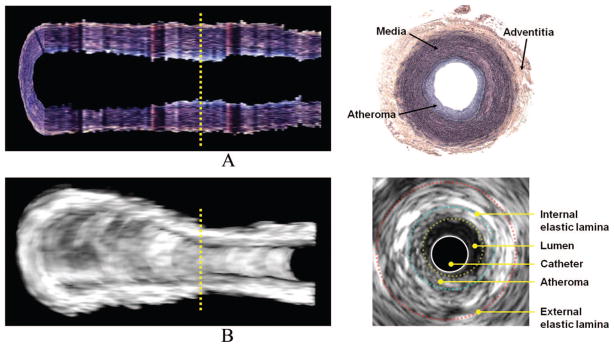
Figure 6 shows a 3D histologic reconstruction image of an atheroma-induced arterial segment with the corresponding 3D IVUS image. Atheroma distribution on the intimal surface is visible from the 3D histologic image. Enhanced atherosclerotic plaques in the 3D IVUS image showed good qualitative agreement with the 3D histologic image. Immunohistochemistry-stained slides of an atheroma-induced carotid artery are illustrated in Figure 7. ICAM-1 expression stains brown and is observed both in the intima/endothelium and adventitial/vasa vasorum.
FIGURE 6.
Three-dimensional histologic reconstruction versus 3D IVUS image of an atheroma-induced carotid artery; A, Histology; B, IVUS.
FIGURE 7.
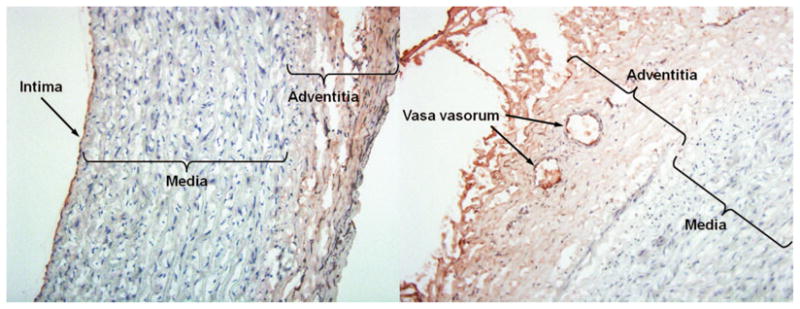
Immunohistochemistry-stained slides of an early/midstage atheroma induced in a porcine carotid artery. ICAM-1 expression is displayed in brown and observed both in the intima/endothelium and adventitia/vasa vasorum.
DISCUSSION
We have previously demonstrated that molecular components of atherosclerotic lesions can be acoustically highlighted in vivo using various antibody-conjugated ELIP,13 and ELIP can be delivered intravenously as a single-step process.12 A quantitative study on the stability and acoustic destruction threshold of ELIP has shown their potential for clinical diagnostic imaging and targeted therapeutic delivery.24 Ultrasound reflectivity (echogenicity) and targeting affinity of our ELIP have been well demonstrated both in vitro and in vivo with various high frequencies such as 15, 20, 30 MHz.11,13–15,25 These studies provided evidence for the capability of ELIP to enhance inflammatory marker expression under physiological conditions. The average MGSV enhancement by anti-ICAM-1 ELIP in this study was about 44% compared with the saline control, and ELISA data and immunohistochemistry confirmed a high affinity binding to ICAM-1 expression by anti-ICAM-1 ELIP. The present study is focused primarily on developing an improved visualization technique to better demonstrate 3D volumetric arterial structure (both IVUS and histologic image data) with enhancement of atheroma using our ELIP. Although the number of animals in the present study is relatively small, the number of arterial segments evaluated is large, and we observed a distinguishable difference in IVUS data between control and treatment groups. These data also substantiate our targeted imaging methodology to better highlight specific atheroma components.
Current 3D IVUS imaging is primarily performed using 2 techniques. The most popular technique is to display a simple longitudinal cut-view of the artery (ie, another 2-D image). This method can demonstrate detailed acoustic intensity information along the cut-view.26 This technique, however, can hardly provide comprehensive information about the spatial distribution of atherosclerosis on different cut-angles and/or the entire arterial structure. The second technique is to focus simply on creating better lumen and media-adventitia contour borders for smoother 3D surface reconstruction of the artery.27 This technique is preferred particularly for computational modeling as it provides a more realistic tomographic geometry of the arterial lumen. However, detailed acoustic intensity information on/through the arterial wall structure is ignored after postprocessing in this technique. In the present study, we have demonstrated that combining these 2 methods can more efficiently provide both realistic visualization of the 3D arterial structure and acoustic intensity information for plaque/atheroma detection.
High frequency IVUS has poor far-field resolution resulting in attenuated signal intensity in the adventitial layer. Targeted contrast agents may overcome this problem as echogenicity can increase image enhancement beyond the media. In this study, we observed that not only was intimal atheroma highlighted by the targeted ELIP, but the adventitial layer was also enhanced, both being confirmed with immunohistochemical data (Fig. 7). We did not observe attenuation of the IVUS signal in the adventitial layer due to luminal endothelial enhancement. On the contrary, in most animals, we observed an enhanced adventitial layer after anti-ICAM-1 ELIP administration. Our smaller ELIP seem to have better contrast enhancement with these high frequency IVUS catheters with less attenuation from near field structures.
IVUS imaging was performed in a sequence of baseline, control (unconjugated ELIP or mouse-IgG ELIP treatment), and anti-ICAM-1 ELIP treatment. Acoustic enhancement by unconjugated ELIP or mouse-IgG ELIP was not different compared with baseline (Fig. 4). The small increase in MGSVs with mouse-IgG ELIP may have been caused by a small degree of nonspecific binding. Enhancement of plaque by the anti-ICAM-1 ELIP resulted in a large increase in the measured plaque/atheroma volume (Table 2).
Plaque volume here includes adventitial inflammatory components. These components are often missed by nontargeted imaging especially with standard IVUS technology and may be important in developing atherosclerosis.28,29 We have previously demonstrated in vivo highlighting of adventitial neovascularization in developing atheroma using the same anti-ICAM-1 ELIP.20 Although IVUS has relatively poor intrinsic far-field resolution for adventitial imaging, echogenicity beyond the media can be increased with targeted contrast agents and used for molecular imaging of adventitial neovascularization.
The average plaque volume measured by IVUS with anti-ICAM-1 ELIP treatment was 17% larger than that from histologic data. However, the average plaque volume measured from IVUS without these ELIP was much smaller (55%) than that from histologic data. The plaque volume data obtained in this study showed a consistent size pattern between the 3 groups; IVUS without anti-ICAM-1 ELIP < Histology < IVUS with anti-ICAM-1 ELIP. This observation may be explained by at least 3 different effects. The blooming effect of the targeted ELIP in the IVUS data may contribute to over-estimation of plaque volumes. On the other hand, it is well-known that arterial tissues have 15% to 35% shrinkage after harvesting, fixation, embedding, and sectioning.30–33 The noncontrast IVUS image data may not have enough resolution to consistently measure the true plaque volume. Additionally, our smaller specular reflectors may have less blooming artifact compared with larger contrast agents. The relative contribution of each effect to our data remains to be determined.
As point-by-point matching of cross-sectional histologic images with the exact corresponding 2D IVUS images is nearly impossible, we did not perform a direct quantitative correlation between individual datasets from histology and IVUS images in the present study. Instead, we visualized the entire 3D arterial structure cut along the longitudinal direction both with histology and IVUS data and compared these data throughout the arterial segment (Fig. 6). This helps minimize difficulties in point-by-point matching.
There are some limitations in the present study. Atheroma was not always clearly delineated, particularly near the distal end of the artery, generally because of florid occlusive atheroma formation leading to encroachment of arterial wall against the IVUS catheter and obliteration of the arterial lumen. The miniswine were fed a high-cholesterol diet for 4 to 6 weeks for atheroma formation, allowing evaluation of early/inflammatory or early-mid stages of induced atheroma. Late atheroma was not evaluated in this study but could similarly be done. The exact coregistration of the arterial segment between IVUS and histology was prone to potential error due to histologic processing shrinkage and artifacts. To minimize this coregistration error, we injected the barium-formalin mixture into the lumen of the arteries in vivo before harvesting the arteries. Despite this concern, good correspondence was found between the 3D IVUS data and the 3D histologic data on the atherosclerotic arterial segments. The targeting affinity of the anti-ICAM-1 ELIP to endothelial cells expressing ICAM-1 may be different to that in the adventitial layer or vasa vasorum as all are exposed to different shear stress conditions. We have demonstrated, however, our ELIP can retain acoustic reflectivity under various physiological shear stress in vitro conditions over 2 hours.34 In this study, we performed our image analysis using ultrasound image data obtained with a commercial 20-MHz IVUS catheter via a general B-mode acquisition mode. This demonstrates the utility of our methodology using standard imaging systems. IVUS catheters at 20 MHz are still commonly used in cardiac catheterization laboratories, using the virtual histology option. We have recently purchased a new state-of-art s5i IVUS imaging system from Volcano Corp (Rancho Cordova, CA), which can be incorporated with phased-array IVUS catheters providing clearer and more stable cross-sectional B-Mode images and also providing raw radio frequency data. This system will allow us to obtain less lossy image data. However, our data show enhanced targeted molecular imaging with this system as well. Moreover, a bubble-specific imaging mode may improve advanced molecular imaging with our targeted ELIP. This is a goal of future work in our laboratory.
SUMMARY
We have successfully demonstrated a novel volumetric IVUS visualization technique for enhanced detection of early/inflammatory arterial atheroma with the use of antibody-conjugated ELIP. This 3D methodology provides good visualization of plaque distribution in the arterial wall. In vivo acoustic enhancement of molecular atheroma components by the targeted ELIP was confirmed both qualitatively and quantitatively. These techniques may help to detect and diagnose pathophysiologic development of all stages of atheroma formation in vivo and quantitate plaque/atheroma volume for serial and long-term atherosclerotic treatment studies.
Acknowledgments
Supported in part by the National Institute of Health; R01 HL-059586, HL-074002, and NS-047603.
References
- 1.McPherson DD, Sirna SJ, Hiratzka LF, et al. Coronary arterial remodeling studied by high-frequency epicardial echocardiography: an early compensatory mechanism in patients with obstructive coronary atherosclerosis. J Am Coll Cardiol. 1991;17:79–86. doi: 10.1016/0735-1097(91)90707-g. [DOI] [PubMed] [Google Scholar]
- 2.Kitney RI, Moura L, Straughan K. 3-D visualization of arterial structures using ultrasound and Voxel modelling. Int J Card Imaging. 1989;4:135–143. doi: 10.1007/BF01745143. [DOI] [PubMed] [Google Scholar]
- 3.Lee RT, Richardson SG, Loree HM, et al. Prediction of mechanical properties of human atherosclerotic tissue by high-frequency intravascular ultrasound imaging: an in vitro study. Arterioscler Thromb. 1992;12:1–5. doi: 10.1161/01.atv.12.1.1. [DOI] [PubMed] [Google Scholar]
- 4.Ross R. The pathogenesis of atherosclerosis: a perspective for the 1990s. Nature. 1993;362:801–809. doi: 10.1038/362801a0. [DOI] [PubMed] [Google Scholar]
- 5.Ross R. Atherosclerosis—an inflammatory disease. N Engl J Med. 1999;340:115–126. doi: 10.1056/NEJM199901143400207. [DOI] [PubMed] [Google Scholar]
- 6.Huo Y, Ley K. Adhesion molecules and atherogenesis. Acta Physiol Scand. 2001;173:35–43. doi: 10.1046/j.1365-201X.2001.00882.x. [DOI] [PubMed] [Google Scholar]
- 7.Kasper HU, Schmidt A, Roessner A. Expression of the adhesion molecules ICAM, VCAM, and ELAM in the arteriosclerotic plaque. Gen Diagn Pathol. 1996;141:289–294. [PubMed] [Google Scholar]
- 8.Mintz GS, Nissen SE, Anderson WD, et al. American College of Cardiology Clinical Expert Consensus Document on Standards for acquisition, measurement and reporting of intravascular ultrasound studies (IVUS). A report of the American College of Cardiology Task Force on Clinical Expert Consensus Documents. J Am Coll Cardiol. 2001;37:1478–1492. doi: 10.1016/s0735-1097(01)01175-5. [DOI] [PubMed] [Google Scholar]
- 9.Nissen SE, Yock P. Intravascular ultrasound: novel pathophysiological insights and current clinical applications. Circulation. 2001;103:604–616. doi: 10.1161/01.cir.103.4.604. [DOI] [PubMed] [Google Scholar]
- 10.Alkan-Onyuksel H, Demos SM, Lanza GM, et al. Development of inherently echogenic liposomes as an ultrasonic contrast agent. J Pharm Sci. 1996;85:486–490. doi: 10.1021/js950407f. [DOI] [PubMed] [Google Scholar]
- 11.Demos SM, Alkan-Onyuksel H, Kane BJ, et al. In vivo targeting of acoustically reflective liposomes for intravascular and transvascular ultrasonic enhancement. J Am Coll Cardiol. 1999;33:867–875. doi: 10.1016/s0735-1097(98)00607-x. [DOI] [PubMed] [Google Scholar]
- 12.Hamilton A, Huang SL, Warnick D, et al. Left ventricular thrombus enhancement after intravenous injection of echogenic immunoliposomes: studies in a new experimental model. Circulation. 2002;105:2772–2778. doi: 10.1161/01.cir.0000017500.61563.80. [DOI] [PubMed] [Google Scholar]
- 13.Hamilton AJ, Huang SL, Warnick D, et al. Intravascular ultrasound molecular imaging of atheroma components in vivo. J Am Coll Cardiol. 2004;43:453–460. doi: 10.1016/j.jacc.2003.07.048. [DOI] [PubMed] [Google Scholar]
- 14.Buchanan KD, Huang S, Kim H, et al. Echogenic liposome compositions for increased retention of ultrasound reflectivity at physiologic temperature. J Pharm Sci. 2008;97:2242–2249. doi: 10.1002/jps.21173. [DOI] [PMC free article] [PubMed] [Google Scholar]
- 15.Huang SL, Hamilton AJ, Nagaraj A, et al. Improving ultrasound reflectivity and stability of echogenic liposomal dispersions for use as targeted ultrasound contrast agents. J Pharm Sci. 2001;90:1917–1926. doi: 10.1002/jps.1142. [DOI] [PubMed] [Google Scholar]
- 16.Goldstein D, Lewis C. Advances in drug delivery and targeting. Curr Opin Oncol. 1991;3:1096–1104. doi: 10.1097/00001622-199112000-00019. [DOI] [PubMed] [Google Scholar]
- 17.Kikuchi H, Suzuki N, Ebihara K, et al. Gene delivery using liposome technology. J Control Release. 1999;62:269–277. doi: 10.1016/s0168-3659(99)00047-4. [DOI] [PubMed] [Google Scholar]
- 18.Tiukinhoy SD, Khan AA, Huang S, et al. Novel echogenic drug-immunoliposomes for drug delivery. Invest Radiol. 2004;39:104–110. doi: 10.1097/01.rli.0000111207.92580.44. [DOI] [PubMed] [Google Scholar]
- 19.Tiukinhoy-Laing SD, Buchanan K, Parikh D, et al. Fibrin targeting of tissue plasminogen activator-loaded echogenic liposomes. J Drug Target. 2007;15:109–114. doi: 10.1080/10611860601140673. [DOI] [PubMed] [Google Scholar]
- 20.Kim H, Laing ST, Kee P, et al. In vivo enhancement of adventitial neovascularization in developing atheroma using targeted echogenic immunoliposomes. Circulation. 2007;116:II–241. [Google Scholar]
- 21.Klegerman ME, Hamilton AJ, Huang SL, et al. Quantitative immunoblot assay for assessment of liposomal antibody conjugation efficiency. Anal Biochem. 2002;300:46–52. doi: 10.1006/abio.2001.5443. [DOI] [PubMed] [Google Scholar]
- 22.Lasch J, Weissig V, Brandl M. Preparation of liposomes. In: Torchilin VP, Weissig V, editors. Liposomes: A Practical Approach. 2. New York, NY: Oxford University Press; 2003. pp. 24–25. [Google Scholar]
- 23.Edgell T, McEvoy F, Webbon P, et al. Monoclonal antibodies to human fibrin: interaction with other animal fibrins. Thromb Haemost. 1996;75:595–599. [PubMed] [Google Scholar]
- 24.Smith DA, Porter TM, Martinez J, et al. Destruction thresholds of echogenic liposomes with clinical diagnostic ultrasound. Ultrasound Med Biol. 2007;33:797–809. doi: 10.1016/j.ultrasmedbio.2006.11.017. [DOI] [PubMed] [Google Scholar]
- 25.Klegerman ME, Huang S, Parikh D, et al. Lipid contribution to the affinity of antigen association with specific antibodies conjugated to liposomes. Biochim Biophys Acta. 2007;1768:1703–1716. doi: 10.1016/j.bbamem.2007.04.007. [DOI] [PMC free article] [PubMed] [Google Scholar]
- 26.Prati F, Arbustini E, Labellarte A, et al. Eccentric atherosclerotic plaques with positive remodelling have a pericardial distribution: a permissive role of epicardial fat? A three-dimensional intravascular ultrasound study of left anterior descending artery lesions. Eur Heart J. 2003;24:329–336. doi: 10.1016/s0195-668x(02)00426-8. [DOI] [PubMed] [Google Scholar]
- 27.Sanz-Requena R, Moratal D, Garcia-Sanchez DR, et al. Automatic segmentation and 3D reconstruction of intravascular ultrasound images for a fast preliminary evaluation of vessel pathologies. Comput Med Imaging Graph. 2007;31:71–80. doi: 10.1016/j.compmedimag.2006.11.004. [DOI] [PubMed] [Google Scholar]
- 28.Kohchi K, Takebayashi S, Hiroki T, et al. Significance of adventitial inflammation of the coronary artery in patients with unstable angina: results at autopsy. Circulation. 1985;71:709–716. doi: 10.1161/01.cir.71.4.709. [DOI] [PubMed] [Google Scholar]
- 29.Moreno PR, Purushothaman KR, Fuster V, et al. Intimomedial interface damage and adventitial inflammation is increased beneath disrupted atherosclerosis in the aorta: implications for plaque vulnerability. Circulation. 2002;105:2504–2511. doi: 10.1161/01.cir.0000017265.52501.37. [DOI] [PubMed] [Google Scholar]
- 30.Dobrin PB. Effect of histologic preparation on the cross-sectional area of arterial rings. J Surg Res. 1996;61:413–415. doi: 10.1006/jsre.1996.0138. [DOI] [PubMed] [Google Scholar]
- 31.Falk E. Coronary artery narrowing without irreversible myocardial damage or development of collaterals. Assessment of “critical” stenosis in a human model. Br Heart J. 1982;48:265–271. doi: 10.1136/hrt.48.3.265. [DOI] [PMC free article] [PubMed] [Google Scholar]
- 32.LeVeen RF, Wolf GL, Turco MA. Morphometric changes in normal arteries and those undergoing transluminal angioplasty. Invest Radiol. 1983;18:63–67. doi: 10.1097/00004424-198301000-00012. [DOI] [PubMed] [Google Scholar]
- 33.Loraine Lowder M, Li S, Carnell PH, et al. Correction of distortion of histologic sections of arteries. J Biomech. 2007;40:445–450. doi: 10.1016/j.jbiomech.2005.12.019. [DOI] [PubMed] [Google Scholar]
- 34.Demos SM, Dagar S, Klegerman M, et al. In vitro targeting of acoustically reflective immunoliposomes to fibrin under various flow conditions. J Drug Target. 1998;5:507–518. doi: 10.3109/10611869808997876. [DOI] [PubMed] [Google Scholar]


