Abstract
There is accumulating evidence suggesting that children may drive the spread of influenza epidemics. The objective of this study was to quantify the lead time by age using laboratory-confirmed cases of influenza A for the 1995/1996–2005/2006 seasons from Canadian communities and laboratory-confirmed hospital admissions for the H1N1/2009 pandemic strain. With alignment of the epidemic curves locally before aggregation of cases, slight age-specific differences in the timing of infection became apparent. For seasonal influenza, both the 10–19- and 20–29-year age groups peaked 1 week earlier than other age groups, while during the fall wave of the 2009 pandemic, infections peaked earlier among only the 10–19-year age group. In the H3N2 seasons, infections occurred an average of 3.9 (95% confidence interval: 1.7, 6.1) days earlier in the 20–29-year age group than for youth aged 10–19 years, while during the fall pandemic wave, the 10–19-year age group had a statistically significant lead of 3 days compared with both younger children aged 4–9 years and adults aged 20–29 years (P < 0.0001). This analysis casts doubt on the hypothesis that younger school-age children actually lead influenza epidemic waves.
Keywords: age groups; data interpretation, statistical; diagnostic techniques and procedures; disease transmission, infectious; empirical research; influenza, human; population surveillance
Studies have shown that children have high clinical attack rates (1, 2), have high social contact rates within the school environment (3–5), and play a major role in introducing influenza infections into the household (6) and in further transmission within the household (7). A few studies identify older school-age students as the group most likely to drive the local spread (3, 5). Most other studies include younger school-age children as the drivers of local spread, with some studies reporting community-wide benefits from the vaccination of school-age children (8). Viboud et al. (9) suggest that working-age adults might be responsible for the spread between communities.
The methods and data to assess the age differences in the timing of influenza infections are limited. Excess pneumonia and influenza admissions and other similar time series, such as emergency department visits for influenza-like illnesses, have been used to identify periods of influenza activity. Using these data sources, Brownstein et al. (10) identify children aged 3–4 years as the age group that was consistently the earliest, while Sebastian et al. (11) found little age-specific difference in the timing of peak activity. Understanding the relative timing of influenza infections in different age groups is of importance to influenza burden studies that rely on proxy measures of influenza activity (12–14). In Canadian studies of hospital admissions (13, 14), it appeared that the influenza virus was unlikely to be responsible for the peaks in respiratory admissions in young children, as parainfluenza virus and respiratory syncytial virus accounted for a larger proportion of respiratory admissions than did influenza. In this case, laboratory confirmation would be required to assess the relative timing of influenza infections by age group.
The objective of this study was to use our extensive surveillance of laboratory-confirmed influenza cases over more than 10 seasons to identify the age groups for which influenza activity peaks first in the community. The issue of the effectiveness of school closures during a pandemic is an important one (15) and one still under consideration internationally (16). It is hoped that this description of the age-specific epidemic curves will also be useful in future modeling projects addressing this important issue.
MATERIALS AND METHODS
Data sources
Records of confirmed cases of influenza A from September 1995 to August 2006 were obtained from the FluWatch program, Public Health Agency of Canada (17, 18). As part of the national surveillance program, laboratories participating in the case-by-case program reported detailed epidemiologic information including age, sex, date of specimen collection, and community of residence for influenza-positive specimens. These specimens were submitted to laboratories by clinicians in the course of clinical care and patient management in inpatient, emergency room or outpatient settings, and by sentinel physicians participating in the national influenza surveillance program. The specified community of residence was grouped into census metropolitan areas or census agglomerations (19) as appropriate. Census metropolitan areas and census agglomerations are groupings of adjacent municipalities and rural areas that are highly integrated with a central urban area. Census metropolitan areas have a population of at least 100,000 and an urban core of at least 50,000 persons, while census agglomerations include smaller cities and towns with an urban core of at least 10,000 persons and a total population under 100,000. As of 2001, there were 33 census metropolitan areas and 111 census agglomerations in Canada (20).
During the 2009 H1N1 pandemic period, hospital admissions of patients with laboratory confirmation of the pandemic strain (A/California/7/2009) were reported to the Public Health Agency of Canada (18) with 9 of 10 provinces providing age, date of symptom onset, specimen collection date or date of hospital admission, and province of admission throughout the full 2009 pandemic period. Although the number of laboratory-confirmed cases of seasonal influenza appears to be temporally representative of the level of influenza activity at the community level (21), this was not the case during the 2009 pandemic, as laboratory testing practices varied in response to public health needs over the pandemic period. As a result of the intensive use of laboratory testing to identify H1N1/2009 infections in hospitalized patients over the 2009 pandemic period, laboratory-confirmed admissions should provide the best temporally representative data source available for the fall pandemic wave and, hence, the use of laboratory-confirmed hospital admissions as a proxy for the level of influenza activity during the pandemic period.
Data preparation
The epidemic midpoint, defined as the date when cumulative incidence reaches 50% of the cumulative total of the seasonal cases for 1 season, was determined for each season and reporting geographic unit (census metropolitan area/census agglomeration for seasonal influenza and participating province for the 2009 pandemic waves). Various influenza A strains routinely cocirculate and, with the exception of the 2009 pandemic season, strain characterization was not routine. Hence, seasons were characterized by national year-end summary reports (18) in order to identify seasons where a single strain predominated (17, 22). From 1996/1997 through the 2003/2004 seasons, a single antigenic strain accounted for at least 80% of the influenza A specimens characterized. In the 2002/2003 season, while most H1 specimens were H1N2 rather than H1N1, all influenza A(H1) specimens characterized were antigenically similar to the hemagglutinin of the vaccine strain A/New Caledonia/20/99(H1N1). The neuraminidase of the H1N2 viruses was closely related to the contemporary H3N2 viruses (22). Influenza A seasons were classified by subtype and by strain novelty. The dominant strain was considered novel in 1997/1998 and 2003/2004, while in other seasons the dominant antigenic strain had circulated in previous seasons and the vaccine match was considered good. Most provinces experienced 2 distinct waves of the H1N1 pandemic strain: a spring and fall wave. Due to potential differences in transmission rates during the spring and fall, cases from the 2 waves were not combined. Pandemic and seasonal epidemic curves were analyzed separately.
Statistical analysis
After alignment of the epidemic locally, age-specific composite epidemic curves were created by aggregation of cases by the day relative to the local midpoint and age group. Geographic units with at least 25 cases per season and seasons where a single influenza A strain predominated were included in the analysis. Mean differences in relative timing and the standard error of the mean were calculated for each age group and strain category and presented graphically with error bars corresponding to 95% confidence intervals. Nonoverlapping confidence intervals indicate a significant difference in the timing of infections between 2 age groups from the same composite epidemic, although at a slightly higher level of statistical significance. Confidence intervals for the mean difference between 2 age groups were calculated on the basis of the standard error of the mean difference. A regression model approach was used to statistically test for an age effect within a composite epidemic and to compare the age-specific timing of 2 epidemics (e.g., the spring and fall H1N1/09 waves).
The week of peak activity was noted for each age group, and the shape of the age-specific epidemic curves was shown graphically. As a summary measure of the shape of the epidemic curve, the interquartile range (third quartile minus the first quartile or the minimum number of days over which 50% of the infections occurred) was calculated for each age group. Presumably, higher within-age-group transmission rates would also be associated with a more intense activity over a shorter period of time. All analyses were carried out in SAS Enterprise Guide, Version 4.1, software (SAS Institute, Inc., Cary, North Carolina).
RESULTS
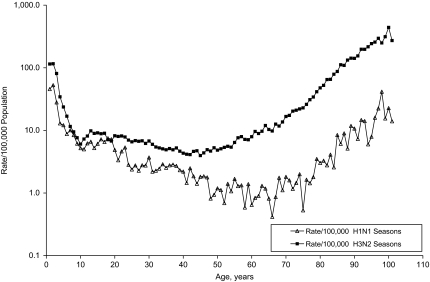
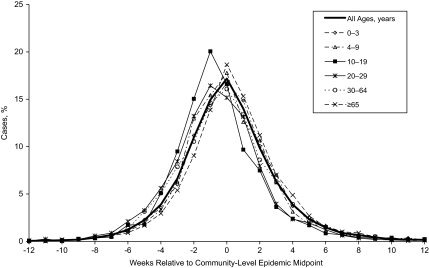
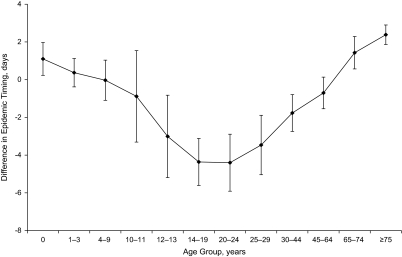
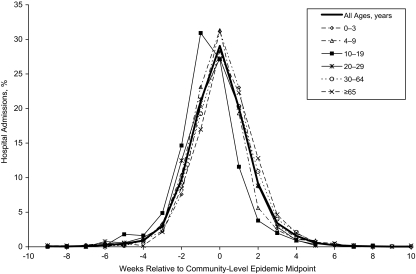
The number of census metropolitan areas/census agglomerations reporting more than 25 laboratory-confirmed influenza A cases to the case-by-case database varied from 10 to 31 communities per season and accounted for 60% of the confirmed cases. The remaining cases were grouped by province. The range in timing of peak activity in one season varied from 8 to 18 weeks across Canada, although asynchronization within a province was minimal (21). The rate of laboratory-confirmed case reporting for seasonal influenza A virus was highest in the very young and very old, with pronounced differences by subtype (Figure 1). Slight differences are noted in the age-specific composite epidemic curves for seasonal influenza (Figure 2). Influenza A activity peaked in the same week as the community-wide epidemic midpoint for most age groups and 1week earlier among youth aged 10–19 years and young adults aged 20–29 years. A finer age-group assessment of the average difference in relative timing indicates that infections occurred approximately 6 days earlier among youth and young adults compared with persons 75 years of age or older (Figure 3).
Figure 1.
Laboratory-confirmed cases of influenza A/100,000 population per season, 1996/1997–2005/2006, by subtype, Canada. The age-specific rate of laboratory confirmation of influenza A virus differs by subtype.
Figure 2.
Distribution of laboratory-confirmed influenza A cases by age and week relative to the community-level epidemic midpoint, Canada, 1996/1997–2005/2006. Age-specific composite epidemic curves were created by centering the local epidemics relative to their epidemic midpoint of the geographic unit and aggregating cases for geographic units with at least 25 cases per season and seasons where a single influenza A strain predominated.
Figure 3.
Differences in the timing of influenza A epidemic waves by age group among laboratory-confirmed cases, Canada, 1996/1997–2003/2004. After alignment of the epidemic locally, age-specific composite epidemic curves were created by aggregating cases by the day relative to the local midpoint and age group. The mean differences in relative timing and the standard error of the mean were calculated for each age group. Error bars correspond to 95% confidence intervals.
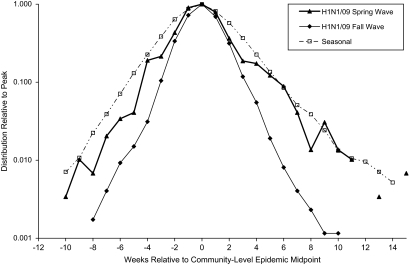
On the basis of reported laboratory-confirmed hospital admissions, the spring wave of the pandemic H1N1/09 strain peaked provincially between early June and mid-July and nationally in mid-June. The number of hospital admissions continued to decline throughout the summer. The fall wave peaked provincially between late October and mid-November and nationally in early November. The vaccine was authorized by Health Canada on October 21, 2009 (23), with priority distribution to designated groups starting shortly thereafter (24). As the composite epidemic curves for the spring and fall waves (Figure 4) suggest that transmission/epidemic growth was slower during the spring wave, data from the 2 pandemic waves were not combined. The proportion of persons aged 10–29 years among all laboratory-confirmed H1N1/09 admissions dropped from 24% in the spring wave to 18% in the fall wave for an odds ratio of 0.69 (95% confidence interval (CI): 0.74, 0.97). However, the average lead time for youth (aged 10–19 years) compared with other age groups combined persisted: 4.6 (95% CI: 0.7, 8.6) days and 4.7 days (95% CI: 3.7, 5.7) in the spring and fall waves, respectively. Statistical power for the spring wave was limited, and lead-time differences for finer age groups were not statistically significant. H1N1/09 activity during the fall wave peaked 1 week early among youth 10–19 years of age than among other age groups (Figure 5).
Figure 4.
Distribution of laboratory-confirmed influenza A cases/admissions, by week relative to the local epidemic midpoint, Canada, 2009. Composite epidemic curves are shown for both waves of the H1N1/09 pandemic strain in Canada and for seasonal influenza epidemic waves. As the composite epidemic curves for the spring and fall waves suggest that transmission/epidemic growth was slower during the spring wave, data from the 2 pandemic waves were analyzed separately.
Figure 5.
Distribution of laboratory-confirmed pandemic influenza hospital admissions, by age and week relative to the community-level epidemic midpoint, H1N1/09/fall wave, Canada, 2009. The 10–19-year age group leads the H1N1/09 fall pandemic wave.
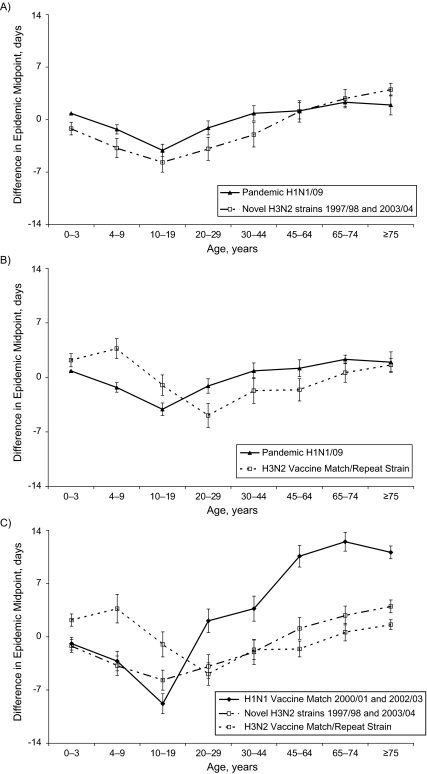
The age-specific differences in relative timing were similar for the fall wave of the H1N1/09 strain and the 2 H3N2 seasons where a new antigenic strain emerged quickly and the vaccine was also poorly matched (in the 1997/1998 season, the A/Sydney/05/97 H3N2 strain replaced the A/Wuhan/359/95 strain, and A/Fujian/411/02 replaced the previous H3N2 strain, A/Panama/2007/99, in the 2003/2004 season) (Figure 6A). The relative timing of infections was not statistically different for the 6 younger age groups (covering the ages of 0–64 years). The gap between the 2 curves is accounted for by a shift of approximately 2 days in the overall epidemic midpoint resulting from a shift in disease burden toward younger age groups during the pandemic. The delay in timing between youth aged 10–19 years and persons aged 65 years or older was significantly reduced from 6.2 (95% CI: 5.3, 7.2) days to 3.4 (95% CI: 2.7, 4.1) days for the novel H3N2 seasons and H1N1/09 pandemic, respectively. In the remaining H3N2 seasons where there was some exposure to the antigenic strain in the previous season and the vaccine was well matched to the dominant strain, infections occurred earliest in the 20–29-year age group (Figure 6B). The 2 seasons when the H1 antigenic strain A/New Caledonia/20/99 was the dominant influenza A strain showed the strongest lead time in the 10–19-year age group (Figure 6C).
Figure 6.
Age-group differences in the timing of influenza A waves, Canada, 1997–1998 and 2003–2004 seasons. A, the age structure of the fall wave of the H1N1/09 pandemic compared with H3N2 seasons where the predominant strain emerged quickly and the vaccine was not a good antigenic match to the predominant circulating strain. The relative timing of infections was not statistically different for the 6 younger age groups (covering the ages of 0–64 years). The gap between the 2 curves is accounted for by a shift of approximately 2 days in the overall epidemic midpoint resulting from a shift in disease burden toward younger age groups during the pandemic. B, the age structure for the fall wave of the H1N1/09 pandemic compared with seasonal H3N2 waves for seasons where the antigenic strain circulated in the previous season and the vaccine was considered a good antigenic match to the predominant circulating strain. C, the age structure for seasonal influenza by subtype and vaccine match.
Despite slight differences in the age-specific timing of infections, the shapes of the age-specific epidemic curves appeared to be similar (Figures 2 and 5). The interquartile range for the age-specific epidemic waves ranged from 11 to 14 days for the second H1N1/09 pandemic wave and from 20 to 25 days for seasonal influenza A/H3N2. In both cases, the minimal interquartile range corresponded to the 10–19-year age group, suggesting that this age group has the most intense within-class transmission.
In additional subanalyses of seasonal influenza by sex, geography, and season, the 15–19-year age group was the age group most often associated with the earliest infections and shortest interquartile range, observations which are suggestive of higher within-group transmission rates for this age group. Lead-time differences for the 15–19-year age groups were statistically significant when compared with age groups other than the 10–14-year and 20–29-year age groups. Of note, the age profiles for urban (census metropolitan areas) compared with rural areas (the rest of the province as a geographic unit) and for males compared with females were similar. In some years (typically milder influenza seasons), the age group differences were not statistically significant.
DISCUSSION
After alignment of epidemics at the provincial or community level, small differences in the age-specific timing of influenza infections have been identified. During the fall pandemic wave, infections peaked noticeably earlier among children and youth aged 10–19 years, with an average 2.8 (95% CI: 1.6, 4.0; standard error (SE): 0.6)-day lead in the timing of infections compared with younger children aged 4–9 years and an average 3.0 (95% CI: 1.6, 4.3; SE: 0.7)-day lead compared with young adults aged 20–29 years. The age pattern of the fall wave of the 2009 pandemic was fairly similar to the pattern observed in the 2 H3N2 seasons with a novel antigenic strain (A/Sydney/05/97 in the 1997/1998 season and A/Fujian/411/02 in 2003/2004), as illustrated in Figure 6A. In contrast, for the H3N2 seasons where the antigenic strain was not novel and the vaccine well matched, infections among young adults aged 20–29 years led infections among youth aged 10–19 years by 3.9 (95% CI: 1.7, 6.1; SE: 1.1) days. The largest observed difference of 8.6 (95% CI: 6.3, 10.9; SE: 1.2) days was between young adults aged 20–29 years and children 4–9 years of age (Figure 6B). The age-specific differences were usually within 1 week for most age groups. For the 2 H1 seasons, a longer delay among adults aged 45 years or older of approximately 2–3 weeks compared with youth aged 10–19 years was noted. This may have been due to the cocirculation of 2 distinct but antigenically similar strains during the 2002/2003 season. Although the hemagglutinin samples of the H1N2 strains were antigenically similar to that of the vaccine strain A/New Caledonia/20/99 (H1N1), the level of cross-protection between the H1N1 and H1N2 strains may have been less than for other antigenically similar strains. It is possible that the level of activity for these 2 strains peaked at different times with differential clinical attack rates by age.
Our results are in agreement with those of the study of social contacts by Glass and Glass (3), where high school students and young adults were identified as the age group most likely to form the transmission backbone for the next pandemic because of the nature of their contact networks. Our results tend not to support the inclusion of younger school-age children (5–9 years) in the lead group as others have suggested (4, 10) despite their high attack rate (25). The relative timing for children aged 10–13 years appears to be intermediate relative to older and younger age groups. Variability in the timing of peak influenza activity by age was noted in an earlier study by Monto et al. (26) on the basis of influenza-like illness consultation rates, virus isolation, and serology in a single community. The results of studies assessing age-specific differences in the timing of peak influenza-like illness consultation rates, emergency room visits, or pneumonia and influenza admissions are mixed (1, 10, 11). Although statistical methods exist to estimate a seasonal baseline for time series that are not specific to influenza, such as pneumonia and influenza admissions, and attribute the excess to influenza or other respiratory virus (13, 27, 28), these statistical estimates do not have the precision of methods using laboratory-confirmed cases. With less statistical power, influenza-like illness-based studies would be less likely to find age-specific differences. Although it is reasonable to assume that the peak in adult pneumonia and influenza admissions corresponds to the peak in influenza activity, this is not the case for children, where parainfluenza virus and respiratory syncytial virus were found to account for more admissions than influenza and where peaks in respiratory admissions did not correspond to peaks in influenza activity (13, 14). The higher transmission rate observed during the fall pandemic wave compared with the spring wave (inferred from differences in the epidemic growth rate) (Figure 4) was expected and is consistent with the seasonal trend in transmission rates that was observed for seasonal influenza (21).
The 1-week difference in the timing of infections between youth and older adults is very short compared with differences in the timing of peak activity across Canada, which has been observed to be as long as 13 weeks (21). The age-specific differences are slight, and as laboratory confirmation is not considered geographically representative, it was essential to control for these geographic differences in order to identify the age-specific differences. The date of symptom onset was available for most of the hospital admissions with pandemic H1N1/09; however, laboratory-confirmed cases for seasonal influenza were identified only by the date of specimen collection. Thus, we were unable to account for any age-specific differences in the time from symptom onset to presentation for medical care and specimen collection in the analysis of the seasonal influenza data. Persons presenting for medical care because of complications more than a week after onset of symptoms are, however, likely to have already cleared the virus, and positive findings are expected to be less likely at that time (29). The average delay from symptom onset to hospital admission with laboratory-confirmed H1N1/09 was 3.7 (95% CI: 3.2, 4.1) days, increasing with increasing age from 2.7 to 4.7 days. Based on a very small proportion of cases of seasonal influenza in 2007/2008, the average delay from symptom onset to specimen procurement was 3 (95% CI: 2.8, 3.2) days, although the age trend was reversed. Although we used 2 different proxies for the level of influenza activity (laboratory-confirmed admissions and laboratory-confirmed cases representing a mix of inpatient and outpatients), the results appear to be in good agreement, and the generalization of age-specific differences in the relative timing of laboratory-confirmed admissions to the relative timing of infection appears reasonable. The potential impact of the various study limitations is likely in days rather than weeks and less than the observed variation from season to season. Each season is different, and although we compared the age-specific differences in the timing of infections by strain subtype and vaccine match/previous circulation of the antigenic strain, the number of seasons included in this study was too small to fully assess possible reasons for the observed differences in the age structure of the epidemic curves.
During the pandemic period, clinical and laboratory testing procedures varied in response to public health and clinical needs and laboratory capacity, so that detection rates were not constant over the pandemic period. The initial objective was to document the first 100 cases of the pandemic strain, as our ability to assess the virulence of the pandemic strain was otherwise limited. As many of the early cases that were identified among recent travelers to Mexico were relatively mild, intense surveillance continued beyond the first 100 cases before becoming more restrictive. Hence, the number of laboratory-confirmed hospital admissions was used, rather than the number of laboratory-confirmed cases, to describe the epidemic curve for the pandemic period. The roll out of the vaccination campaign as the epidemic peaked in November in many jurisdictions appears to have had a limited impact on the study results. Infants under the age of 6 months were not vaccinated, and persons over the age of 65 years were not among the priority groups that received the vaccine during the period of peak activity (24). Although priority was given to all children aged from 6 months to 5 years because of their higher risk for severe outcomes, this was not the lead age group, and calculations (not shown) based on estimates of weekly vaccination rates suggest that the direct effects of the vaccination effort would have minimal effect on the average timeliness of influenza infections by age.
Many studies have identified schoolchildren as the drivers of the local spread of influenza, prompting considerations of influenza vaccination for all schoolchildren and the use of school closures to mitigate the effects of a pandemic (15, 25, 30–34). Not all studies agree on the likely benefits of closing schools (35, 36), and our study of the timing of laboratory-confirmed cases of influenza A suggests that the effect of age on timing may be smaller than predicted by various models (31, 35, 37). Mitigation of influenza epidemics remains complex, although the role of youth and young adults as potential drivers of the epidemic waves of seasonal and pandemic influenza should also be considered. Although this study casts doubt on the hypothesis that younger school-age children lead influenza epidemic waves, interventions targeting young children may still have a significant impact on the size of the epidemic. Even though the age-specific lead times are short, these differences in timing are sufficient to bias age-specific relative risks calculated early in the course of an epidemic or pandemic wave.
Acknowledgments
Author affiliation: Infectious Disease Prevention and Control Branch, Public Health Agency of Canada, Ottawa, Ontario, Canada (Dena Schanzer, Julie Vachon, Louise Pelletier).
The support of the National FluWatch Network and all those involved in the collection and compilation of these data is gratefully acknowledged.
This work was presented in part at the 2010 Joint Statistical Meetings, Vancouver, British Columbia, Canada, July 31–August 5, 2010.
Conflict of interest: none declared.
Glossary
Abbreviations
- CI
confidence interval
- SE
standard error
References
- 1.Olson DR, Heffernan RT, Paladini M, et al. Monitoring the impact of influenza by age: emergency department fever and respiratory complaint surveillance in New York City [electronic article] PLoS Med. 2007;4(8):e247. doi: 10.1371/journal.pmed.0040247. [DOI] [PMC free article] [PubMed] [Google Scholar]
- 2.Longini IM, Jr, Koopman JS, Haber M, et al. Statistical inference for infectious diseases. Risk-specific household and community transmission parameters. Am J Epidemiol. 1988;128(4):845–859. doi: 10.1093/oxfordjournals.aje.a115038. [DOI] [PubMed] [Google Scholar]
- 3.Glass LM, Glass RJ. Social contact networks for the spread of pandemic influenza in children and teenagers [electronic article] BMC Public Health. 2008;8:61. doi: 10.1186/1471-2458-8-61. [DOI] [PMC free article] [PubMed] [Google Scholar]
- 4.Mossong J, Hens N, Jit M, et al. Social contacts and mixing patterns relevant to the spread of infectious diseases [electronic article] PLoS Med. 2008;5(3):e74. doi: 10.1371/journal.pmed.0050074. [DOI] [PMC free article] [PubMed] [Google Scholar]
- 5.Wallinga J, Teunis P, Kretzschmar M. Using data on social contacts to estimate age-specific transmission parameters for respiratory-spread infectious agents. Am J Epidemiol. 2006;164(10):936–944. doi: 10.1093/aje/kwj317. [DOI] [PubMed] [Google Scholar]
- 6.Longini IM, Jr, Koopman JS, Monto AS, et al. Estimating household and community transmission parameters for influenza. Am J Epidemiol. 1982;115(5):736–751. doi: 10.1093/oxfordjournals.aje.a113356. [DOI] [PubMed] [Google Scholar]
- 7.Viboud C, Boëlle PY, Cauchemez S, et al. Risk factors of influenza transmission in households. Br J Gen Pract. 2004;54(506):684–689. [PMC free article] [PubMed] [Google Scholar]
- 8.Monto AS, Davenport FM, Napier JA, et al. Effect of vaccination of a school-age population upon the course of an A2-Hong Kong influenza epidemic. Bull World Health Organ. 1969;41(3):537–542. [PMC free article] [PubMed] [Google Scholar]
- 9.Viboud C, Bjørnstad ON, Smith DL, et al. Synchrony, waves, and spatial hierarchies in the spread of influenza. Science. 2006;312(5772):447–451. doi: 10.1126/science.1125237. [DOI] [PubMed] [Google Scholar]
- 10.Brownstein JS, Kleinman KP, Mandl KD. Identifying pediatric age groups for influenza vaccination using a real-time regional surveillance system. Am J Epidemiol. 2005;162(7):686–693. doi: 10.1093/aje/kwi257. [DOI] [PMC free article] [PubMed] [Google Scholar]
- 11.Sebastian R, Skowronski DM, Chong M, et al. Age-related trends in the timeliness and prediction of medical visits, hospitalizations and deaths due to pneumonia and influenza, British Columbia, Canada, 1998–2004. Vaccine. 2008;26(10):1397–1403. doi: 10.1016/j.vaccine.2007.11.090. [DOI] [PMC free article] [PubMed] [Google Scholar]
- 12.Thompson WW, Shay DK, Weintraub E, et al. Influenza-associated hospitalizations in the United States. JAMA. 2004;292(11):1333–1340. doi: 10.1001/jama.292.11.1333. [DOI] [PubMed] [Google Scholar]
- 13.Schanzer DL, Langley JM, Tam TW. Role of influenza and other respiratory viruses in admissions of adults to Canadian hospitals. Influenza Other Respi Viruses. 2008;2(1):1–8. doi: 10.1111/j.1750-2659.2008.00035.x. [DOI] [PMC free article] [PubMed] [Google Scholar]
- 14.Schanzer DL, Langley JM, Tam TW. Hospitalization attributable to influenza and other viral respiratory illnesses in Canadian children. Pediatr Infect Dis J. 2006;25(9):795–800. doi: 10.1097/01.inf.0000232632.86800.8c. [DOI] [PubMed] [Google Scholar]
- 15.Public Health Agency of Canada. The Canadian pandemic influenza plan for the health sector. Ottawa, Ontario, Canada: Public Health Agency of Canada; 2010. ( http://www.phac-aspc.gc.ca/cpip-pclcpi/index-eng.php). (Accessed June 29, 2009) [Google Scholar]
- 16.World Health Organization. Measures in school settings: pandemic (H1N1) 2009 briefing note 10. Geneva, Switzerland: World Health Organization; 2009. ( http://www.who.int/csr/disease/swineflu/notes/h1n1_school_measures_20090911/en/). (Accessed April 26, 2010) [Google Scholar]
- 17.Reyes F, Macey JF, Aziz S, et al. Influenza in Canada: 2005–2006 season. Can Commun Dis Rep. 2007;33(3):21–41. [PubMed] [Google Scholar]
- 18.Public Health Agency of Canada. FluWatch reports. Ottawa, Ontario, Canada: Public Health Agency of Canada; 2008. ( http://www.phac-aspc.gc.ca/fluwatch/index-eng.php). (Accessed January 30, 2008) [Google Scholar]
- 19.Statistics Canada. 2001 Census Dictionary. Ottawa, Ontario, Canada: Census Operations Division; 2003. (Catalog no. 92-378-XIE) [Google Scholar]
- 20.Statistics Canada. Population and Dwelling Counts (On-line)—Highlight Tables, 2001 Census. Ottawa, Ontario, Canada: Health Statistics Division; 2002. (Catalog no. 93F0051XIE) [Google Scholar]
- 21.Schanzer DL, Langley JM, Dummer T, et al. A composite epidemic curve for seasonal influenza in Canada with an international comparison. Influenza Other Respi Viruses. 2010;4(5):295–306. doi: 10.1111/j.1750-2659.2010.00154.x. [DOI] [PMC free article] [PubMed] [Google Scholar]
- 22.Aziz S, Tam T, Macey J, et al. Influenza in Canada: 2003–2004 season. Can Commun Dis Rep. 2005;31(1):1–18. [PubMed] [Google Scholar]
- 23.Health Canada. Authorization for sale: Arepanrix™ H1N1. Ottawa, Ontario, Canada: Health Canada; 2009. ( http://www.hc-sc.gc.ca/dhp-mps/prodpharma/legislation/interimorders-arretesurgence/lett-vaccin-eng.php). (Accessed April 20, 2010) [Google Scholar]
- 24.Butler-Jones D. H1N1 immunization campaign: our plan for Canadians. Ottawa, Ontario, Canada: Public Health Agency of Canada; 2009. ( http://www.phac-aspc.gc.ca/alert-alerte/h1n1/pdf/3534-PN-H1N1-Eng-15.pdf). (Accessed April 26, 2010) [Google Scholar]
- 25.Basta NE, Chao DL, Halloran ME, et al. Strategies for pandemic and seasonal influenza vaccination of schoolchildren in the United States. Am J Epidemiol. 2009;170(6):679–686. doi: 10.1093/aje/kwp237. [DOI] [PMC free article] [PubMed] [Google Scholar]
- 26.Monto AS, Koopman JS, Longini IM., Jr Tecumseh study of illness. XIII. Influenza infection and disease, 1976–1981. Am J Epidemiol. 1985;121(6):811–822. doi: 10.1093/oxfordjournals.aje.a114052. [DOI] [PubMed] [Google Scholar]
- 27.Serfling RE. Methods for current statistical analysis of excess pneumonia-influenza deaths. Public Health Rep. 1963;78(6):494–506. [PMC free article] [PubMed] [Google Scholar]
- 28.Thompson WW, Shay DK, Weintraub E, et al. Mortality associated with influenza and respiratory syncytial virus in the United States. JAMA. 2003;289(2):179–186. doi: 10.1001/jama.289.2.179. [DOI] [PubMed] [Google Scholar]
- 29.Schanzer DL, Garner MJ, Hatchette TF, et al. Estimating sensitivity of laboratory testing for influenza in Canada through modeling [electronic article] PLoS One. 2009;4(8):e6681. doi: 10.1371/journal.pone.0006681. [DOI] [PMC free article] [PubMed] [Google Scholar]
- 30.Fiore AE, Shay DK, Broder K. Prevention and control of influenza: recommendations of the Advisory Committee on Immunization Practices (ACIP), 2008. MMWR Recomm Rep. 2008;57(RR-7):1–60. [PubMed] [Google Scholar]
- 31.Cauchemez S, Ferguson NM, Wachtel C, et al. Closure of schools during an influenza pandemic. Lancet Infect Dis. 2009;9(8):473–481. doi: 10.1016/S1473-3099(09)70176-8. [DOI] [PMC free article] [PubMed] [Google Scholar]
- 32.Glass K, Barnes B. How much would closing schools reduce transmission during an influenza pandemic? Epidemiology. 2007;18(5):623–628. doi: 10.1097/EDE.0b013e31812713b4. [DOI] [PubMed] [Google Scholar]
- 33.Cauchemez S, Valleron AJ, Boëlle PY, et al. Estimating the impact of school closure on influenza transmission from sentinel data. Nature. 2008;452(7188):750–754. doi: 10.1038/nature06732. [DOI] [PubMed] [Google Scholar]
- 34.Koonin LM, Cetron MS. School closure to reduce influenza transmission. Emerg Infect Dis. 2009;15(1):137–138. doi: 10.3201/eid1501.081289. author reply 138. [DOI] [PMC free article] [PubMed] [Google Scholar]
- 35.Cowling BJ, Lau EH, Lam CL, et al. Effects of school closures, 2008 winter influenza season, Hong Kong. Emerg Infect Dis. 2008;14(10):1660–1662. doi: 10.3201/eid1410.080646. [DOI] [PMC free article] [PubMed] [Google Scholar]
- 36.Lee BY, Brown ST, Cooley P, et al. Simulating school closure strategies to mitigate an influenza epidemic. J Public Health Manag Pract. 2010;16(3):252–261. doi: 10.1097/PHH.0b013e3181ce594e. [DOI] [PMC free article] [PubMed] [Google Scholar]
- 37.Vynnycky E, Edmunds WJ. Analyses of the 1957 (Asian) influenza pandemic in the United Kingdom and the impact of school closures. Epidemiol Infect. 2008;136(2):166–179. doi: 10.1017/S0950268807008369. [DOI] [PMC free article] [PubMed] [Google Scholar]


