

Abstract
Background
The Breast Cancer Risk Assessment Tool (BCRAT) of the National Cancer Institute is widely used for estimating absolute risk of invasive breast cancer. However, the absolute risk estimates for Asian and Pacific Islander American (APA) women are based on data from white women. We developed a model for projecting absolute invasive breast cancer risk in APA women and compared its projections to those from BCRAT.
Methods
Data from 589 women with breast cancer (case patients) and 952 women without breast cancer (control subjects) in the Asian American Breast Cancer Study were used to compute relative and attributable risks based on the age at menarche, number of affected mothers, sisters, and daughters, and number of previous benign biopsies. Absolute risks were obtained by combining this information with ethnicity-specific data from the National Cancer Institute’s Surveillance, Epidemiology, and End Results (SEER) program and with US ethnicity-specific mortality data to create the Asian American Breast Cancer Study model (AABCS model). Independent data from APA women in the Women’s Health Initiative (WHI) were used to check the calibration and discriminatory accuracy of the AABCS model.
Results
The AABCS model estimated absolute risk separately for Chinese, Japanese, Filipino, Hawaiian, Other Pacific Islander, and Other Asian women. Relative and attributable risks for APA women were comparable to those in BCRAT, but the AABCS model usually estimated lower-risk projections than BCRAT in Chinese and Filipino, but not in Hawaiian women, and not in every age and ethnic subgroup. The AABCS model underestimated absolute risk by 17% (95% confidence interval = 1% to 38%) in independent data from WHI, but APA women in the WHI had incidence rates approximately 18% higher than those estimated from the SEER program.
Conclusions
The AABCS model was calibrated to ethnicity-specific incidence rates from the SEER program for projecting absolute invasive breast cancer risk and is preferable to BCRAT for counseling APA women.
CONTEXT AND CAVEATS
Prior knowledge
The National Cancer Institute Breast Cancer Risk Assessment Tool (BCRAT) uses data from white women to project absolute invasive breast cancer risk for Asian and Pacific Islander American (APA) women living in the United States. However, the projections may not always be accurate, which affects counseling and inclusion of these women in breast cancer prevention trials.
Study design
Data from the Asian American Breast Cancer Study and ethnicity-specific data from the National Cancer Institute’s Surveillance, Epidemiology, and End Results (SEER) Program were used to develop the Asian American Breast Cancer Study model (AABCS model) to estimate ethnicity-specific absolute risks for APA women. Independent data from the Women’s Health Initiative were used to validate the model.
Contribution
For Chinese and Filipino women, projections of absolute risk were lower in the AABCS model compared with BCRAT, but not in Hawaiian women, and not in every age and ethnic subgroup. AABCS model tended to underestimate risk in the Women’s Health Initiative cohort, but the breast cancer rates in this cohort were higher than the SEER rates, and the AABCS model was calibrated to SEER rates.
Implications
The AABCS model is recommended for counseling APA women and for designing and determining their eligibility for breast cancer prevention trials.
Limitations
Confidence intervals are wide for women with large risks, and some statistical analyses were underpowered. The AABCS model also should be validated in additional cohorts.
From the Editors
The National Cancer Institute’s Breast Cancer Risk Assessment Tool (BCRAT) (http://www.cancer.gov/bcrisktool/) projects absolute invasive breast cancer risk and has been used for counseling women and designing breast cancer prevention trials. Although BCRAT includes separate risk-prediction models for white (1) and African American women (2), projections of absolute risk for Asian and Pacific Islander American (APA) women are based on data from white women only (1,3). Therefore, BCRAT includes a disclaimer for APA women. Inaccurate projections could result in misleading counseling of APA women and might mistakenly render some of them as eligible or ineligible for participation in breast cancer prevention trials. For these reasons, there is a need to develop a model for APA women that is based on sufficient ethnicity-specific data. The population-based Asian American Breast Cancer Study included APA women with invasive breast cancer and APA women as control subjects (4). Because this study gathered information on the factors included in the original Gail model (3), relative and attributable risks specific to APA women could be estimated from the 589 case patients with breast cancer and 952 control subjects; these women had complete covariate data. In the current study, we used data from the Asian American Breast Cancer Study and ethnicity-specific data from the National Cancer Institute’s Surveillance, Epidemiology, and End Results (SEER) program from 1998 through 2002 to estimate absolute invasive breast cancer risk for APA women and obtain 95% confidence intervals (CI) for the estimates. We call this new model the Asian American Breast Cancer Study model (AABCS model). We also compare these new risk projections with those from the current BCRAT and check the calibration of the new AABCS model with independent data from the Women’s Health Initiative (WHI) (5).
Methods and Data Sources
Overall Approach to Constructing a Risk Model and Data Sources
Estimates of relative and attributable risks for breast cancer risk factors were obtained from case–control data from the Asian American Breast Cancer Study (4) of women of Chinese, Japanese, and Filipino ancestries who were living in California and Hawaii during the accrual period, April 1, 1983, through June 30, 1987. The women were not necessarily born in the United States. Estimated relative risks from this study were tested for heterogeneity across ethnicities and then assumed to be homogeneous to produce the same estimates for all ethnicities. An estimated attributable risk was obtained that represented Chinese, Japanese, and Filipino women in the SEER population. The resulting estimates of relative and attributable risks were combined with ethnicity-specific invasive breast cancer incidence rates and with national non-breast cancer mortality rates from SEER to produce separate estimates of absolute risk for American women categorized as Chinese, Japanese, Filipino, Hawaiian, Other Pacific Islander, and Other Asian.
The study methods for the population-based Asian American Breast Cancer Study have previously been described in detail in Ziegler et al. (4). Women of Chinese, Japanese, and Filipino ethnicities with histologically confirmed, first primary incident breast cancer diagnosed between the ages of 20–55 were identified through population-based cancer registries in San Francisco–Oakland, California; Los Angeles County, California; and Oahu, Hawaii for the period April 1, 1983, through June 30, 1987. All three registries are currently members of the SEER program (http://seer.cancer.gov), but the California registries were not members of the SEER program during the accrual period. Control subjects of the same ethnicity, age, and residence were identified through random-digit dialing in the two California areas and through the Hawaii Health Surveillance Program. The final study population consisted of 597 case patients (70% of eligible case patients) and 966 control subjects (75% of eligible control subjects). Eight case patients and 14 control subjects were not included in the analysis because they were missing information in one or more covariates. The estimates of relative and attributable risks were based on data from the 589 case patients and 952 control subjects with complete covariate information on the risk factors in Table 1. Some eligible subjects did not participate in the Asian American Breast Cancer Study because they refused or died [for details, see reference (4)].
Table 1.
Relative risks estimated from the Asian American Breast Cancer Study for all ethnicities combined and relative risks from the NCI Breast Cancer Risk Assessment Tool or Gail model (3)*
| Risk factor (assigned code) | Associated RR (95% CI)† | Gail RR | No. of case patients (n = 589)‡ | No. of control subjects (n = 952)‡ | |
| AGEMEN, y | |||||
| ≥14 (0) | 1.000 (referent) | 1.000 | 201 | 337 | |
| 12–13 (1) | 1.078 (0.920 to 1.263) | 1.099 | 283 | 455 | |
| <12 (2) | 1.162 (0.846 to 1.596) | 1.207 | 105 | 160 | |
| NBIOPS | |||||
| Age <50 y | |||||
| 0 (0) | 1.000 (referent) | 1.000 | 316 | 578 | |
| 1 (1) | 1.738 (1.381 to 2.186) | 1.698 | 46 | 51 | |
| ≥2 (2) | 3.020 (1.908 to 4.781) | 2.882 | 30 | 13 | |
| Age ≥50 y | |||||
| 0 (0) | 1.000 (referent) | 1.000 | 166 | 275 | |
| 1 (1) | 1.738 (1.381 to 2.186) | 1.273 | 22 | 32 | |
| ≥2 (2) | 3.020 (1.908 to 4.781) | 1.620 | 9 | 3 | |
| AGEFLB, y | NUMREL | ||||
| <20 (0) | 0 (0) | 1.000 (referent) | 1.000 | 14 | 49 |
| 1 (1) | 2.207 (1.454 to 3.351) | 2.607 | 1 | 1 | |
| ≥2 (2) | 2.207 (1.454 to 3.351) | 6.798 | 0 | 0 | |
| 20–24 (1) | 0 (0) | 1.318 (1.145 to 1.518) | 1.244 | 116 | 264 |
| 1 (1) | 2.910 (1.876 to 4.514) | 2.681 | 14 | 10 | |
| ≥2 (2) | 2.910 (1.876 to 4.514) | 5.775 | 1 | 0 | |
| 25–29 or nulliparous (2) | 0 (0) | 1.738 (1.310 to 2.306) | 1.548 | 280 | 436 |
| 1 (1) | 3.837 (2.325 to 6.332) | 2.756 | 29 | 23 | |
| ≥2 (2) | 3.837 (2.325 to 6.332) | 4.907 | 2 | 1 | |
| ≥30 (3) | 0 (0) | 2.291 (1.500 to 3.501) | 1.927 | 120 | 160 |
| 1 (1) | 5.058 (2.801 to 9.135) | 2.834 | 10 | 8 | |
| ≥2 (2) | 5.058 (2.801 to 9.135) | 4.169 | 2 | 0 |
AGEFLB = age at first live birth; AGEMEN = age at menarche; CI = confidence interval; NBIOPS = number of biopsies; NCI = National Cancer Institute; NUMREL = number of affected mothers, sisters, and daughters with breast cancer; RR = relative risk.
To obtain the combined relative risk, multiply the Asian American Breast Cancer Study relative risks for AGEMEN, for the appropriate combination of age and NBIOPS and for the appropriate combination of NUMREL and AGEFLB. If it is known that atypical hyperplasia was present on any biopsy, multiply the result by 1.82. If is known that there was no atypical hyperplasia on any biopsy and there was at least one biopsy, multiply the result by 0.93.
These counts reflect case patients and control subjects with complete risk factor data. The data from these case patients and control subjects were used to estimate the log odds ratios in Supplementary Table 2 (available online) and attributable risks.
Age- and ethnicity-specific invasive breast cancer incidence rates for Chinese, Japanese, Filipino, Other Asians (excluding the previous three groups), native Hawaiians, and Other Pacific Islanders (excluding native Hawaiians) were obtained from the SEER Detailed Asian/Pacific Islander Database for the years January 1,1998, through December 31, 2002. We used the US 2000 Census to estimate women-years of exposure over the 5 years of collection of SEER incidence data from 1998 to 2002 (6). We use the term “ethnicity” to denote these six groups, although the terms “Asian” and “Hawaiian or Other Pacific Islander” have been distinguished as different races (http://www.whitehouse.gov/omb/fedreg_directive_15). The database represented three metropolitan areas and nine states (Atlanta, Detroit, Seattle and Puget Sound, California, Connecticut, Hawaii, Iowa, Kentucky, Louisiana, New Jersey, New Mexico, and Utah) and thirteen Asian or Pacific Island groups (Chinese, Japanese, Filipino, Asian Indian or Pakistani combined, Korean, Vietnamese, Laotian, Kampuchean, Guamanian, Samoan, Tongan, and native Hawaiian). These reporting areas covered 54% of the total US Asian and Pacific Islander population and represented 53% of Chinese, 71% of Japanese, and 69% of Filipinos in the United States (6). Ethnicities for incident invasive breast cancer case patients were obtained from medical records by the SEER cancer registries. Because greater than 99.95% of cancer diagnoses in SEER include only one ethnicity designation, the SEER Detailed Asian/Pacific Islander Database used only one ethnicity to classify case patients (7). The corresponding numbers of women at risk (rate denominators) were based on the US 2000 Census, which allowed individuals to report multiple ethnicities. Therefore, incidence rates in the SEER program were calculated using two different methods for determining the number of women at risk. The first method included women who self-reported one ethnicity on the US 2000 Census; the second method included women who self-reported one or more ethnicities, at least one of which was the group of interest. Because the first method results in an overestimate of the true incidence rate and the second method results in an underestimate, we calculated a simple average of the two incidence rates. Unreported calculations indicated that a simple average performs well over a range of (unknown) fractions of women who check multiple ethnicities on a census form but declare themselves to have a specific ethnicity when forced to choose. This procedure was used to calculate rates separately for Chinese, Japanese, Filipino, Other Asians (excluding the previous three groups), native Hawaiians, and Other Pacific Islanders (excluding native Hawaiians). For native Hawaiians, incidence rates in SEER were calculated using only multiple race/ethnicity denominators because a case patient with any native Hawaiian ancestry is classified as native Hawaiian in SEER (6). The resulting age- and ethnicity-specific breast cancer incidence rates are shown in Supplementary Table 1 (available online).
To account for competing risks from non-breast cancer mortality, age- and ethnicity-specific non-breast cancer mortality rates were obtained through SEER from the National Center for Health Statistics (NCHS; http://www.cdc.gov/nchs) for the period January 1, 1998, through December 31, 2002 (6), for Chinese, Japanese, Filipino, Other Asians (excluding the previous three groups), native Hawaiians, and Other Pacific Islanders (excluding native Hawaiians). The database represented seven states (California, Hawaii, Illinois, New Jersey, New York, Texas, and Washington) and nine APA groups (Chinese, Japanese, Filipino, Indian only, Korean, Vietnamese, Guamanian, Samoan, and native Hawaiian). These reporting areas covered 68% of the total US Asian and Pacific Islander population and represented 74% of Chinese, 77% of Japanese, and 79% of Filipinos in the United States (6). Ethnicity for noninvasive breast cancer deaths were obtained from state vital records. Because vital records usually include only a single race or ethnicity designation, the NCHS data used only single race or ethnicity information to classify deaths. We calculated the census numbers at risk as previously described for calculating breast cancer incidence rates and used these denominators to calculate mortality rates as previously described for incidence rates (Supplementary Table 1, available online).
Validation Data
To assess the calibration of the AABCS model, we used independent data on breast cancer incidence from 4031 postmenopausal APA women, aged 50–79 years, who entered the WHI study without a history of breast cancer (5). The women were recruited between October 29, 1993, and December 31, 1998, and followed for an average of 9.1 years to detect incident invasive breast cancer. Invasive breast cancers were diagnosed at ages ranging from 51.1 to 86.1 years.
Resolving Unknown Ethnicity Information in WHI
We imputed the Asian ethnicity for 715 women in the WHI with unknown ethnicity. We used an algorithm developed by the North American Association of Central Cancer Registries (8). The algorithm is based on place of birth, maiden name, surname, or given name in decreasing order of precedence. When place of birth was unavailable, either maiden name, surname, or given name were checked against the corresponding Census name list (9), the Lauderdale name list (10), or the North American Association of Central Cancer Registries (NAACCR) name list (8) in decreasing order of precedence. After the imputation, 109 women were reclassified as Chinese, 357 as Japanese, 87 as Filipino, and 162 remained as “Other APA.”
Statistical Methods
The basic approach is described in Gail et al. (3). First, we developed a multivariable relative risk model from the Asian American Breast Cancer Study data applied to the risk factors in Gail et al. (3). Then, we obtained baseline age-specific breast cancer incidence rates by multiplying age- and ethnicity-specific rates from SEER times one minus the common population attributable risk estimated from the Asian American Breast Cancer Study. Finally, we made absolute risk projections for an APA woman with specific risk factors by multiplying her multivariable relative risk times the baseline age- and ethnicity-specific breast cancer incidence rate and taking age- and ethnicity-specific competing risks into account. Further details follow.
Age at diagnosis was used for case patients. A comparable age was assigned to control subjects as follows. The mean difference between the date of interview and the date of diagnosis was computed for case patients within strata defined by ethnicity, study location, year of birth in 5-year intervals, and age at interview category (above and below the median age of case patients at interview). This mean difference was subtracted from the age at interview of each control woman in that stratum to obtain a comparable age for each control subject.
Initially, ethnicity-specific odds ratios were obtained using logistic regression separately for Chinese, Japanese, and Filipino women in the Asian American Breast Cancer Study with the same independent variables as in Gail et al. (3) (see Table 1) but with age also included as a continuous variable and with dummy variables for location. Adding age squared or including a cubic spline in age had a negligible effect on the log-relative odds for the other risk factors. Because age was included in the model to control for confounding in the estimated effects of the other risk factors, we only present analyses with age as a continuous linear term. The log-relative odds model included main effects in four variables: age at birth of first live child (AGEFLB) coded as 0, 1, 2, or 3 for ages younger than 20, 20–24, 25–29 or nulliparous, or older than 29 years, respectively; number of affected first-degree female relatives (NUMREL) coded as 0 or 1 for zero or more than zero based on mothers’, sisters’, and daughters’ histories of breast cancer, respectively, as of the date of interview; age at menarche (AGEMEN) coded as 0, 1, or 2 for age at menarche 14 years or older, 12–13 years, or younger than 12 years, respectively; and number of benign surgical and needle breast biopsies (NBIOPS), coded as 0, 1, or 2 for zero, one, or more than one biopsy examinations, respectively. To avoid counting the biopsy that led to the diagnosis of breast cancer in a case patient, we excluded biopsies occurring within 3 years of the date of interview, because breast cancer case patients could be ascertained and interviewed up to 3 years after diagnosis. In addition, we excluded any biopsies that occurred at the same age as the breast cancer diagnosis. Unlike previous models (3), there were no interactions between age and NBIOPS or between AGEFLB and NUMREL, and NUMREL was coded as 0 or 1 rather than as 0, 1, or 2 as in previous models.
Formal tests of heterogeneity of the log odds ratio parameters for the four risk factors among the Chinese, Japanese, and Filipino women were not statistically significant. We therefore computed common log odds parameters for the covariates in Table 1 by fitting a logistic regression that included 18 intercepts for the different combinations of ethnicity (3), location (3), and age (<50 and ≥50 years), as well as age as a continuous variable and the variables in Table 1. The values of the log odds corresponding to variables in Table 1 and their estimated variance–covariance matrix are in Supplementary Table 2 (available online).
To compute an attributable risk (AR), that is representative of the entire SEER population of Chinese (C), Japanese (J), and Filipino (F) women, we defined the weight for Chinese women as:
| [1] |
where DC is the number of Chinese breast cancer case patients in SEER for the years 2000–2005, dC is the total Chinese breast cancer case patients with complete covariate data in the Asian American Breast Cancer Study, and other terms are defined similarly for Japanese and Filipino groups. Weights for Japanese and Filipino women are also defined similarly. The factor F(t) = 1 − AR(t) for the combined group of age t is given by a weighted version of the formula by Bruzzi et al. (11) as follows:
| [2] |
where the sums of reciprocal estimated relative risks are over the case patients of age t with complete data in the various subgroups of the Asian American Breast Cancer Study. This formula was applied separately for case patients aged 49 years or younger and for case patients aged 50 years and older. The weights in equations 1 and 2 are proportional to the weights in the Appendix and yield the same results, because the proportionality factor cancels from ratios in the Appendix. Equation 2 also equals the SEER-weighted average of ethnicity-specific estimates of one minus attributable risk:
| [3] |
To compute absolute risks, we used the age- and ethnicity-specific invasive breast cancer incidence rates h*(t) from Supplementary Table 1 (available online) and estimated the baseline hazard as h1(t) = h*(t)F(t). The hazard h2(t) of risks of age- and ethnicity-specific mortality from non-breast cancer causes was obtained from Supplementary Table 1 (available online). Using equation 6 in Gail et al. (3) with 1-year interval widths, we combined the information on h1, h2, and the relative risk (RR) to project individualized absolute risk for various initial and final ages, and combinations of risk factors.
For a combination of risk factors leading to a relative risk (RR) compared with a woman with all risk factors at their lowest risk level, we computed the variance of the estimate RR × F(t), and confidence intervals on it, from the influence function approach of Graubard and Fears (12) (see “Appendix”). Regarding h* and h2 as known quantities, we estimated the variance of the estimated absolute risk by Taylor series expansion in RR × F(t). A logit transformation of the absolute risk was used to obtain symmetric 95% confidence intervals by adding and subtracting 1.96 times the estimated SE of the logit transform. Finally, the inverse logit transform was applied to these symmetric confidence limits to obtain 95% confidence intervals on the absolute risk. A computer program in SAS (13) is available to compute such confidence limits for any combination of initial and final ages and risk factors.
We prepared a graph that gives approximate confidence intervals by generating confidence limits for a wide range of absolute risks corresponding to various choices of risk factors and risk projection intervals for Chinese, Japanese, Filipino, Hawaiians, Other Pacific Islanders, and Other Asian women. We regressed the upper confidence limits calculated from the variance estimates (see “Appendix”) on the absolute risk, ϕ(x), and on ϕ2(x). The points to which the regressions were fitted were chosen to cover a broad range of absolute risks. For each of the 14 starting ages (20, 25, 30, 35, 40, 45, 50, 55, 60, 65, 70, 75, 80, and 85 years), we considered projection intervals of length (5, 10, 15, 20, 25, 30, 35, 40, 45, 50, 55, 60, 65, and 70 years) subject to the constraint that the starting age plus the duration of the projection interval was at most 90 years. This yielded 105 possible age intervals over which projections were to be made. For each such age interval, we computed the absolute risk for each of the 72 possible risk factor combinations, resulting in 105 × 72 = 7560 pairs for each ethnic group. Thus, there were 6 × 7560 = 45 360 estimates of absolute risk and corresponding upper and lower confidence limits. The regressions explained 99.1% of the variation in upper confidence limits and 98.4% of the variation in lower confidence limits. Thus, each locus (see Figure 1) provided a good fit to the calculated confidence limits in these 45 360 scenarios. The coefficients a, b, and c in the regressions a + bϕ(x) + cϕ2(x) were (−0.0053, 1.6270, and −0.4808) for the upper confidence limit and (0.0026, 0.6219, and 0.0038) for the lower confidence limit.
Figure 1.

Upper and lower 95% confidence limits for the estimated absolute risk of invasive breast cancer for Asian and Pacific Islander American women plotted against the projected absolute risk.
To assess the calibration of the AABCS model, we checked it in independent data from APA women in the WHI. We performed separate validation studies to test model calibration for Chinese, Japanese, Filipino, Other Asians (excluding the previous three groups), native Hawaiians, and Other Pacific Islanders (excluding native Hawaiians). For women in various categories, such as Japanese women aged 50−59 years, we computed the probability of developing invasive breast cancer from the AABCS model based on her age at entry, risk factors, and the age that she would attain if she survived to the end of the original WHI follow-up on August 15, 2008. The sum of all such probabilities over women in category i was the expected count, Ei, which we compared with the corresponding observed number of women with incident invasive breast cancer, Oi. In each category, we computed the ratio of such an observed count (O) to the expected count (E) of invasive breast cancers, O / E, and a 95% confidence interval with a lower limit of and an upper limit of . In addition, P values for the goodness-of-fit test were calculated for mutually exclusive and exhaustive categories of the breast cancer risk factors such as age at entry, age at menarche, number of biopsies, age at first live birth, and number of affected first-degree relatives. The P values for the goodness-of-fit tests for these categories were obtained from the χ2 statistic Σ(O − E)2 / E with degrees of freedom equal to the number of categories. For a single category, i, the value (Oi − Ei)2 / Ei was compared with a χ2 distribution with one degree of freedom, and the corresponding P value was two-sided. To summarize results over ethnic subgroups, we added the E and O values for a given exposure category, such as age group 50–59 years or number of biopsies, over the six ethnic subgroups.
The concordance statistic or area under the receiver-operating curve (AUC) is the probability that a randomly selected case patient would have a higher-projected, absolute invasive breast cancer risk than a randomly selected control subject (14). To estimate how much the factors in the AABCS model contributed to discriminatory accuracy for women of a given age, we estimated age-specific concordance statistics in two age intervals (50–59 and ≥60 years) with data from WHI and computed the unweighted average of these age-specific concordance estimates. We used the nonparametric estimator in Wieand et al. (15), which accounts for ties and provides estimates of SEs.
Results
Relative and Attributable Risks
Relative risks and 95% confidence intervals estimated from the logistic model for APA women in the Asian American Breast Cancer Study are shown in Table 1, which also indicates the number of case patients and control subjects in various risk factor categories in the Asian American Breast Cancer Study and the corresponding relative risks from BCRAT (1,3). Multivariable relative risks from Table 1 can be obtained by multiplication of the separate relative risks for AGEMEN, for the combined age and NBIOPS category, and for the combined AGEFLB and NUMREL category. Adjustments for atypical hyperplasia are described in a footnote to Table 1.
The relative risks (Table 1) and log-relative risks (Supplementary Table 2, available online) in the AABCS model are similar to those in BCRAT, which is also known as Gail model 2 (1), for AGEMEN and somewhat larger than in BCRAT for NBIOPS in women aged 50 years and older. The combined relative risks from AGEFLB and NUMREL were smaller in the AABCS model for some combinations and larger for others. For example, a woman younger than 20 years of age at first birth and with two affected first-degree relatives had larger relative risks in BCRAT, whereas a woman older than 29 years of age at first birth and with one affected first-degree relative had larger relative risks in the AABCS model. The conversion factors were F(t) = 0.4752 (95% CI = 0.3255 to 0.6249) for t younger than 50 years and F(t) = 0.5032 (95% CI = 0.3630 to 0.6434) for t being 50 years or older, which are lower than the corresponding values in BCRAT, 0.5788 and 0.5788, and reflect higher attributable risks in the AABCS model.
Individualized Absolute Risk Projections for APA Women
The absolute risks for various initial ages, follow-up durations, and initial relative risks for Chinese American women are shown in Table 2. The absolute risks for Japanese, Filipino, native Hawaiians, Other Pacific Islanders (excluding native Hawaiians), and Other Asian women are shown in Supplementary Tables 3–7 (available online), respectively.
Table 2.
Projected absolute risk (%) of developing breast cancer within 5, 10, 20, or 30 years, by relative risk, initial age, and years of follow-up for Chinese American women*
| Projected absolute risk, % |
|||||
| Relative risk | |||||
| Initial age, y | Years of follow-up | 1 | 2 | 5 | 10 |
| 20 | 5 | 0 | 0 | 0 | 0.01 |
| 10 | 0.01 | 0.02 | 0.06 | 0.12 | |
| 20 | 0.17 | 0.35 | 0.86 | 1.72 | |
| 30 | 0.73 | 1.46 | 3.61 | 7.09 | |
| 30 | 5 | 0.04 | 0.09 | 0.22 | 0.45 |
| 10 | 0.16 | 0.32 | 0.80 | 1.60 | |
| 20 | 0.72 | 1.44 | 3.56 | 6.99 | |
| 30 | 1.55 | 3.08 | 7.52 | 14.47 | |
| 40 | 5 | 0.22 | 0.43 | 1.08 | 2.14 |
| 10 | 0.56 | 1.12 | 2.79 | 5.49 | |
| 20 | 1.4 | 2.77 | 6.79 | 13.11 | |
| 30 | 2.22 | 4.40 | 10.63 | 20.11 | |
| 50 | 5 | 0.36 | 0.71 | 1.77 | 3.5 |
| 10 | 0.84 | 1.68 | 4.14 | 8.12 | |
| 20 | 1.68 | 3.33 | 8.12 | 15.57 | |
| 30 | 2.49 | 4.92 | 11.84 | 22.23 | |
| 60 | 5 | 0.42 | 0.83 | 2.07 | 4.09 |
| 10 | 0.86 | 1.71 | 4.21 | 8.25 | |
| 20 | 1.69 | 3.35 | 8.16 | 15.63 | |
| 70 | 5 | 0.45 | 0.89 | 2.22 | 4.39 |
| 10 | 0.88 | 1.75 | 4.32 | 8.46 | |
The projected absolute risks for Japanese, Filipino, native Hawaiian, Other Pacific Islander, and Other Asian women are shown in Supplementary Tables 3–7 (available online), respectively. Initial age is the age at counseling.
The use of Tables 1 and 2 to make risk projections is best illustrated by example. Suppose one wishes to project invasive breast cancer risk over 30 years for a 30-year-old nulliparous Chinese American woman (AGEFLB = 2) who began menstruating at age 14 (AGEMEN = 0), whose mother but not sister or daughter had breast cancer (NUMREL = 1), and who has had one breast biopsy (NBIOPS = 1). It is unknown whether atypical hyperplasia was present. We obtain the woman’s relative risk by multiplying relative risks corresponding to the factors in Table 1, namely 1.00 (for AGEMEN = 0) × 1.738 (for NB1OPS = 1) × 3.837 (for AGEFLB = 2 and NUMREL = 1) = 6.67. As in Gail et al. (3), we would recommend multiplying by 1.82 if it was known that any biopsy had atypical hyperplasia and by 0.93 if it was known that atypical hyperplasia was absent. The 30-year absolute risk would be 7.52% if the relative risk was 5.0 (Table 2). An approximation can be obtained by linear interpolation as follows: 7.52 + (14.47 − 7.52)(6.67 − 5.00)/(10 − 5) = 9.84%. This result is close to the exact calculation of 9.90%. The expression after the plus sign shown above [(14.47 − 7.52)(6.67 − 5.00)/(10 − 5)] adds 2.32% and corrects for the relative risk of 6.67 instead of 5.00.
Confidence Intervals on Risk Projections
An SAS (13) program provides confidence intervals that take into account random variation in estimates of relative and attributable risks from the Asian American Breast Cancer Study data (see “Appendix”). Approximate 95% confidence intervals can be obtained from Figure 1, which shows loci for upper and lower confidence limits, each plotted against the absolute risk projection. The width of the confidence interval increased with increasing absolute risk. The 95% confidence interval computed by the SAS program for the 30-year projection in the previous example was 6.30%–15.22%. The regressions in Figure 1 yielded the approximate 95% confidence interval, 6.36%–15.27%, in good agreement. For most purposes, Figure 1 yields an adequately accurate confidence interval.
Comparisons with BCRAT
To compare risk projections from the AABCS model with those from BCRAT, we plotted 5-year absolute risks from the AABCS model (ordinate) against those from BCRAT for each of the 108 (= 3 × 3 × 12) possible relative risks in the BCRAT separately for Chinese women aged 35 years, 50 years, and 70 years, shown in Figure 2, A–C, respectively. Analogous analyses for Japanese, Filipino, native Hawaiians, Other Pacific Islanders (excluding native Hawaiians), and Other Asian women are shown in Supplementary Figures 1–5 (available online), respectively.
Figure 2.

Five-year absolute risk projections from the Asian American Breast Cancer Study model (AABCS model) vs the National Cancer Institute’s Breast Cancer Risk Assessment Tool (BCRAT) for Chinese women. The solid triangles below the equiangular line represent risk factor patterns for which BCRAT projects larger absolute risk than the AABCS model, and the solid triangles above this line represent risk factor patterns for which the AABCS model projects larger absolute risk. A) For women aged 35 years. B) For women aged 50 years. C) For women aged 70 years.
For Chinese women aged 35 years (Figure 2, A), estimates of absolute risk from BCRAT exceeded AABCS model estimates in 99 (92%) of 108 risk factor combinations, as indicated by points below the equiangular (45°) line in the figure. Because women aged 35 years usually have small 5-year risks, the differences in absolute risk estimated from the two models were small. For women aged 50 years, BCRAT estimates exceeded AABCS model estimates in 77 (71%) of 108 risk factor combinations (Figure 2, B), and for women aged 70 years, BCRAT estimates exceeded the AABCS model estimates in 103 (95%) of 108 risk factor combinations (Figure 2, C). Thus, BCRAT yielded higher estimates than the AABCS model for most risk patterns in Chinese women. The proportion of risk factor patterns in which BCRAT gave larger projections than the AABCS model depended on age and ethnicity (Table 3; Figure 2; and Supplementary Figures 1–5, available online). For example, BCRAT produced higher projections than the AABCS model in only 48 (44%) of 108 risk factor combinations in 70-year-old Japanese women (Table 3 and Supplementary Figure 1, available online). Thus, for some combinations of risk factors, ages, and ethnicities, the AABCS model projections exceeded those of BCRAT.
Table 3.
Number and percentage of risk factor combinations for which National Cancer Institute’s Breast Cancer Risk Assessment Tool (BCRAT) projected higher absolute breast cancer risk than the Asian American Breast Cancer Study (AABCS) model*
| 108 risk factor combinations for which BCRAT projects higher absolute breast cancer risk than the AABCS model |
||||||
| Age, y | Chinese, No. (%) | Japanese, No. (%) | Filipino, No. (%) | Hawaiian, No. (%) | Other Pacific Islander, No. (%) | Other Asian, No. (%) |
| 35 | 99 (92) | 99 (92) | 99 (92) | 36 (33) | 90 (83) | 102 (94) |
| 50 | 77 (71) | 25 (23) | 41 (38) | 17 (16) | 51 (47) | 81 (75) |
| 70 | 103 (95) | 48 (44) | 83 (77) | 21 (19) | 92 (85) | 108 (100) |
The absolute risk projections are for 5 years and are computed for three initial ages at counseling for each ethnicity.
AABCS Model Validation With Data From the WHI
The calibration of the AABCS model was assessed using data from 4031 APA women who entered the WHI without a history of breast cancer (5). The average time of follow-up of this cohort was 9.1 years (SD = 2.8 years). From the breast cancer risk factor profiles collected at entry, we used the AABCS model to estimate the number of invasive breast cancer case patients that would be expected to occur among the WHI APA cohort members. The results of this assessment are presented in Table 4.
Table 4.
Analysis of observed vs expected numbers of invasive breast cancer among all Asian and Pacific Islander women in the Women’s Health Initiative (WHI) population computed from the Asian American Breast Cancer Study model*
| Variables and risk factor categories | No. of women with follow-up | No. of breast cancers | |||
| O | E | O/E (95% CI) | P† | ||
| All women | 4031 | 141 | 120.3 | 1.17 (0.99 to 1.38) | .06 |
| Age at study entry, y | |||||
| 50–59 | 1416 | 50 | 42.0 | 1.19 (0.90 to 1.57) | |
| 60–69 | 1701 | 66 | 51.7 | 1.28 (1.00 to 1.63) | |
| 70–79 | 914 | 25 | 26.7 | 0.94 (0.63 to 1.39) | .13 |
| Age at menarche, y | |||||
| ≥14 | 1112 | 36 | 28.3 | 1.27 (0.92 to 1.76) | |
| 12–13 | 2085 | 72 | 64.4 | 1.12 (0.89 to 1.41) | |
| ≤11 | 834 | 33 | 27.7 | 1.19 (0.85 to 1.68) | .26 |
| Breast biopsies at study entry | |||||
| None | 3319 | 100 | 82.5 | 1.21 (1.00 to 1.48) | |
| 1 | 524 | 34 | 23.8 | 1.43 (1.02 to 2.00) | |
| ≥2 | 188 | 7 | 14.1 | 0.50 (0.24 to 1.04) | .008 |
| Hormone use | |||||
| None | 1875 | 54 | 52.0 | 1.04 (0.80 to 1.36) | |
| Estrogen only | 983 | 33 | 31.3 | 1.05 (0.75 to 1.48) | |
| Estrogen and progesterone | 1173 | 54 | 37.0 | 1.46 (1.12 to 1.90) | .047 |
| Hysterectomy at study entry | |||||
| No | 2624 | 95 | 77.0 | 1.23 (1.01 to 1.51) | |
| Yes | 1407 | 46 | 43.4 | 1.06 (0.79 to 1.42) | .11 |
| Race or ethnicity | |||||
| Chinese | 822 | 22 | 16.9 | 1.30 (0.86 to 1.98) | |
| Japanese | 2260 | 91 | 85.3 | 1.07 (0.87 to 1.31) | |
| Filipino | 332 | 10 | 8.0 | 1.25 (0.67 to 2.32) | |
| Native Hawaiian | 51 | 2 | 2.4 | 0.84 (0.21 to 3.35) | |
| Other Pacific Islander | 25 | 0 | 0.6 | — | |
| Other Asian | 541 | 16 | 7.2 | 2.24 (1.37 to 3.65) | .03 |
| Quintiles of 5-y Predicted Breast Cancer Risk (%) | |||||
| ≤0.796 | 798 | 18 | 8.8 | 2.04 (1.28 to 3.24) | |
| 0.797–1.157 | 804 | 21 | 15.0 | 1.47 (0.96 to 2.23) | |
| 1.158–1.543 | 813 | 21 | 20.0 | 1.05 (0.68 to 1.61) | |
| 1.544–2.046 | 806 | 32 | 26.2 | 1.18 (0.83 to 1.68) | |
| ≥2.047 | 810 | 49 | 50.2 | 0.98 (0.74 to 1.29) | .02 |
| Age at first live birth, y | |||||
| ≤19 or unknown | 645 | 14 | 11.2 | 1.25 (0.74 to 2.11) | |
| 20–24 | 1144 | 37 | 29.4 | 1.26 (0.91 to 1.74) | |
| 25–29 | 1735 | 64 | 57.9 | 1.10 (0.86 to 1.41) | |
| ≥30 | 507 | 26 | 21.8 | 1.19 (0.81 to 1.75) | .39 |
| First-degree relatives with history of breast cancer at study entry | |||||
| None | 3547 | 118 | 90.8 | 1.30 (1.09 to 1.56) | |
| ≥1 | 484 | 23 | 29.6 | 0.78 (0.52 to 1.17) | .008 |
Expected breast cancer cases in a given category were obtained by summing the projected breast cancer risks for each subject in that category. Each such calculated risk is based on subject age at accrual into the WHI, risk factors, and potential age at the end of follow-up in the WHI. Observed breast cancer cases were the number of subjects in that category who had a breast cancer diagnosis during the follow-up period. — = the confidence interval was not computable with 0 observed events; CI = confidence interval; E = expected breast cancer cases; O = observed breast cancer cases.
A test for goodness-of-fit is obtained by summing (O − E)2 / E over all the categories of a given variable or risk factor. The P value is the chance that a χ2 variable with degrees of freedom equal to the number of categories would equal or exceed the observed sum.
Overall, the AABCS model predicted 120.3 case patients, but 141 were observed (Table 4). This yielded an observed to predicted ratio of O/E = 1.17 (95% CI = 0.99 to 1.38) and a non-statistically significant test (P = .06) of the null hypothesis O/E = 1.0. The model statistically significantly underestimated the risk in women who had taken estrogen and progesterone (P = .005), in women with no family history of breast cancer in first-degree relatives (P = .004), in women in the lowest-predicted quintile of risk (P = .002), and in “Other Asian” women (P = .0009). There was an indication of underestimation of risk for Chinese and Filipino women, which was not statistically significant (P = .21 and .48, respectively). Thus, the AABCS model tended to underestimate the risk moderately in the WHI population.
Estimates of the age-specific concordance statistic from the WHI data were 0.636 (95% CI = 0.554 to 0.718) for women aged 50–59 years and 0.592 (95% CI = 0.529 to 0.655) for women aged 60 years and older. Thus, the average age-specific concordance was 0.614 (95% CI = 0.587 to 0.640).
To compare rates of breast cancer incidence in APA women in the WHI with those expected in the SEER population, we computed the standardized incidence ratio for WHI from the SEER rates in Supplementary Table 1 (available online). Overall, we found a standardized incidence ratio of 1.18 (95% CI = 0.98 to 1.42) among women reporting a single ethnic identity and 1.17 (95% CI = 0.98 to 1.39) among women reporting one or more than one ethnic identities. This standardized incidence ratio range of 1.17–1.18 probably explains why an O/E ratio of 1.17 was found for the AABCS model, which was calibrated to these SEER rates.
Discussion
In this study, we constructed the AABCS model to project individualized, absolute invasive breast cancer risk for APA women. We did this by combining relative and attributable risks from the Asian American Breast Cancer Study case–control data with SEER data on ethnicity- and age-specific breast cancer incidence rates and with data from the National Center of Health Statistics on the ethnicity- and age-specific rates of mortality from non-breast cancer causes. The data in Tables 1 and 2 and Supplementary Tables 3–7 (available online) can be used to estimate such risks over various time intervals for APA women with specified ethnicity, risk factors, and age at counseling. Approximate confidence intervals can be obtained from Figure 1. An SAS (13) program is available to estimate risks and provide 95% confidence intervals. This program can be downloaded from the web site for the Biostatistics Branch, Division of Cancer Epidemiology and Genetics, National Cancer Institute (http://dceg.cancer.gov/bb).
In preliminary analyses, we used the same breast cancer risk factors and coding as in the original model of Gail et al. (3) to estimate relative and attributable risks for APA women in the Asian American Breast Cancer Study, but the final AABCS model was more parsimonious. In particular, interactions between age at first live birth and number of affected first-degree relatives and between age and number of biopsies were omitted, and number of affected first-degree relatives was dichotomized (0 vs 1 or >1). This model fits the Asian American Breast Cancer Study data well and yielded absolute risk estimates with smaller variance than models with the original coding.
Except for changes anticipated from recoding NUMREL, the relative risk estimates for the AABCS model resemble those from BCRAT (Table 1). This may explain why the average age-specific concordance statistic for the AABCS model, 0.614, was similar to that reported for the original Gail model, 0.596 (16).
Our validation study with independent WHI data indicated that the AABCS model tended to underestimate risk in the WHI by about 17% overall, and more so in Chinese, Filipino, and Other Asian populations (Tables 4). However, the WHI breast cancer rates were about 18% higher than predicted from SEER rates, with a standardized incidence ratio of 1.18 (95% CI = 0.98 to 1.42) among women reporting a single ethnic identity. Perhaps, the WHI rates are higher than expected from SEER rates because participants in the WHI were self-selected to have higher than average risk or because screening for breast cancer was more intense in the WHI than in the general population. Because the AABCS model was calibrated to SEER rates and meant to apply to women in the general population, we do not regard underestimation of breast cancer incidence in the WHI overall as a reason to recalibrate the AABCS model. However, certain features of the validation study indicate a need for further efforts to assess the model and consider recalibration, including the fact that the AABCS model statistically significantly underestimates risk in the lowest quintile of predicted risk (Table 4). Two-thirds of the women in the Asian American Breast Cancer Study were younger than 50 years (Table 1), whereas the WHI cohort included postmenopausal women exclusively. Possible differences in the distributions of risk factors by age and differences in the effect sizes of risk factors in pre- and postmenopausal women may explain some of the differences between AABCS model predictions and observations in WHI.
As described previously (1), BCRAT uses data on white women from the Breast Cancer Detection Demonstration Project to estimate relative risks, data on risk factor distributions from a population-based study of white women to estimate attributable risk, SEER breast cancer incidence rates for white women, and national non-breast cancer mortality rates for white women. Although BCRAT uses race-specific data for African American women (2), and ethnicity-specific SEER rates for Hispanic women, BCRAT uses only data for white women in projecting rates for APA women and warns the user that estimates are “uncertain.” In contrast, the AABCS model uses data from Chinese, Japanese, and Filipino women to estimate relative and attributable risks, and SEER rates specific for Chinese, Japanese, Filipino, native Hawaiian, Other Pacific Islanders, and Other Asian American women. Because the choice of SEER rates has an important impact on risk projections and rates in white women exceed those in most Asian American populations, it is not surprising that BCRAT projections tend to exceed AABCS projections in Chinese, Filipino, Other Pacific Islander, and Other Asian populations, but not in native Hawaiians and not in all subgroups defined by combinations of age and ethnicity (Table 3; Figure 2; and Supplementary Figures 1–5, available online). In fact, native Hawaiians have higher SEER rates than white women in the United States, and this disparity cannot be accounted for by differences in the distributions of age at menarche, age at menopause, age at first birth, number of children, weight, use of hormone replacement therapy, or alcohol consumption (17).
The AABCS model has only modest discriminatory accuracy, in line with that of other breast cancer risk-prediction models. There is a need to increase discriminatory accuracy by adding strong risk factors, such as the percent area mammographic density (16). Apart from the need to develop and validate such a model for APA women, the use of such a model would require more expense and effort than obtaining the data on the risk factors in Table 1.
One must be aware of additional limitations of the AABCS model. Confidence intervals are wider for women with large projected risk than for women with small projected risk (Figure 1). For example, a 50-year-old Japanese American woman with two previous benign breast biopsies, whose first child was born at age 30, who had a sister with breast cancer, and who began menstruating at the age of 12 has a projected risk to age 90 years of 59.5% (95% CI = 37.8% to 78.0%). In addition to the large random error in such projections, which is reflected in the wide confidence limits, there is the possibility of bias from misspecification of the model. In particular, few case patients or control subjects had one of the 13 risk factor combinations that yielded the highest risk projections. Thus, there was little power to detect departures from the main effects risk model that we used; in any case, statistical tests for interactions among risk factors did not detect such departures. The age range of participants in the Asian American Breast Cancer Study was 20–55 years. Thus, projections of risk from the AABCS model rely on the assumption that estimated relative and attributable risks from this comparatively young population also apply to older women. The AABCS model, like BCRAT, should be used with caution or avoided for certain special populations. The AABCS model would usually underestimate risk in APA women with a history of invasive breast cancer, ductal carinoma in situ, or lobular carcinoma in situ, and in women known to be carrying breast cancer–causing mutations, such as mutations in the BRCA1 or BRCA2 genes. Likewise, APA women who received substantial doses of radiation to the breast at a young age, as from radiation treatment of Hodgkin lymphoma, are also likely to be at much higher risk than predicted by the AABCS model (18). Based on the WHI validation data, one should be aware that the AABCS model may underestimate risk in APA women with 5-year-predicted risk less than 0.8% (Table 4). Further validation efforts are needed to assess this issue. Finally, the AABCS model is designed for American women, and not, for example, for women in rural China, where rates are lower (19).
Despite these limitations, the AABCS model, unlike BCRAT, is based on ethnicity-specific data for APA women and usually gives smaller estimates of invasive breast cancer risk for APA women than the currently available BCRAT. Although aware of the need for additional validation studies, we recommend the AABCS model for counseling APA women and for designing and determining eligibility for breast cancer prevention trials.
Funding
This work was supported by the Intramural Research Program of the Division of Cancer Epidemiology and Genetics, National Cancer Institute and by Public Health Service (U10-CA069651 and U10-CA069974) to the National Surgical Breast and Bowel Project (J.P.C.). The Women’s Health Initiative program (G.L.A.) is funded by the National Heart, Lung, and Blood Institute, National Institutes of Health, US Department of Health and Human Services through contracts N01WH22110, 24152, 32100-2, 32105-6, 32108-9, 32111-13, 32115, 32118-, 19, 32122, 42107-26, 42129-32, and 44221.
Supplementary Material
Appendix.
Method Used to Calculate Confidence Limits on Absolute Risk Estimates
Let a be the age at the beginning of the risk projection interval and τ be the duration of the risk-projection interval. The absolute risk from ages a to a + τ of an Asian American woman with risk factors X * and ethnicity E (1 for Chinese, 2 for Japanese, and 3 for Filipino) is given by
where I1(t) = 1 for ages t < 50 and I1(t) = 0 otherwise; I2(t) = 1 for t ≥ 50 and I2(t) = 1 otherwise;  where
where  is an estimate of 1 − attributable risk for t < 50;
  where
where  is an estimate of 1 − attributable risk for t ≥ 50;
  is an estimate of the log RR of the Gail covariates excluding any intercepts. Both estimates are obtained from the Asian American case–control dataset;
  is the SEER breast cancer incidences for each ethnicity and h2,E(t) is the competing hazard excluding death from breast cancer for ethnicity E.
We assume that and h2,E(t) are known without error. The variance of the absolute risk πE is obtained from the delta method as, D’ΦD where and Φ is the covariance of (H1, H2). Confidence intervals on πE are obtained by putting symmetric confidence intervals on and transforming back to limits on πE.
Before describing estimation of Φ, we first define weights needed for this calculation. We consider 36 strata that are defined by cross-classifications of case–control status Y (0 for control and 1 for case), age group T (1 for age <50 and 0 for age ≥ 50), ethnicity E (1 for Chinese, 2 for Japanese, and 3 for Filipino), and location L (1 for Hawaii, 2 for San Francisco, and 3 for Los Angeles). The weight for the j th subject in the stratum with case–control status y, age group t, ethnicity e, and location l is denoted by wytelj. For controls, we have w0telj = 1 without regard to their age, ethnicity, or location. We want the proportions of three ethnicity groups among cases to be the same as the respective proportions in cases in SEER for age groups 1 and 2 separately. Let Pte be the number of Asian American women cases in SEER with ethnic group e and age group t; then is the total Asian American women cases in SEER with age group t. Then, for cases we have weights  and nytel is the number of subjects in this stratum. In particular, n1tel is the number of cases with complete risk factor data. The sum of case weights for age group t equals n1t. In our data, P11 = 997, P12 = 546, P13 = 1187, n111. = 105, n112. = 137, and n113. = 150 for women under age 50. Likewise, for women aged older than 50 years, P21 = 1655, P22 =2 344, P23 = 2423, n121. = 57, n122. = 102, and n123. = 38.
We applied the influence function method given by Graubard and Fears (12) to estimate Φ. For women aged younger than 50 years, we have H1 = S1/S2, where
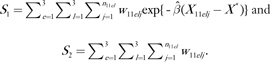 |
In the formula, X11elj is the vector of covariates for the j th subject in the stratum with the location- and ethnicity-specific intercept set to 0. X * is the corresponding covariate (with intercept 0) for a women whose risk is to be projected. By setting X * = 0 in the expression for H1, we obtain , an estimate of the common (1 − attributable risk). Because is based on the data from all cases and controls, every subject makes a contribution to H1 and to the analogous quantity for women aged older than 50 years, namely H2.
The influence of observation j in the stratum with case–control status y, age group t, ethnicity e, and location l on H1 is
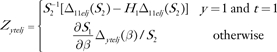 |
where 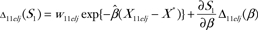 and
and  . In this expression for Pytelj, the intercept term is included in Xytelj. Also
 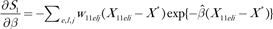 and . Similar influences Cytelj can be calculated for H2. The pairs (Zytelj, Cytelj) for y = 0 or 1; t = 1 or 2; e = 1, 2, or 3; l = 1, 2, or 3; and can be used to find the variances of H1 and H2 and their covariance by summing over stratum-specific variance contributions. For example, the estimated variance of H1 is
where  is the stratum mean. The covariance between H1 and H2 is estimated as
Footnotes
We thank Mary Pettinger for preparing the Women’s Health Initiative (WHI) data and analyzing standardized incidence ratios for WHI data, and Jennifer Boyd-Morin for checking coding and preparing the data analysis files for the Asian American Breast Cancer Study. The authors had full responsibility for the study design, data collection, analysis and interpretation of the data, writing the article, and decision to submit the article for publication.
References
- 1.Costantino JP, Gail MH, Pee D, et al. Validation studies for models projecting the risk of invasive and total breast cancer incidence. J Natl Cancer Inst. 1999;91(18):1541–1548. doi: 10.1093/jnci/91.18.1541. [DOI] [PubMed] [Google Scholar]
- 2.Gail MH, Costantino JP, Pee D, et al. Projecting individualized absolute invasive breast cancer risk in African American women. J Natl Cancer Inst. 2007;99(23):1782–1792. doi: 10.1093/jnci/djm223. [DOI] [PubMed] [Google Scholar]
- 3.Gail MH, Brinton LA, Byar DP, et al. Projecting individualized probabilities of developing breast cancer for white females who are being examined annually. J Natl Cancer Inst. 1989;81(24):1879–1886. doi: 10.1093/jnci/81.24.1879. [DOI] [PubMed] [Google Scholar]
- 4.Ziegler RG, Hoover RN, Pike MC, et al. Migration patterns and breast-cancer risk in Asian-American women. J Natl Cancer Inst. 1993;85(22):1819–1827. doi: 10.1093/jnci/85.22.1819. [DOI] [PubMed] [Google Scholar]
- 5.Chlebowski RT, Chen Z, Anderson GL, et al. Ethnicity and breast cancer: factors influencing differences in incidence and outcome. J Natl Cancer Inst. 2005;97(6):439–448. doi: 10.1093/jnci/dji064. [DOI] [PubMed] [Google Scholar]
- 6.Miller BA, Chu KC, Hankey BF, Ries LAG. Cancer incidence and mortality patterns among specific Asian and Pacific Islander populations in the US. Cancer Causes Control. 2008;19(3):227–256. doi: 10.1007/s10552-007-9088-3. [DOI] [PMC free article] [PubMed] [Google Scholar]
- 7.Johnson CH, editor. SEER Program Coding and Staging Manual, 2004. Bethesda, MD: National Cancer Institute; 2004. pp. 1–224. [Google Scholar]
- 8.NAACCR Race and Ethnicity Work Group. NAACCR Asian Pacific Islander Identification Algorithm [NAPIIA v1.2] Springfield, IL: 2009. North American Association of Central Cancer Registries. [Google Scholar]
- 9.Falkenstein MR. Proceedings of the Survey Research Methods Section. Alexandria, VA: American Statistical Association; 2002. The Asian and Pacific Islander surname list: as developed from Census 2000; pp. 946–950. [Google Scholar]
- 10.Lauderdale DS, Kestenbaum B. Asian American ethnic identification by surname. Popul Res Policy Rev. 2000;19(3):283–300. [Google Scholar]
- 11.Bruzzi P, Green SB, Byar DP, Brinton LA, Schairer C. Estimating the population attributable risk for multiple risk-factors using case-control data. Am J Epidemiol. 1985;122(5):904–913. doi: 10.1093/oxfordjournals.aje.a114174. [DOI] [PubMed] [Google Scholar]
- 12.Graubard BI, Fears TR. Standard errors for attributable risk for simple and complex sample designs. Biometrics. 2005;61(3):847–855. doi: 10.1111/j.1541-0420.2005.00355.x. [DOI] [PubMed] [Google Scholar]
- 13.SAS. SAS 9.2 Software. Cary, NC: SAS Institute Inc.; 2010. [Google Scholar]
- 14.Rockhill B, Spiegelman D, Byrne C, Hunter DJ, Colditz GA. Validation of the Gail et al. model of breast cancer risk prediction and implications for chemoprevention. J Natl Cancer Inst. 2001;93(5):358–366. doi: 10.1093/jnci/93.5.358. [DOI] [PubMed] [Google Scholar]
- 15.Wieand S, Gail MH, James BR, James KL. A family of nonparametric statistics for comparing diagnostic markers with paired or unpaired data. Biometrika. 1989;76(3):585–592. [Google Scholar]
- 16.Chen JB, Pee D, Ayyagari R, et al. Projecting absolute invasive breast cancer risk in white women with a model that includes mammographic density. J Natl Cancer Inst. 2006;98(17):1215–1226. doi: 10.1093/jnci/djj332. [DOI] [PubMed] [Google Scholar]
- 17.Pike MC, Kolonel LN, Henderson BE, et al. Breast cancer in a multiethnic cohort in Hawaii and Los Angeles: risk factor-adjusted incidence in Japanese equals and in Hawaiians exceeds that in whites. Cancer Epidemiol Biomarkers Prev. 2002;11(9):795–800. [PubMed] [Google Scholar]
- 18.Travis LB, Hill D, Dores GM, et al. Cumulative absolute breast cancer risk for young women treated for Hodgkin lymphoma. J Natl Cancer Inst. 2005;97(19):1428–1437. doi: 10.1093/jnci/dji290. [DOI] [PubMed] [Google Scholar]
- 19.Ziegler RG, Anderson WF, Gail MH. Increasing breast cancer incidence in china: the numbers add up. J Natl Cancer Inst. 2008;100(19):1339–1341. doi: 10.1093/jnci/djn330. [DOI] [PubMed] [Google Scholar]
Associated Data
This section collects any data citations, data availability statements, or supplementary materials included in this article.