

Summary
We investigated the biochemical and biophysical properties of one of the four alternative regions within the Drosophila myosin catalytic domain: the relay domain encoded by exon 9. This domain of the myosin head transmits conformational changes in the nucleotide binding pocket to the converter domain, which is crucial to coupling catalytic activity with mechanical movement of the lever arm. To study the function of this region, we used chimeric myosins (IFI-9b and EMB-9a), which were generated by exchange of the exon 9-encoded domains between the native embryonic body wall (EMB) and indirect flight muscle isoforms (IFI). Kinetic measurements show that exchange of the exon 9-encoded region alters the kinetic properties of the myosin S1 head. This is reflected in reduced values for ATP-induced acto-myosin dissociation rate constant (K1k+2) and ADP affinity (KAD), measured for the chimeric constructs IFI-9b and EMB-9a compared to wild-type IFI and EMB. Homology models indicate that, in addition to affecting the communication pathway between the nucleotide binding pocket and the converter domain, exchange of the relay domains between IFI and EMB affects the communication pathway between the nucleotide-binding pocket and the actin-binding site in the lower 50 kDa domain (loop 2). These results suggest an important role of the relay domain in the regulation of acto-myosin cross-bridge kinetics.
Keywords: muscle, myosin, Drosophila, kinetics, nucleotide
Introduction
The myosin superfamily consists of at least 24 classes of ATP-dependent motor proteins that interact with actin filaments and are involved in a large number of physiological processes, such as muscle contraction, phagocytosis, cell motility and vesicle transport.1, 2 All myosins appear to undergo the same ATP driven cycle of interaction of myosin with actin, known as the cross bridge cycle, yet myosins show a wide variety of different mechanical activities. Class II myosins consist of two heavy chains (MHC) and two pairs of light chains: the regulatory light chains (RLC) and essential light chains (ELC). The C-termini of the myosin heavy chains dimerize as a coiled-coil (‘myosin tail’) whereas the N-termini form the two myosin ‘heads’ or ‘motor-domains’. The most familiar activity of class II myosins is muscle contraction.
The various isoforms of Drosophila melanogaster muscle myosin II heavy chain (MHC) are encoded by a single gene (Mhc).3 Alternative RNA splicing produces myosin isoforms with different tissue specificity and functional properties. Of the 19 exons in Mhc, 5 exon sets are alternatively spliced, while exon 18 is either included or excluded. Four of the six alternative exon sets encode portions of the motor domain.4 The domains encoded by exon 3 (amino acid residues 69–116) and exon 9 (472–528) are located near the sulfhydryl helix, a part of the myosin head that is thought to transduce the chemical energy provided by ATP hydrolysis into movement. The exon 7 domain (301–335) is near the ATP-binding pocket. The exon 11 region (724–764) is part of the converter domain, providing a bridge between the long relay helix encoded by exon 9 and the essential light chain (ELC). Exon 11 encodes the lowest degree of conservation among the alternative regions (38 %), followed by exon 7 (56 %), exon 3 (75 %) and exon 9 (89 %).
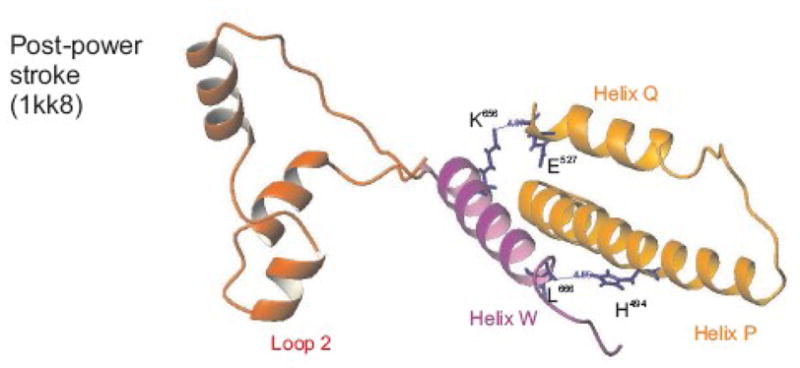
Exon 9 encodes one of the variable regions in the myosin head, whose location is indicated in Figure 1A. This region is also known as the ‘relay helix-loop-helix domain’ or ‘relay domain’ and plays a crucial role in the structural coupling between ATP hydrolysis and the recovery stroke in the myosin motor. The mechanism of this coupling has recently been modeled in detail based on two crystal structures of Dictyostelium myosin II representing the pre-power stroke state and the post-power stroke state.5 It was proposed that before ATP hydrolysis can occur, the switch-2 loop closes in a step-wise fashion. Closure of switch-2 is linked to an initial rotation of the converter domain via a see-saw pivoting of the relay helix (step 1), whereas the second phase of converter rotation is coupled to the final closing of switch-2 via the SH1 and SH2 helices and the wedge loop (step 2). This proposed coupling mechanism is consistent with the many available myosin crystal structures.6, 7
Figure 1. Location and amino acid sequence of the Drosophila exon 9 domain.

(A) Homology model of Drosophila myosin S1, built using the crystal structure of scallop myosin (post-power stroke conformation) as a template (ExPDB:1kk8). The exon 9 region of Drosophila is indicated in yellow (residues 472–528) consisting of the long relay helix P, a loop region and a short helix Q. The location of the nucleotide (space-filling model) is also shown. (B) Primary sequences encoded by exon 9a (IFI) and exon 9b (EMB), * indicates the five variable residues between the exon 9a and 9b regions.
The Drosophila relay domain is encoded by alternative exons 9a, 9b, or 9c.3 Exon 9a encodes the indirect flight muscle isoform (IFI) relay domain, while exon 9b encodes a relay domain found within one of the embryonic body wall isoforms (EMB).8 The amino acid sequences of the two relay domains, encoded by exon 9a (IFI) or exon 9b (EMB), are depicted in Figure 1B and correspond to residues 472–528 of chicken myosin II (or residues 469–525 using Drosophila numbering). For reference purposes we use the chicken numbering throughout this paper. We previously generated chimeric myosins (IFI-9b and EMB-9a) by exchanging relay domains between the two native isoforms.9 This allows for characterization of functional differences ascribed to alternative versions of this domain. Interchanging the two versions of exon 9 resulted in different effects on the indirect flight muscle (IFM) ultrastructure and performance. IFI-9b flies displayed wild-type structure and stability of IFM myofibrils, while EMB-9a flies showed a significant disruption of muscle structure and myofibril stability when compared to EMB flies. Flight and jump ability tests of flies expressing the IFI-9b myosin isoform were near wild-type, while flies expressing the EMB-9a isoform failed to rescue the flightless phenotype and impaired jumping phenotypes observed in flies expressing the EMB isoform. Results from biochemical and mechanical experiments performed on full-length IFI-9b myosin molecules showed that its basal and actin-stimulated ATPase activities, as well as its in vitro actin sliding velocity, are similar to those of IFI.9 In contrast, the EMB-9a myosin isoform shows a reduction of both basal and actin-stimulated ATPase activities compared to EMB, a marked increase in actin affinity, and lacks the ability to translocate actin filaments in vitro.9
This paper describes steady-state and transient kinetics measurements using S1-fragments of the previously generated exon 9 (IFI-9b and EMB-9a) chimeric MHC isoforms to investigate the roles of the alternative relay domains in regulating the acto-myosin cross-bridge cycle. Our results show that several kinetic parameters are affected, including ADP affinity, actin affinity and ATP-induced actomyosin dissociation. These results indicate that the relay domain, encoded by exon 9, affects more than one signal transduction pathway in the Drosophila myosin head. In addition to the expected effects upon the communication pathway between the nucleotide binding pocket and the converter domain, the signal transfer from the nucleotide-binding pocket towards the actin-binding site is altered when exchanging relay domains between IFI and EMB. Homology models of the chimeric myosin S1 molecules suggest a possible mechanism by which exchanging the relay domain can alter the kinetic properties of the myosin head.
Results
Actin-activated Mg2+-ATPase of the S1 fragments of IFI, EMB, IFI-9b, and EMB-9a
A summary of the steady-state properties of the S1 fragments of wild-type and chimeric myosins is shown in Table 1. This represents the first determination of these kinetic parameters for Drosophila myosin S1 ATPase. In agreement with our previous data for full-length wild-type myosins9, 10, basal MgATPase and actin-activated ATPase values (Vmax) were significantly higher for IFI S1 (0.074 ± 0.016 s−1 and 2.47 ± 0.29 s−1, respectively) compared to EMB S1 (0.016 ± 0.002 s−1 and 0.67 ± 0.06 s−1, respectively). There was also a significant difference between Km values for actin with EMB S1 showing a two-fold increase in actin-affinity compared to IFI S1 (Km= 2.54 ± 0.46 μM and 5.38 ± 1.13 μM respectively). For the chimeric myosins, we found that the steady-state kinetic properties of EMB-9a S1 did not differ significantly from that of EMB S1 (Table 1). For IFI-9b S1 however, we found a small, but statistically significant difference in Vmax compared to IFI S1 (Vmax = 3.05 ± 0.37 s−1 for IFI-9b and 2.47 ± 0.29 s−1 for IFI). Overall, the basal Mg2+-ATPase activities of the S1 fragments were 2- fold lower compared to the activities for full-length myosins.9 We assessed whether the 2-fold decrease in basal Mg-ATPase activity seen for S-1 compared to full-length myosin results from the absence of salt in the S-1 assay buffer, but found that eliminating KCl had no appreciable effect upon basal Mg-ATPase activity of full-length IFI (data not shown). In contrast, the Vmax values of the S1 fragments are approximately 2-fold higher than those of the full-length myosins (except for EMB). Further, the Kmvalues of all four S1 fragments are approximately 10–60 fold greater than obtained with the full-length myosins, indicating a significantly weaker apparent affinity for actin for the S1 fragments (Table 1 and Figure 2).
Table 1. Steady-state kinetic parameters measured for the IFI, EMB, and exon 9 chimeric S1 isoforms.
Values are mean ± S.D. based on a minimum of three preparations.
| IFI S1 (n=5) | EMB S1 (n=3) | IFI-9b S1 (n=5) | EMB-9a S1 (n=6) | |
|---|---|---|---|---|
| Basal MgATPase (s−1) | 0.074 ± 0.016a | 0.016 ± 0.002b | 0.077 ± 0.015a | 0.016 ± 0.006b |
| Actin-activated ATPase Vmax (s−1) | 2.47 ± 0.29a | 0.67 ± 0.06b | 3.05 ± 0.37a,b | 1.00 ± 0.50b |
| Km(actin) (μM) | 5.38 ± 1.13a | 2.54 ± 0.46b | 4.59 ± 1.45 | 6.29 ± 3.27 |
p < 0.05 determined by Student’s t-test compared to EMB
p < 0.05 determined by Student’s t-test compared to IFI
Figure 2. Actin-activated ATPase activity of IFI, IFI-9b, EMB, and EMB-9a S1.

Basal MgATPase values were subtracted from actin-activated ATPase data and data points were fit to the Michaelis-Menten equation. (A) Actin-activated ATPase activities of IFI S1 (solid line) and IFI-9b S1 (dashed line) show similar Vmax values (3.02 ± 0.89 s−1 for IFI compared to 4.15 ± 1.37 s−1 for IFI-9b) and Kmfor actin (9.38 ± 5.47 μM for IFI compared to 7.19 ± 3.77 μM for IFI-9b). (B) Actin-activated ATPase activities of EMB S1 (dashed line, extrapolated beyond data points) and EMB-9a S1 (solid line) show that their Vmax values are similar (0.67 ± 0.06 s−1 and 1.00 ± 0.50 s−1, respectively) and that there is no statistical difference between their Kmvalues (2.53 ± 0.46 μM and 6.29 ± 3.27 μM, respectively).
Determination of the ADP-release rate of S1 (k−D) using coumarin-labeled ADP
To estimate the rate constant of ADP dissociation from S1 in the absence of actin, the change in fluorescence of a coumarin-labeled ADP analog (3′-O-{N-[2-(7-diethylaminocoumarin-3-carboxamido)-ethyl]-carbamoyl ADP abbreviated to deac-eda ADP) was measured upon its displacement by ATP-binding to S1.11 Previously it was shown that this coumarin-labeled analog has very similar kinetic properties compared to ADP. When using eda-deac ADP the ADP release rate (k−D) was unchanged for rabbit fast-skeletal myosin S1, the Dictyostelium myosin head fragment (M765–1R) and rat EDL myosin S1.11 A single laser flash released 15–20 μM ATP from 100 μM cATP (caged ATP) and the fluorescence change resulting from ATP-induced displacement of 1.5 μM deac-eda ADP release is depicted in Figure 3 for IFI-9b and EMB-9a myosin S1. The measured fluorescence signal could be fitted to a single exponential, from which the resulting kobs gives the ADP-release rate (k−D). A k−D = 2.0 ± 0.4 s−1 for IFI-9b and k−D = 6.0 ± 0.5 s−1 for EMB-9a were obtained. The k−D rate of IFI-9b is similar to that of EMB whereas EMB-9a has a k−D value close to IFI12 (see Table 2). Control measurements using wild-type myosin S1 (IFI and EMB) confirmed the k−D values reported previously for IFI and EMB. Since the exon 9-encoded region in the myosin head is not very close to the nucleotide binding pocket (Figure 1) the large change in k−D rates for IFI-9b and EMB-9a was quite surprising and indicates a critical role for the relay domain in attenuating the rate of ADP release from S1.
Figure 3. Rate of eda-deac ADP dissociation (k−D) from Drosophila S1 isoforms.

The rate constant for ADP dissociation (k−D) from S1 in the absence of actin was determined. Release of ATP (15 μM) from cagedATP (100 μM) by a single laser flash displaced the eda-deac ADP (1.5 μM) bound to S1 (4 μM). The change in eda-deac ADP fluorescence upon release from S1 was measured and fit with a single exponential to determine k−D. Exchange of either the exon 9a or 9b domain resulted in a modulation of the eda-deac ADP release rate (see Table 2) The dissociation rate for EMB-9a (k−D: 6.0 s−1) is faster than EMB (k−D: 1.8 s−1) while that of IFI-9b (k−D: 2.0 s−1) is slower than IFI (k−D 7.0 s−1).
Table 2. Transient kinetic parameters measured for the exon 9 chimeric S1 isoforms.
Values are mean ± S.D. based on a minimum of 3 preparations. K1k+2 is the second order rate constant for ATP-induced dissociation of acto-S1. KD and KAD are dissociation equilibrium constants determined by division of the dissociation rate constant by the association rate constant (e.g. K3 = k−3/k+3). k−D and k−AD are the ADP dissociation rate constants in the absence and presence of actin, respectively. KAD/KD is the thermodynamic coupling constant describing the relationship between actin and ADP affinities. kcat is the catalytic activity
| IFI† | EMB† | IFI-9b | EMB-9a | |
|---|---|---|---|---|
| K1k+2 (μM−1s−1) | 0.75±0.08d | 0.91±0.13c | 0.40±0.03c,d | 0.52±0.03d |
| KAD (μM) | 409±26d | 587±48c | 155±6c,d | 419±19d |
| k−AD (s−1)a | 4090 | 5870 | 1550 | 4190 |
| k−D (s−1) | 7.5±1.3d | 1.8±0.3c | 2.0±0.4c | 6.0±0.5c,d |
| KD (μM)b | 7.5 | 1.8 | 2.0 | 6.0 |
| KAD/KD | 54.5 | 326 | 77.5 | 69.8 |
| kcat (s−1) | 0.170±0.006d | 0.028±0.006c | 0.163±0.007d | 0.097±0.002c,d |
Data are estimated from KAD assuming an association rate constant of 107 M−1 s−1.
Data are estimated from k−D assuming an association rate constant of 106 M−1 s−1.
Data are from ref. 12, except kcat
p < 0.05 determined by Student’s t-test as compared to IFI
p < 0.05 determined by Student’s t-test as compared to EMB
Determination of the ATP-induced dissociation of acto-S1 (K1k+2)
The ATP-induced dissociation of the acto-S1 complex was measured as described previously13 using the flash photolysis method. After mixing actin and S1, the sample was subjected to a series of laser flashes with variable intensities releasing different amounts of ATP from caged ATP. The changes in light scattering (Figure 4A/B) could be fitted to a single exponential. Plotting the observed rate constant kobs versus ATP concentration allows the apparent second-order rate constant K1k+2 to be determined from the slope of the graph. The results for the two exon 9 chimeras together with the IFI and EMB wild-type S1 are depicted in Figure 4C. For IFI-9b and EMB-9a the K1k+2 value is reduced about 2-fold (K1k+2 = 0.35 ± 0.05 μM−1s−1 and 0.52 ± 0.03 μM−1s−1 respectively) compared to wild-type IFI (K1k+2 = 0.75 ± 0.05 μM−1s−1) and wild-type EMB (K1k+2 = 0.91 ± 0.05 μM−1s−1) (Table 2).
Figure 4. Kinetic determination of the ATP-induced dissociation rate (K1k+2) of the S1 isoforms from actin.

Light scattering transients monitoring dissociation of the acto-S1 complex of IFI-9b (A) and EMB-9a (B) after release of various ATP concentrations. Each transient was fitted to a single exponential in order to determine the corresponding kobs. (C) The second order rate constant (K1k+2) for the dissociation of S1 from actin is determined from a linear fit to the plot of the kobs vs. [ATP]. The linear fits yielded values of 0.40 ± 0.03 μM−1 s−1 for IFI-9b (●) as compared to 0.75 ± 0.08 μM−1 s−1 for IFI (○). For EMB-9a the linear fits yielded mean values of 0.52 ± 0.03 μM−1 s−1 (■) as compared to 0.91 ± 0.13 μM−1 s−1 for EMB S1 (□).
Determination of the ADP-affinity of acto-S1 (KAD)
The ADP-affinity for S1 in the presence of actin, described by the equilibrium dissociation constant KAD, was determined using established methods.12 The ATP-induced dissociation of acto-S1 was measured in the presence of increasing amounts of ADP. Plotting kobs versus ADP-concentration allows KAD to be determined. The measured values of KAD for IFI-9b and EMB-9a are reduced compared to the wild-type values (see Figure 5 and Table 2). The KAD of IFI-9b (KAD = 155 μM) is more than 2-fold lower compared to IFI (KAD = 409 μM), whereas the KAD value for EMB-9a was reduced to 419 μM, compared to KAD = 587 μM measured previously for EMB. Thus exchange of the exon 9 encoded region between IFI and EMB increases the ADP affinity of acto-S1 for both chimeras.
Figure 5. The affinity of ADP (KAD) for acto-S1.

The dissociation of 1 μM acto-S1 was induced by ATP as described for Fig 4 in the presence of ADP (0–1200 μM). The light scattering traces were fitted with single exponentials to determine the kobs (not shown). Hyperbolic plots of the kobs vs. ADP concentration were fitted with an equation derived from Scheme 1 (kobs = K1k+2([ATP]/(1 + [ADP]/KAD)) to determine KAD. Shown are the relative kobs (krel) vs. ADP concentration plots for easier comparison. (A) For IFI-9b the fits yielded a value of 155 ± 6 μM (●) as compared to 409 ± 26 μM for IFI (○). (B) For EMB-9a the fits yielded values of 419 ± 19 μM (□) for EMB-9a as compared to 587 ± 48 μM for EMB (■).
Actin-S1 dissociation by ATP and subsequent re-association: kcat
S1 (1 μM) and actin (1 μM) were incubated with caged ATP. After release of ATP by a single laser flash, the light scattering signal (resulting from the dissociation reaction) could be fitted to a single exponential (kobs). Analysis of the complete reaction profile including re-association gives information on the rate of the ATP-induced dissociation and the time taken to hydrolyze all the released ATP.13 Figure 6 shows that the kcat values for IFI-9b and EMB-9a were kcat = 0.163 s−1 and kcat = 0.095 s−1 respectively. The kcat for EMB (kcat = 0.028 s−1) is lower than the kcat value reported previously for fast vertebrate skeletal muscle S1 using the same experimental setup (kcat = 0.11 s−1), whereas the kcat for IFI is higher (kcat = 0.172 s−1).13 For IFI-9b the measured value for kcat (0.163 s−1) is not statistically different from IFI. The kcat for EMB-9b (kcat=0.095 s−1) is significantly higher compared to EMB (Figure 6 and Table 2).
Figure 6. The turnover number (kcat) for acto-S1.

Light scattering transients monitoring dissociation of the acto-S1 complex and subsequent re-association were measured using varying amounts of ATP. The time taken to hydrolyze all of the ATP (tcat) was estimated from the time at which the dissociation reaction was 50% complete (tdiss) to the time for 50% recovery of light scattering (tass). This time period (tcat) was linearly dependent upon the amount of released ATP as shown here. The steady-state rate of ATP hydrolysis can be determined from the inverse of the slope (steady-state rate = [ATP]/tcat) allowing one to determine the catalytic activity (kcat). The catalytic activity of IFI-9b (kcat = 0.163 s−1) (●) is not different compared to IFI (0.172 s−1) (○) whereas kcat of EMB-9a (0.095 s−1) (■) has increased compared to EMB (0.028 s−1) (□).
Homology Models: General Description of the exon 9 area
Homology models of the two wild-type myosin S1 isoforms (IFI and EMB) and the two chimeras (IFI-9b and EMB-9a) were built in order to understand the results described above at the molecular level. The various states of the myosin head during the cross-bridge cycle are represented by several crystal structures of scallop myosin and these were chosen as templates to generate 3D homology models of the IFI and EMB and the chimeras. In the exon 9-encoded area, the rmsd of the myosin backbone between IFI and EMB was < 0.07 Å and followed the same topology for both isoforms. For descriptive purposes, we use the same nomenclature for secondary structure elements as described previously.14 As depicted in Figure 7A a long helix (helix P: residue 475–505) at the N-terminus of the exon 9 region is followed by a loop (506–516) and then a short helix (helix Q: 517–527). The long helix P contains three residues that are variable between exon 9a and exon 9b: residue 494, which is in the middle of this long helix and can be Ile (exon 9a) or His (exon 9b), residue 498 which is positioned one helix turn further from residue 494 (thus is on the same side of the helix as residue 494) can be Met or Leu, and residue 505, located at the C-terminus of helix P, can be a Lys or Arg. The loop between helix P and Q contains the other variable residues (Asn/Asp509 and Asp/Ala511). The short helix Q at the C-terminal end of exon 9 is identical in the two isoforms.
Figure 7. Primary and secondary structure of the exon 9 encoded region in the myosin head.

(A) The secondary structure of the exon 9 encoded region is shown with helix P (containing 3 variable residues), a loop region with 2 variable residues and helix Q. The side chains of the residues that vary between exon 9a and 9b regions are indicated (the IFI form is depicted). (B) Sequence alignment of various myosins showing exon 9 encoded regions. “*” indicates that the residues are identical in all sequences in the alignment. “:” represents conserved substitutions, whereas “.” indicates semi-conserved substitutions. The corresponding human β-myosin cardiomyopathy sites in the exon 9 encoded domains are indicated with a ▲.
Exon 9 area: highly conserved interactions
Sequence alignments show that the exon 9 encoded region is a highly conserved area of the myosin head (Figure 7B). About 50% of the residues in helix P (residue: 475–505) are totally conserved, whereas the residues in the loop and helix Q are more variable. Analysis of many myosin crystal structures 7,15 and modeling work by Fisher et al5 have indicated that the relay domain plays a crucial role in the structural coupling between ATP hydrolysis and the recovery stroke in the myosin motor. Closure of switch-2, located in the nucleotide binding pocket, is linked to an initial rotation of the converter domain via a see-saw pivoting of the relay helix.5 Subsequently the second phase of converter rotation is coupled to the final closing of switch-2 via the SH1 and SH2 helices (residues 691–716) and the wedge loop (His583Ile584Ala585). Our homology models show that Drosophila myosin residues Gln477, Asn481 and Asn484, all located at the N-terminus of helix P, form hydrogen bonds with switch-2 residues Glu468, Ala465 and Gly466 (not shown). The contacts between switch-2 and the N-terminal part of helix P are maintained throughout the cross-bridge cycle, since they can be seen in all homology models that were built using different scallop structures as templates. These contacts allow the relay helix to follow the movements of switch-2 in a see-saw like fashion, in accordance with the model of Fisher et al for Dictyostelium myosin II.16 The highly conserved residues Phe490 and Phe491 form the fulcrum point, anchoring the relay helix P to the 3rd strand of the central β-sheet via residue Phe673, also in agreement with the Fisher model for Dictyostelium myosin II. The second stage of converter rotation, coupled to the final closing of switch-2 via the SH helices and the wedge loop involves other highly conserved exon 9 region residues. Contacts with the wedge loop involve exon 9 region residues Glu485, Gln488 and Cys522 whereas contacts towards the SH1 and SH2 helices involve the conserved residues Gln488, Asn492, Glu499, Glu502, Tyr503, Asp514 and Asp518. None of the five variable residues encoded by exon 9a/b is involved in direct contacts with either switch-2, the wedge loop or the SH1 and SH2 relay helices, indicating these switch interactions are a conserved feature of both isoforms.
Exon 9 area: non-conserved interactions
Inspection of the exon 9-encoded domain in the homology models reveals close interactions between this domain and the region encoded by alternative exon 11, a variable portion of the myosin head of Drosophila that is located in the converter domain. These interactions are summarized in Figure 8. Comparison of IFI and EMB shows that certain contacts between the relay domain and the converter domain are conserved for both isoforms, such as salt-bridges from Glu502 towards Lys764 and Glu506 towards Lys764and Thr763. However, the two variable residues 509 and 511 are also involved in contacts towards the converter domain. For IFI the side chains of Asn509 and Asp511 make contacts towards the side chain of residue Arg759, whereas EMB only has Asp509 that can form a salt bridge towards Arg759 (since EMB residue 511 is an Ala). One variable residue encoded by exon 11 (Asn762) is also involved in contacts with the EMB exon 9 region whereas this contact is missing for IFI. Figure 8 also shows that the interactions between the relay area (encoded by exon 9) and the converter domain (encoded by exon 11) not only depend on the particular myosin isoform but also on the conformational state of the myosin head. The two variable residues 509 and 511 are not always in contact with residue Arg759 in the converter domain. For instance, contacts between Asp511 and Arg759 are only seen for IFI in the post-power stroke conformation, suggesting their formation and breaking are part of the cross-bridge cycle (Figure S1). Homology models of EMB-9a show that this chimeric molecule is able to form a salt-bridge between Arg759 and Asp511 in the near-rigor state (Figure 8). This interaction is not seen for EMB, which has Ala511, and this additional contact may contribute to the lack of motility observed for the chimeric EMB-9a isoform (see also Discussion).
Figure 8. Interaction of the exon 9 encoded domain with the converter region.

Summary of the contact points between the relay area (encoded by exon 9) and the converter domain (encoded by exon 11) for the wild-type and chimeric constructs using homology models. Black is used for the wild-type and red for the chimeric constructs. Short thick lines represent close contacts (within 1.8 – 4.5 Å), whereas dashed lines indicate weaker contacts (within 4.5 – 5 Å). The total number of contacts between the two variable domains is indicated for each conformation. Note the extra contact for EMB-9a between residue 511 and Arg759 in the near-rigor states, which may be responsible for the lack of in vitro actin motility observed for this mutant.
Residue 505, either an Arg or Lys, is located at the C-terminus of the relay helix. This residue is involved in an intra-helical salt-bridge towards Glu501 and Glu502 (Figure 9) when myosin is in the pre-power stroke state, i.e. when using ExPDB 1qvi as template to build the model. For the other three states, this intra-helical salt-bridge is absent, suggesting its formation 11 and deformation are part of the cross-bridge cycle. Intra-helical salt-bridges are a stabilizing factor of monomeric α-helices and can vary in strength. Because Arg is able to form two charged hydrogen bonds to the carboxyl group of Glu whereas Lys can form only one, thermophylic enzymes prefer Arg residues over Lys in order to enhance the stability of the protein.17 This may be the reason that the slower isoform EMB has Arg in its intra-helical salt-bridge whereas the faster IFI isoform is using Lys. Looking at the alignments of various myosins (Figure 7B) it appears that, except for EMB, the fast IFI and all other skeletal myosin II isoforms have a Lys at this position. The slow EMB is more akin to the slower myosin forms, such as smooth myosins and Dictyostelium myosin IE which all have an Arg instead. The Glu501 residue is completely conserved; indicating this intra-helical salt-bridge in the myosin relay helix is a universal feature.
Figure 9. An intrahelical salt-bridge stabilizes the pre-power stroke conformation.

Comparison of exon 9a and exon 9b encoded regions in the pre-power stroke state shows the presence of an intra-helical salt-bridge, involving residues Glu501, Glu502 and residue 505 which can be either Arg (EMB) or Lys (IFI). This salt-bridge is not present in any of the other states (1sr6, 1kk8, 1s5g) indicating its formation and deformation are part of the cross-bridge cycle.
Residue 494, which can be either Ile or His, is located about halfway along the relay helix (Figure 7A). The position of this residue is of interest because it is next to Met495, the residue postulated to be involved in the local unwinding of the relay helix during the cross-bridge cycle.16 Residue 494 is also close to the fulcrum point (Phe490, Phe491 and Phe673) which anchors the relay helix to the third strand of the central β-sheet and its presence may reinforce the anchoring point. Inspection of the homology models (Figure 10) shows that EMB residue His494 14 is able to make a hydrogen bond from the imidazole ring (H-donor) towards the carbonyl of residue Leu666. This residue is located at the C-terminus of helix W and 100% conserved. Helix W is located immediately after loop 2, also known as the actin-binding loop and may be part of the communication pathway between the relay domain (encoded by exon 9) and the actin-binding site in the lower 50 kDa domain of the myosin head (see Figure 10 + Figure S2 and Discussion). IFI has an Ile residue at position 494 and is not able to make this contact towards helix W.
Figure 10. Helix W is part of the signaling pathway between the exon 9 encoded region and the actin-binding loop 2 in the lower 50 kDa domain.
In the pre-power stroke state (1qvi) exon 9 encoded residue Glu527 (helix Q) interacts with helix W residues Asn660 and residue Lys656, whereas in the post-power stroke state (1kk8, shown here) the interaction between Glu527 and Lys656 remains but the contact between the exon 9 region and Asn660 is lost. In the near-rigor state the side chain of residue Glu527 is not in contact with helix W but forms a salt-bridge with exon 9 encoded residue Lys486. The relay domain in EMB and IFI-9b (encoded by exon 9b) has an additional contact from His491 towards helix W residue Leu666, but this is only seen in the post-power stroke state (1kk8). See supplementary materials Figure S2 for all three states.
Discussion
In this report, we utilized S1 fragments of wild-type (IFI and EMB) and chimeric (IFI-9b and EMB-9a) myosins to continue our analysis of the contribution of alternative exons encoding the Drosophila myosin head to myosin isoform functional differences. This study focused on the structure and function of alternative relay domains encoded by exon 9. We determined the steady-state kinetic parameters of the actin-activated ATPase activities and examined the transient kinetics of the cross-bridge cycle for each of these molecules. Transient kinetics data showed significant changes due to relay domain switching. Homology modeling permitted us to predict how isoform specific amino acid residues affect the structural and functional properties of the chimeric molecules. Our studies indicate that the relay domain serves a central role in communicating between the nucleotide-binding pocket and both the converter domain and the actin-binding site.
Ours are the first reported steady-state ATPase data for Drosophila myosin S1. The data show that basal ATPase rates are much higher for the IFI S1 than for EMB S1. This is similar to the actin activated ATPase where both the Vmax and Kmvalues were ~4 fold higher for IFI S1 compared to EMB S1. The switching of exon 9a and 9b made no dramatic difference to the values for either basal or actin-activated ATPases, indicating that the rate-limiting step does not change after exon 9a and 9b are switched. Note that the values for EMB-9a S1 were quite variable compared to EMB S1, necessitating the preparation of numerous samples. This may be related to the early myofibril defects seen in the EMB-9a line9, which might affect the stability of myofibrillar proteins. Overall, however, it appears that the steady-state parameters of S1 are not dramatically affected by the relay area switches.
In contrast to full-length myosin, measurements of actin-activated ATPase activity of Drosophila S1 required the absence of KCl, since actin-activation was undetectable in the presence of low (20 mM) KCl concentrations (data not shown). This presumably reflects the relatively low affinity of Drosophila S1 for actin in the presence of ATP. Indeed, the apparent affinity for actin (Km) of all four Drosophila myosin S1 fragments is more than ten times larger compared to full-length myosins. Reduced actin affinity and increased Kmfor actin has been reported for S1 of other species and may well reflect the higher affinity of the doubled-headed myosin for actin.18 Direct comparison of the S1 and myosin basal ATPase and Vmax values is difficult because of the different assay conditions but the relative values are in general comparable. The basal MgATPase values for all four Drosophila S1 fragments were 2-fold lower than those of the full-length myosins, and this difference is not attributable to differences in salt concentration (data not shown). The Vmax values of the IFI S1 isoforms were ~ 2 fold higher than full-length while those of the EMB S1constructs were similar to myosin.
In contrast to the steady-state ATPase results, the transient kinetics data revealed significant alterations in various kinetic properties of the myosin head after exchange of the exon-9 encoded region. Binding of ATP to the myosin head is known to induce conformational changes in the nucleotide binding pocket involving the highly conserved switch-1 and switch-2 loops. The general consensus is that switch-1 is involved in the transmission of information between the nucleotide- and actin-binding regions whereas switch-2 plays a role in communicating changes in the nucleotide-binding pocket to the converter domain via the relay domain encoded by exon 9. Our results indicate that the Drosophila myosin relay domain can also influence the communication pathway between the nucleotide binding pocket and the actin-binding site. Exchange of the relay domain between IFI and EMB results in a 2-fold reduction of the ATP-induced dissociation rate of acto-S1 (K1k+2) for the two chimeras and also alters the affinity of acto-S1 for ADP (smaller KAD value) compared to the wild-type. Both results indicate a less efficient communication pathway between the nucleotide-binding pocket and the actin-binding site in the chimeras. ATP-binding induces closure of the nucleotide-binding pocket and subsequent opening of the actin-binding cleft, releasing actin from myosin. This process is slower after exchange of the exon 9 encoded domain, as is reflected in the reduced K1k+2 values of the chimeras. Upon binding of actin to myosin-ADP the actin-binding cleft closes and the nucleotide-binding pocket opens, allowing ADP release. This process is also slower for the chimeras since their KAD values are reduced, indicating an increase in ADP affinity and slower ADP release.
The ratio KAD/KD (Table 2) is termed the thermodynamic coupling constant and this parameter describes the effect of actin on ADP affinity of myosin (KAD/KD) A strong coupling constant (~50) is found in fast myosins, indicating that the presence of actin significantly weakens ADP affinity and vice versa. The coupling constant for IFI-9b S1 (78) and EMB-9a S1 (70) suggests that these isoforms are more similar to IFI (55) than to EMB (326). For IFI-9b S1, both KAD and KD parameters are reduced compared to the wild-type IFI, so that the KAD/KD ratio is similar to that of IFI S1. Exchanging the exon 9a encoded region in EMB results in a shift of both KD and KAD towards the IFI S1 values, thus reducing the coupling constant to IFI S1 levels.
The homology modeling indicates that exchange of the region encoded by exon 9 in the myosin head of Drosophila between IFI and EMB could affect the communication pathway between the nucleotide binding pocket and the converter domain. Certain contacts between exon 9 and exon 11 regions are conserved for both isoforms (Figure 8), in agreement with earlier observations which showed that the myosin relay domain and the converter domain remain in contact throughout the acto-myosin ATPase cycle.19 However, the homology models suggest that other contacts between the regions encoded by exon 9 and exon 11 are variable between the two isoforms, and may be altered, depending on the state of the myosin head (Figure 8). This is true in particular for the two residues 509 and 511, which are different in IFI and EMB and could serve to fine-tune the kinetic and mechano-chemical properties of the myosin head. Exchange of the EMB residues Asp509 and Ala511 for the IFI residues Asn509 and Asp511 may alter the interface between the exon 9 and exon 11 regions and might even be responsible for the lack of motility observed for the EMB-9a mutant.9 Introducing additional interactions between the relay and converter domain in the near-rigor conformation for EMB-9a may weaken the formation of the pre-power stroke conformation, in particular when using an intra-helical salt-bridge which contributes less electrostatic energy to the pre-power stroke conformation compared to EMB (using Lys505 versus Arg505 respectively). The lack of in vitro motility observed with the EMB-9a isoform, however, is overcome in fibers where maximum power generation (Pmax) and optimal frequency of power generation (fmax) increased 2.5-fold and 1.4-fold compared to EMB fibers.20 This may be due to an enhanced sensitivity to oscillatory load for the IFI relay domain. The models suggest that replacement of the IFI residues Asn509 and Asp511 with the EMB residues Asp509 and Ala511 results in weaker interactions between the relay and converter domains for IFI-9b compared to IFI. This could be responsible for decreasing Pmax and fmax to 70% and 83% of IFI fiber values.20
Exchanging the region encoded by exon 11 between IFI and EMB is also expected to affect the interface between the relay domain and converter domain but should leave the intra-helical salt-bridge in helix P unaltered. It was previously reported that exchange of the exon 11-encoded region between IFI and EMB does alter the mechano-chemical properties of these chimeric isoforms. IFI-EC (IFI containing the embryonic converter domain (EC)) yielded a decrease in actin sliding velocity (2.7 μm·s−1) compared to IFI (6.4 μm·s−1) whereas EMB-IC (EMB containing the converter domain from the indirect flight muscle isoform) showed an increase in actin sliding velocity compared to EMB (5.4 μm·s−1 versus 0.7 μm·s−1 respectively).21 Transient kinetic data for these chimeras showed that the embryonic converter domain in an IFI background has a larger effect on the kinetic properties of the myosin head than the IFI converter in the EMB background.12 Although EMB-IC and IFI-9b chimeras share the same relay and converter domain sequences (encoded by exon 9b and IC), as is also true for IFI-EC and EMB-9a which share the regions encoded by exon 9a and EC, their mechano-chemical properties are not identical. This is likely due to the involvement of the other two variable domains in the myosin head encoded by exons 3 and 7.
However, one kinetic parameter that is identical between EMB-IC and IFI-9b chimeras is the ADP release rate in the absence of actin: k−D. Taking into account previous results12 where exon 11 is exchanged between IFI and EMB (IFI-EC and EMB-IC), one can summarize the results for k−D as shown in Table 3. From this table one can conclude that, without actin present, the constructs that express exon 9a have fast ADP release rates (k−D = 6–8 s−1), and the myosin constructs expressing exon 9b have slow ADP release (k−D = 1.7– 2 s−1). This is independent of exon 11, suggesting that the effect of exon 9 swapping on k−D is unlikely to be due to the variable exon 9 encoded residues 509 and 511, located at the interface with exon 11. Our hypothesis is that for these Drosophila myosins it is exon 9 encoded residue 505 (R/K), involved in the intra-helical salt-bridge in the long relay helix P, that is responsible for the k−D rate. All constructs with a R505 display a slow k−D whereas all constructs with a K505 are considerably faster.
Table 3. Summary of the ADP release rate k−D as a function of chimeric exon 9 and exon 11 isoforms.
Note that values for IFI-EC and EMB-IC are from Miller et al (2003).
| Exon 9 | Exon 11 | k−D (s−1) | |
|---|---|---|---|
| IFI | 9a | 11e | 7.5 |
| IFI-EC | 9a | 11c | 8.4 |
| EMB-9a | 9a | 11c | 6.0 |
| EMB | 9b | 11c | 1.8 |
| EMB-IC | 9b | 11e | 1.7 |
| IFI-9b | 9b | 11e | 2.0 |
Apart from affecting the communication pathway between the nucleotide binding pocket and the converter domain, as suggested by the homology models, exchange of exon 9 encoded regions between IFI and EMB also affects the communication pathway from the nucleotide-binding pocket towards the actin-binding site. This is reflected in the reduced values for K1k+2 and KAD, measured for the chimeric constructs IFI-9b and EMB-9a compared to IFI and EMB. The homology models indicate a role for helix W (650–667) in this communication pathway. This helix immediately follows loop 2, which is a well-known actin-binding loop and is located in the lower 50 kDa domain.22 Helix W is also close to the N-terminus of the long relay helix P and the C-terminal part of the short helix Q, both of which are part of the region encoded by exon 9 (see Figure 10 and S2). In the pre-power stroke state exon 9 encoded residue Glu527 (helix Q) interacts with helix W residues Asn660 and residue Lys656, whereas in the post-power stroke state the interaction between Glu527 and Lys656 remains but the contact between exon 9 encoded residues and Asn660 is lost. In the near-rigor state the side chain of residue Glu527 is not in contact with helix W but forms a salt-bridge with exon 9 encoded residue Lys486 (Figure S2). Thus, helix W is in an excellent position to communicate changes from the actin binding site towards the relay domain and vice versa, as was proposed previously for α5, a helix W equivalent in kinesin.23 The region encoded by exon 9b, present in EMB and IFI-9b, has an additional contact from His494 towards helix W residue Leu666, but this is only seen in the post-power stroke state and is absent in the other three states. Sequence alignments show that residue His494 is variable among the myosins (Figure 7B). Myosin II and V family members have a His residue, smooth muscle myosins have a Thr and myosin VI has an Arg residue at this position. Crystal structures of myosin VI showed that this Arg residue (R487) is able to form hydrogen bonds towards helix W residues Ser660, Thr661 and Ala663 in both the nucleotide-free state and in the pre-power stroke state (ExPDB: 2BKH and 2V26 respectively).24, 25
Biological Implications
The exon 9 domain in human β-myosin heavy chain contains several sites that, when mutated, result in hypertrophic cardiomyopathy. Mutations have been reported for Asn479/Ser,26 Glu483/Lys26,27, Met493/Leu/Lys28, Glu497/Asp,29 Glu499/Lys,30 Glu500/Ala,31, Tyr501/His/Cys28, Ile511/Phe,32 Ile511/Thr,33 Phe513/Cys,34 Met515/Arg,33 and Leu517/Met,35 (the equivalent exon 9 encoded residues in Drosophila are indicated in Figure 7B with ▴). Based on the homology models Asn479/Ser is expected to alter the interaction between helix P and switch 2, whereas Glu483/Lys is likely to affect the contacts with the wedge loop. Various cardiomyopathy mutations will influence contacts from the exon 9 encoded domain towards the SH1 and SH2 helices (Glu497/Asp and Tyr501/His/Cys) and towards the converter domain (Glu500/Ala). Mutating the residues involved in the intra-helical salt-bridge of helix P also can cause HCM (Glu499/Lys and Glu500/Ala) as can mutating the residue thought to be involved in the local unwinding of helix P (Met493/Leu/Lys). HCM mutations have also been reported for helix W residues Arg652/Gly, Met659/Ile and Arg663/Ser/Cys/His. Based upon our kinetic measurements and molecular modeling, we propose that these mutations alter myosin function by disrupting the relay pathway between the nucleotide binding pocket and the actin-binding site in the lower 50 kDa domain.
Materials and Methods
Generation of subfragment-1 (S1) from isolated full-length myosin
Myosin was isolated from the IFM of 170–250 wild-type or transgenic flies (those expressing the IFI, EMB, EMB-9a or IFI-9b myosin isoforms in the IFM) as previously described.36 The production of S1 by α-chymotrypsin digestion was carried out using a method based on Silva et al.37 with the following modifications: The final myosin pellets obtained after centrifugation of a myosin solution in low salt buffer were dissolved in 20 μl of high-salt digest buffer (480 mM NaCl, 20 mM Na2PO4, pH 7.0, 1 mM EDTA, and 20 mM DTT). The myosin solution was then diluted with 60 μl of 0 salt digest buffer (20 mM Na2PO4, pH 7.0, 1 mM EDTA, and 20 mM DTT) to reduce the NaCl concentration to 120 mM. The myosin solution was placed at 20 °C for 5 min for temperature equilibration, followed by addition of α-chymotrypsin (0.2 mg/ml) and further incubation for 4.5 minutes. Phenylmethylsulfonyl fluoride (PMSF) was added to a final concentration of 1.5 mM to quench the reaction. The myosin solution was subsequently centrifuged at 70,000 rpm (TLA 100.3 rotor) for 30 min in a Beckman ultracentrifuge to pellet the undigested myosin and myosin rods. The supernatant containing the S1 was removed and diluted to 1 ml with low salt buffer (LSB: 30 mM KCl, 5 mM MgCl2, 20 mM MOPS, pH 7.0, and 4 mM DTT). To concentrate the S1, the samples were centrifuged at 12,000 × g in a Sorvall MC 12V at 4 °C using a Millipore Ultrafree 0.5 μm centrifugal filter Biomax-5 with a 5,000 kDa cut-off. The final volume of the supernatant was 40–60 μl. S1 concentration was determined from A280 (A280 = 0.75 cm−1 for 1 mg S1 ml−1) and were in the range of 20–30 μM. The S1 samples were stored on ice and used within 1 day for steady-state kinetics experiments and within 1 week for transient kinetics experiments.
Actin Preparation
G-actin was isolated from acetone powder of chicken skeletal muscle as described previously.38 After 1 cycle of polymerization-depolymerization, soluble G-actin obtained after dialysis against 2 mM TrisCl, pH 8, 0.2 mM ATP, 2 mM CaCl2 and 1 mM DTT was quantified spectrophotometrically using an extinction coefficient of 0.62 cm−1 (A310nm-A290nm) for 1 mg actin ml−1. Under standard preparation condition, the concentrations of G-actin solutions obtained were in the range of 30–120 μM. To obtain a G-actin solution of 200–400 μM, the Gactin solution was concentrated using the Millipore Biomax-5 filter as described above. F-actin was prepared by adding 1 volume of 10X polymerization buffer (50 mM TrisCl, pH 8, 0.5 M KCl, 20 mM MgCl2 and 10 mM ATP) to 9 volumes of G-actin,, stored on ice at 4°C, and used within one month of preparation for actin-activated Mg2+ATPase assays. Rabbit skeletal muscle actin was used for transient kinetic experiments and prepared according to established methods.38 Quantification of the purified actin was based on a molecular mass of 42 kDa and an extinction coefficient of E1% = 1.104 cm−1 at 280 nm absorbance. Prior to use, rabbit F-actin was mixed with an equimolar concentration of phalloidin and incubated at 4°C for at least four hours in order to stabilize the filaments.
Basal and Actin-stimulated Mg2+-ATPase assays
ATPase activities were determined using [γ-32P]ATP. Actin-activated MgATPase using ~2 μg S1 was determined as previously described for full-length myosins10 with modifications. No salt (KCl) was added to the Mg2+-ATPase assay solution (10 mM Imidazole, 0.1 mM CaCl2, 1 mM MgCl2, 1 mM [γ-32P]ATP), and approximately 10-fold F-actin concentrations were required to obtain near maximal levels of stimulation as previously reported for assays using full-length myosin. The working F-actin solution had a concentration of ~400 μM to minimize the amount of non-radioactive ATP added to the ATPase reaction mixture. Basal Mg2+-ATPase activities obtained in the absence of actin were subtracted from all data points, which were fit with the Michaelis-Menten equation.
Flash photolysis system
Because of the small amounts of protein available, flash photolysis was used to measure the transient kinetics of the Drosophila myosin S1 mutants as described previously.12, 39 Fast skeletal S1 (from rabbit) was used for testing the flash photolysis system, on each occasion and just prior to measuring the Drosophila myosin constructs of interest. The experiment was identical in all details except fast skeletal S1 replaces the Drosophila protein. Thus all aspects of the experiment, except the Drosophila protein, are carefully controlled. The ATP-induced dissociation of the acto-S1 complex was followed by measuring changes in the light scattering signal, whereas the dissociation of nucleotide from S1 alone was detected by changes in fluorescence using coumarin labeled ADP40 (3′-O-{N-[2-(7-diethylaminocoumarin-3-carboxamido)-ethyl]-carbamoyl ADP abbreviated to deac-eda ADP). All light scattering experiments were conducted in a low salt buffer (pH 7.0: 30 mM KCl, 5 mM MgCl2, 20 mM MOPS and 4 mM DTT) with 1 μM actin, 1–3 μM S1, 500 μM cATP (caged ATP), 10 mM DTT and either apyrase (2 units/ml), for ATP-induced dissociation of acto-S1 or ADP (various concentrations) and a glucose-hexokinase system (0.03 units/ml hexokinase, 1 mM glucose and 100 μM Ap5A (P1, P5-di(adenosine 5′)-pentaphosphate) for determination of KAD. Each sample was subjected to multiple laser flashes in order to release variable amounts of ATP from caged ATP. During KAD determination ADP and caged ATP were added after each flash. The deac-eda ADP dissociation experiments (k−D) were also performed in low salt buffer and contained 4 μM S1, 1.5 μM deac-eda ATP (source of deac-eda ADP) and 100 μM cATP. For the determination of kcat the acto-S1 sample, incubated without apyrase, was irradiated by a series of laser pulses of different intensities, which released a range of ATP concentrations (10 – 70 μM). The time taken to hydrolyze all of the ATP (tcat) was estimated from the time at which the dissociation reaction was 50% complete (tdiss) to the time for 50% recovery (tass).13 Plotting tcat versus ATP concentration allows one to estimate the steady-state rate of ATP hydrolysis according to Equation 2
| (2) |
From which one can determine the kcat (Equation 3):
| (3) |
Analysis of the transient kinetics data
Scheme 1 was used to analyze the transient kinetics data. Equation 1 was derived from the interaction of actin and S1 with ATP and ADP (shown in Scheme 1) and was used to determine KAD.
Scheme 1. The interaction of S1 with actin, ATP and ADP.

M, A, T and D symbolize S1, actin, ATP and ADP, respectively.
| (1) |
where kobs is the observed rate constant for the ATP-induced dissociation of acto-S1; K1k+2 is the second-order rate constant for ATP binding to acto-S1; KAD is the equilibrium dissociation constant for the binding of ADP to acto-S1. The equation krel = kobs/ko was used to determine the relative rate constant (krel) shown in Figure 5, where ko is the value of the measured rate constant kobs when [ADP] = 0.
Homology Modeling
Three-dimensional homology models were generated for the Drosophila IFI and EMB myosin motor domain and the exon 9 chimeric molecules using the SWISS-MODEL41 automatic comparative protein modeling server as described previously.39 The primary sequences of the Drosophila IFI and EMB isoform were pairwise aligned with the sequence of four scallop myosin structures as templates (ExPDB 1kk8, 1qvi, 1s5g and 1sr6) using the CLUSTALW alignment protocol. The alignments were submitted to the alignment interface of SWISS-MODEL and the generated models were validated using WHAT CHECK.42 Since the template coordinates cannot be used to model regions of insertions or deletions in the target-template alignment, an ensemble of fragments compatible with the neighboring stems was constructed using constraint space programming (CSP).41 In cases where CSP does not give a satisfying solution and for loops above 10 residues, a loop library derived from experimental structures was searched to find compatible loop fragments. Both Drosophila IFI and EMB myosin head sequences showed significant sequence identity with various other myosin super family members. A sequence identity of 60 % (± 1%) was found when aligning IFI and EMB myosin head sequences with class II scallop myosin, thus enabling us to build well-resolved homology models.39 Crystal structures are available of the various states of scallop myosin during the cross-bridge cycle and these were chosen to generate 3D homology models of the IFI and EMB myosin heads as well as models of the chimeras obtained after swapping the exon 9 encoded region (IFI-9b and EMB-9a). Three of the scallop myosin structures used as templates contain a nucleotide in the binding pocket and they represent various conformational states of myosin during the cross-bridge cycle: the post-power stroke state contains ADP-BeFx (ExPDB 1kk8), the pre-power stroke state contains ADP-VO4 (ExPDB: 1qvi) and a novel conformation contains partially-bound ADP-SO4 (ExPDB 1s5g). The other scallop myosin structure does not have a nucleotide in the binding pocket (ExPDB 1sr6) and represents the near-rigor state of myosin. The generated models have Ramachandran Z-scores of −0.469 (± 0.104) and average packing Z-scores of −1.075 (± 0.075), which are within the expected range for well-refined structures. The overall topology of the models was similar to that of the scallop myosin II templates (average rmsd of the backbone is 0.17 ± 0.03 Å).
Supplementary Material
Acknowledgments
This work was supported by NIH grant GM32443 (to SIB) and Wellcome Trust Grant 070021 (to MAG). We thank Martin Webb (National Institute for Medical Research, Mill Hill, London, UK) for the coumarin ATP/ADP used in this work and Anju Melkani for excellent technical support.
Footnotes
Publisher's Disclaimer: This is a PDF file of an unedited manuscript that has been accepted for publication. As a service to our customers we are providing this early version of the manuscript. The manuscript will undergo copyediting, typesetting, and review of the resulting proof before it is published in its final form. Please note that during the production process errors may be discovered which could affect the content, and all legal disclaimers that apply to the journal pertain.
References
- 1.Richards TA, Cavalier-Smith T. Myosin domain evolution and the primary divergence of eukaryotes. Nature. 2005;436:1113–1118. doi: 10.1038/nature03949. [DOI] [PubMed] [Google Scholar]
- 2.Foth BJ, Goedecke MC, Soldati D. From the Cover: New insights into myosin evolution and classification. Proc Nat Acad of Sci. 2006;103:3681–3686. doi: 10.1073/pnas.0506307103. [DOI] [PMC free article] [PubMed] [Google Scholar]
- 3.George EL, Ober MB, Emerson CP., Jr Functional domains of the Drosophila melanogaster muscle myosin heavy-chain gene are encoded by alternatively spliced exons. Mol Cell Biol. 1989;9:2957–2974. doi: 10.1128/mcb.9.7.2957. [DOI] [PMC free article] [PubMed] [Google Scholar]
- 4.Bernstein SI, Milligan RA. Fine tuning a molecular motor: the location of alternative domains in the Drosophila myosin head. J Mol Biol. 1997;271:1–6. doi: 10.1006/jmbi.1997.1160. [DOI] [PubMed] [Google Scholar]
- 5.Koppole S, Smith J, Fischer S. The Structural Coupling between ATPase Activation and Recovery Stroke in the Myosin II Motor. Structure. 2007;15:825–37. doi: 10.1016/j.str.2007.06.008. [DOI] [PubMed] [Google Scholar]
- 6.Holmes KC, Schroder RR, Sweeney HL, Houdusse A. The structure of the rigor complex and its implications for the power stroke. Phil l Trans Royal Soc B: Biol Scis. 2004;359:1819–1828. doi: 10.1098/rstb.2004.1566. [DOI] [PMC free article] [PubMed] [Google Scholar]
- 7.Houdusse A, Szent-Gyorgyi AG, Cohen C. Three conformational states of scallop myosin S1. Proc Nat Acad Sci. 2000;97:11238–11243. doi: 10.1073/pnas.200376897. [DOI] [PMC free article] [PubMed] [Google Scholar]
- 8.Zhang S, Bernstein SI. Spatially and temporally regulated expression of myosin heavy chain alternative exons during Drosophila embryogenesis. Mechanisms of Development. 2001;101:35–45. doi: 10.1016/s0925-4773(00)00549-9. [DOI] [PubMed] [Google Scholar]
- 9.Kronert WA, Dambacher CM, Knowles AF, Swank DM, Bernstein SI. Alternative Relay Domains of Drosophila melanogaster Myosin Differentially Affect ATPase Activity, in Vitro Motility, Myofibril Structure and Muscle Function. J Mol Biol. 2008;379:443–456. doi: 10.1016/j.jmb.2008.04.010. [DOI] [PMC free article] [PubMed] [Google Scholar]
- 10.Swank DM, Knowles AF, Kronert WA, Suggs JA, Morrill GE, Nikkhoy M, Manipon GG, Bernstein SI. Variable N-terminal Regions of Muscle Myosin Heavy Chain Modulate ATPase Rate and Actin Sliding Velocity. J Biol Chem. 2003;278:17475–17482. doi: 10.1074/jbc.M212727200. [DOI] [PubMed] [Google Scholar]
- 11.Clark RJ, Nyitrai M, Webb MR, Geeves MA. Probing nucleotide dissociation from myosin in vitro using microgram quantities of myosin. J Muscle Res Cell Motil. 2003;24:317–323. [PubMed] [Google Scholar]
- 12.Miller BM, Nyitrai M, Bernstein SI, Geeves MA. Kinetic Analysis of Drosophila Muscle Myosin Isoforms Suggests a Novel Mode of Mechanochemical Coupling. J Biol Chem. 2003;278:50293–50300. doi: 10.1074/jbc.M308318200. [DOI] [PubMed] [Google Scholar]
- 13.Weiss S, Chizhov I, Geeves MA. A flash photolysis fluorescence/light scattering apparatus for use with sub microgram quantities of muscle proteins. J Muscle Res Cell Motily. 2000;21:423–432. doi: 10.1023/a:1005690106951. [DOI] [PubMed] [Google Scholar]
- 14.Cope M, WJ, Rayment I, Kendrick-Jones JK. Conservation within the myosin motor domain: implications for structure and function. Structure. 1996;4:969–987. doi: 10.1016/s0969-2126(96)00103-7. [DOI] [PubMed] [Google Scholar]
- 15.Geeves MA, Holmes KC, John M, Squire aDADP. Advances in Protein Chemistry. Vol. 71. Academic Press; 2005. The Molecular Mechanism of Muscle Contraction; pp. 161–193. [DOI] [PubMed] [Google Scholar]
- 16.Fischer S, Windshugel B, Horak D, Holmes KC, Smith JC. Structural mechanism of the recovery stroke in the Myosin molecular motor. Proc Nat Acad Sci. 2005;102:6873–6878. doi: 10.1073/pnas.0408784102. [DOI] [PMC free article] [PubMed] [Google Scholar]
- 17.Sterner Rh, Liebl W. Thermophilic Adaptation of Proteins. Crit Rev Biochem Mol Biol. 2001;36:39–106. doi: 10.1080/20014091074174. [DOI] [PubMed] [Google Scholar]
- 18.Margossian SS, Lowey S. Substructure of the myosin molecule. IV. Interactions of myosin and its subfragments with adenosine triphosphate and F-actin. J Mol Biol. 1973;74:313–30. doi: 10.1016/0022-2836(73)90376-8. [DOI] [PubMed] [Google Scholar]
- 19.Shih WM, Spudich JA. The Myosin Relay Helix to Converter Interface Remains Intact throughout the Actomyosin ATPase Cycle. J Biol Chem. 2001;276:19491–19494. doi: 10.1074/jbc.M010887200. [DOI] [PubMed] [Google Scholar]
- 20.Yang C, Ramanath S, Kronert WA, Bernstein SI, Maughan DW, Swank DM. Alternative Versions of the Myosin Relay Domain Differentially Respond to Load to Influence Drosophila Muscle Kinetics. Biophys J. 2008;95:5228–5237. doi: 10.1529/biophysj.108.136192. [DOI] [PMC free article] [PubMed] [Google Scholar]
- 21.Swank DM, Knowles AF, Suggs JA, Sarsoza F, Lee A, Maughan DW, Bernstein SI. The myosin converter domain modulates muscle performance. Nature Cell Biology. 2002;4:312. doi: 10.1038/ncb776. [DOI] [PubMed] [Google Scholar]
- 22.Holmes KC, Angert I, Jon Kull F, Jahn W, Schroder RR. Electron cryo-microscopy shows how strong binding of myosin to actin releases nucleotide. Nature. 2003;425:423–427. doi: 10.1038/nature02005. [DOI] [PubMed] [Google Scholar]
- 23.Woehlke G, Ruby AK, Hart CL, Ly B, Hom-Booher N, Vale RD. Microtubule Interaction Site of the Kinesin Motor. Cell. 1997;90:207–216. doi: 10.1016/s0092-8674(00)80329-3. [DOI] [PubMed] [Google Scholar]
- 24.Menetrey J, Bahloul A, Wells AL, Yengo CM, Morris CA, Sweeney HL, Houdusse A. The structure of the myosin VI motor reveals the mechanism of directionality reversal. Nature. 2005;435:779–785. doi: 10.1038/nature03592. [DOI] [PMC free article] [PubMed] [Google Scholar]
- 25.Menetrey J, Llinas P, Mukherjea M, Sweeney HL, Houdusse A. The Structural Basis for the Large Powerstroke of Myosin VI. Cell. 2007;131:300–308. doi: 10.1016/j.cell.2007.08.027. [DOI] [PubMed] [Google Scholar]
- 26.Richard P, Charron P, Carrier L, Ledeuil C, Cheav T, Pichereau C, Benaiche A, Isnard R, Dubourg O, Burban M, Gueffet JP, Millaire A, Desnos M, Schwartz K, Hainque B, Komajda M. Hypertrophic cardiomyopathy: distribution of disease genes, spectrum of mutations, and implications for a molecular diagnosis strategy. Circulation. 2003;107:2227–32. doi: 10.1161/01.CIR.0000066323.15244.54. [DOI] [PubMed] [Google Scholar]
- 27.Richard P, Isnard R, Carrier L, Dubourg O, Donatien Y, Mathieu B, Bonne G, Gary F, Charron P, Hagege A, Komajda M, Schwartz K, Hainque B. Double heterozygosity for mutations in the beta -myosin heavy chain and in the cardiac myosin binding protein C genes in a family with hypertrophic cardiomyopathy. J Med Genet. 1999;36:542–545. [PMC free article] [PubMed] [Google Scholar]
- 28.Gorham J, Seidman C, Seidman JC. NHLBI Program for Genomic Applications. Harvard Medical School; 2006. Genomics of Cardiovascular Development, Adaptation, and Remodeling. URL: http://www.cardiogenomics.org. [Google Scholar]
- 29.Arad M, Penas-Lado M, Monserrat L, Maron BJ, Sherrid M, Ho CY, Barr S, Karim A, Olson TM, Kamisago M, Seidman JG, Seidman CE. Gene Mutations in Apical Hypertrophic Cardiomyopathy. Circulation. 2005;112:2805–2811. doi: 10.1161/CIRCULATIONAHA.105.547448. [DOI] [PubMed] [Google Scholar]
- 30.Moolman-Smook JC, De Lange WJ, Bruwer EC, Brink PA, Corfield VA. The origins of hypertrophic cardiomyopathy-causing mutations in two South African subpopulations: a unique profile of both independent and founder events. Am J Hum Genet. 1999;65:1308–20. doi: 10.1086/302623. [DOI] [PMC free article] [PubMed] [Google Scholar]
- 31.Mohiddin SA, Begley DA, McLam E, Cardoso JP, Winkler JB, Sellers JR, Fananapazir L. Utility of genetic screening in hypertrophic cardiomyopathy: prevalence and significance of novel and double (homozygous and heterozygous) beta-myosin mutations. Genet Test. 2003;7:21–7. doi: 10.1089/109065703321560895. [DOI] [PubMed] [Google Scholar]
- 32.Song L, Zou Y, Wang J, Wang Z, Zhen Y, Lou K, Zhang Q, Wang X, Wang H, Li J, Hui R. Mutations profile in Chinese patients with hypertrophic cardiomyopathy. Clinica Chimica Acta. 2005;351:209–216. doi: 10.1016/j.cccn.2004.09.016. [DOI] [PubMed] [Google Scholar]
- 33.Van Driest SL, Jaeger MA, Ommen SR, Will ML, Gersh BJ, Tajik AJ, Ackerman MJ. Comprehensive Analysis of the Beta-Myosin Heavy Chain Gene in 389 Unrelated Patients With Hypertrophic Cardiomyopathy. Journal J of the America n College of Cardiology. 2004;44:602–610. doi: 10.1016/j.jacc.2004.04.039. [DOI] [PubMed] [Google Scholar]
- 34.Anan R, Greve G, Thierfelder L, Watkins H, McKenna WJ, Solomon S, Vecchio C, Shono H, Nakao S, Tanaka H, et al. Prognostic implications of novel beta cardiac myosin heavy chain gene mutations that cause familial hypertrophic cardiomyopathy. J Clin Invest. 1994;93:280–5. doi: 10.1172/JCI116957. [DOI] [PMC free article] [PubMed] [Google Scholar]
- 35.Nanni L, Pieroni M, Chimenti C, Simionati B, Zimbello R, Maseri A, Frustaci A, Lanfranchi G. Hypertrophic cardiomyopathy: two homozygous cases with “typical” hypertrophic cardiomyopathy and three new mutations in cases with progression to dilated cardiomyopathy. Biochemical and Biophysical Research Communications. 2003;309:391–398. doi: 10.1016/j.bbrc.2003.08.014. [DOI] [PubMed] [Google Scholar]
- 36.Cammarato A, Dambacher CM, Knowles AF, Kronert WA, Bodmer R, Ocorr K, Bernstein SI. Myosin Transducer Mutations Differentially Affect Motor Function, Myofibril Structure, and the Performance of Skeletal and Cardiac Muscles. Mol Biol Cell. 2007:E07-09-0890. doi: 10.1091/mbc.E07-09-0890. [DOI] [PMC free article] [PubMed] [Google Scholar]
- 37.Silva R, Sparrow J, Geeves M. Isolation and kinetic characterisation of myosin and myosin S1 from the Drosophila indirect flight muscles. Journal of Muscle Research and Cell Motility. 2003;24:489–498. doi: 10.1023/b:jure.0000009809.69829.74. [DOI] [PubMed] [Google Scholar]
- 38.Pardee JD, Spudich JA. Purification of muscle actin. Methods Enzymol. 1982;85(Pt B):164–81. doi: 10.1016/0076-6879(82)85020-9. [DOI] [PubMed] [Google Scholar]
- 39.Miller BM, Bloemink MJ, Nyitrai M, Bernstein SI, Geeves MA. A Variable Domain near the ATP-Binding Site in Drosophila Muscle Myosin Is Part of the Communication Pathway between the Nucleotide and Actin-binding Sites. J Mol Biol. 2007;368:1051–1066. doi: 10.1016/j.jmb.2007.02.042. [DOI] [PMC free article] [PubMed] [Google Scholar]
- 40.Webb MR, Corrie JET. Fluorescent Coumarin-Labeled Nucleotides to Measure ADP Release from Actomyosin. Biophys J. 2001;81:1562–1569. doi: 10.1016/S0006-3495(01)75810-9. [DOI] [PMC free article] [PubMed] [Google Scholar]
- 41.Schwede T, Kopp J, Guex N, Peitsch MC. SWISS-MODEL: an automated protein homology-modeling server. Nucl Acids Res. 2003;31:3381–3385. doi: 10.1093/nar/gkg520. [DOI] [PMC free article] [PubMed] [Google Scholar]
- 42.Hooft RWW, Vriend G, Sander C, Abola EE. Errors in protein structures. Nature. 1996;381:272. doi: 10.1038/381272a0. [DOI] [PubMed] [Google Scholar]
Associated Data
This section collects any data citations, data availability statements, or supplementary materials included in this article.