Abstract
Smart contrast agents for MRI-based cell tracking would enable the use of MRI methodologies to not only detect the location of cells, but also gene expression. Here we report on a new enzyme/contrast agent paradigm which involves the enzymatic degradation of the polymer coating of magnetic nanoparticles to release encapsulated magnetic cores. Cells were labeled with particles coated with a polymer which is cleavable by a specific enzyme. This coat restricts the approach of water to the particle, preventing the magnetic core from efficiently relaxing protons. The reactive enzyme was delivered to cells and changes in cellular T2 and T2* relaxation times of ~ 35% and ~ 50% were achieved in vitro. Large enhancements of dark contrast volume (240%) and CNR (48%) within the contrast regions were measured, in vivo, for cells co-labeled with enzyme and particles. These results warrant exploration of genetic avenues towards achieving RElease ACTivation of Iron Oxide Nanoparticles (REACTION).
Keywords: MRI, iron oxide, cells, contrast agents, nanoparticles
INTRODUCTION
MRI has become an essential tool for cell tracking both in animals and in humans. Magnetic cell labeling has been extensively applied to monitor the migration of various cell types in vivo in animal models of cancer (1), inflammation (2), ischemia (3), brain pathologies (4) and embryogenesis (5). The methodology for MRI cell tracking has been well established for both transplanted labeled cells (6) and endogenously labeled cells as well (7). However, progressing beyond detection of labeled cells to gain deeper knowledge regarding their cell fate or function has yet to be accomplished.
Several MRS/MRI reporter systems have been developed to allow the study of biological processes that occur in vivo. These include directly detected MR reporter genes as well as indirect reporters using exogenously applied contrast agents. Exciting research on directly detected MR reporter genes involve ferritin (8), MagA (9) and long repeat poly-l-lysine (10). However, these gene products have weak MRI properties, necessitating thousands of cells at a minimum for detection. Investigation of sparse or diluted cell populations requires higher concentrations or higher relaxivities of the contrast entity. Exogenously administered contrast agents serve this role.
“Biosensor” or “smart” contrast agents can be activated by environmental stimuli and result in a change in molar relaxivity of the chemical, resulting in either signal intensity or relaxation rate changes. Enzyme activated MRI biosensors were first demonstrated with EgadMe, a Gd based contrast agent in which the Gd atom is “masked” by a galactopyranse moiety and thus inaccessible to diffusing water protons (11). Following cleavage of the galactopyranose moiety by β galactosidase, the Gd ion becomes water accessible, switching the agent from an “off” to an “on” state. A second example of an enzyme mediated change in relaxivity involves the action of lipase to convert an insoluble Gd based agent to a soluble form, increasing r1 (12). A third example is the myeloperoxidase (MPO) sensitive gadolinium chelates, which oligomerize in the presence of MPO, increasing r1 (13). However, as in the case of the direct detected MR reporter genes, low molar relaxivity prohibits their use for detecting low numbers of cells.
In contrast to gadolinium based agents, iron oxide nanoparticles have very high r2 and r2* molar relaxivities. This permits the detection of very low numbers of cells, even individual cells, in vivo. The use of iron oxide nanoparticles as smart contrast agents has taken the form of magnetic relaxation switches, increasing r2 and r2* by selectively aggregating in the presence of a specific analyte (14). This has worked well for extracellular analytes, such as nucleic acids (15) and proteins (16), however it has not been implemented intracellularly. This is likely due to the fact that particles are already aggregated within endosomes upon internalization, inhibiting a change in size of effective magnetic centers. However, another strategy using iron oxide particles is still possible, even intracellularly.
The relaxivity of magnetic nanoparticles is dependent on several chemical/physical properties, including the crystal size (17), clustering (18) and coat thickness (19). Water protons that diffuse close to the particle’s magnetic core experience both a larger magnetic field offset from the main magnetic field and steeper magnetic field gradients than a water proton that diffuses farther from the magnetic core (20). Therefore, modulating the coating thickness by way of enzymatic degradation, and thus changing r2 and r2* molar relaxivity of iron oxide particles, could serve as a new paradigm for enzyme sensitive MRI reporter probe. In this work we demonstrate that specific and selective cleavage of a nanoparticle coating by enzymes can release encapsulated iron oxide cores, elevating r2 and r2* molar relaxivity.
MATERIALS AND METHODS
Cell Culture
STO mouse embryonic fibroblasts and MCF-7 human breast adenocarcinoma cells were purchased from American Type Culture Collection and cultured in Dulbecco’s Modified Eagle’s Medium (STOs) and in Eagle’s Minimum Essential Medium (MCF-7). All media were supplemented with 100U/ml Penicillin and 0.1 mg/ml streptomycin, 10% FCS and 2mM L-glutamine. MCF-7 culturing medium was additionally supplemented with 0.01 mg/ml bovine insulin (Sigma).
Cell free system for REACTION
Enhancement of iron oxide contrast following enzymatic degradation of polymer coating was first assayed in a cell free system. Feridex I.V. nanoparticles (Berlex, Montville, NJ) were used. These particles are formulated to contain 11.2 mg/ml iron (0.2 M Fe) and 5.6 – 9.1 mg/ml dextran T-10 (0.56 – 0.91 mM dextran). Cleavage of the dextran coat on Feridex nanoparticles was performed by dilution of Feridex 1:200 in 10 mM acetate buffer pH 6.0 or 50 mM citrate buffer pH 5.5, using the following reaction conditions: 1 mM iron (2.8 – 4.55 μM dextran), 25 nM dextranase (MP Biomedicals, Solon, Ohio) and 10 mM CaCl2. These buffers have previously been verified to mimic the endosome/lysosomes environment (21). Fortuitously, dextranase has optimal activity at pH 5.5. Mixtures were stirred at 37°C from 1 hour up to 3 days to reach full cleavage. Additionally, cleavage of high concentration of particles (20 mM iron, 56–91 μM dextran) by 0.1 μM dextranase was performed in citrate buffer. This last experiment was performed to enable visual confirmation of the enzymatic reaction.
To measure transverse relaxationrates, samples were diluted 1:10 in 0.5 ml of 1% agar to reach final concentration of 0.1 mM iron. MRI was performed at 4.0 T (Bruker Biospin, Billerica, MA, Paravision software 3.0.2). For T2 mapping, a multi-echo, spin echo sequence was utilized with the following parameters: TR 10 s, 8 echo times evenly spaced from 10–80 ms. For T2* mapping multi-echo, gradient echo sequence was used with a TR 10 s, 8 echo times with 2.7 ms echo spacing The MRI data was analyzed with the use of Matlab computing software (The Mathworks Inc.) to calculate T2 and T2* from region of interest and to generate R2 (1/T2) and R2* (1/T2*) maps. Statistical analysis was performed using the Student’s t-test (1 tail, paired).
In cellulo enzymatic system
Release activated enhancement of iron oxide nanoparticle relaxivity was also assayed in cells in vitro. Feridex (10 μl of 0.5 mM stock solution) was pre-incubated with PLL (10 μl of 5 μM stock solution, 1.5 mg/ml PLL in PBS, Sigma) for 30 minutes at 37°C, according to published protocols (22). Dextranase (10 μl of a 12.5 μM stock) was added for 15 minutes and final concentrations (iron 1 mM, PLL 1 nM and dextranase 25 nM) were reached in complete medium. Cells (STO(n=3), MCF-7(n=4)) were suspended in labeling media (1 × 10⁶ cells/ml) for 2 hours of occasional mixing. Following extensive washing with PBS, 5 × 10⁶ cells/ml were reconstituted in 1% agar and T2 and T2*measurements of labeled and control cells were performed utilizing a multi-echo spin echo sequence as described above. Confocal microscopy (Leica TCS SP5 Spectral Confocal Microscope) was used to verify co-labeling of cells with both Texas Red fluorescent dextranase and fluorescein florescent Feridex. Procedures to conjugate fluorescent probes to dextranase and Feridex are described below. Immunohistochemistry analysis of the dextran coat composition was performed on cells grown on chamber slides. Following 2 hours of cell labeling as described above, cells were washed and fixed with 4% paraformaldehyde for 20 minutes. The fixative was washed with PBS prior to blocking with 2% donkey serum in PBS and 0.1% triton-X100. Mouse anti-dextran antibody (StemCell Technologies 1:500) was applied at 4°C for overnight incubation. Following additional washing secondary donkey anti-mouse cy5 antibody was applied for 1 hour at room temperature. Cells were embedded with ProLong mounting media containing Dapi for nucleus counterstaining (23). Cell Viability was determined using the Neutral Red viability assay (24). Statistical analysis was performed using the Student’s t-test (1 tail, paired).
Fluorophores conjugations
To enable confocal microscopy on cells labeled with dextranase and Feridex, dextranase and Feridex were chemically functionalized with Texas Red and fluorescein fluorophores, respectively.
Dextranase – Texas Red
Dextranase (1 ml of 2 mg/ml) was dialyzed against 0.1 M sodium bicarbonate pH 8.7. Texas Red-X, succinimidyl ester (1 μl of 1 mg/ml in DMF, Invitrogen) was added and the mixture was stirred 1 hour at room temperature followed by additional overnight mix at 4°C. The conjugation product was purified by dialysis against PBS.
Feridex – fluorescein
Feridex (3 ml of 2 mg/ml iron concentration) in acetate buffer (150 mM NaCl, 10 mM sodium acetate pH 6.0) was mixed with 24 mg sodium metaperiodate (NaIO4) to oxidize the dextran surface (1:4 mass ratio). After 1 hour at room temperature, the solution was loaded onto sephadex column washed with 180 mM NaCl pH 7.0 to remove excess NaIO4. The recovered solution was transferred into bicarbonate buffer (150 mM NaCl, 20 mM sodium bicarbonate pH 8.7) and 2 μl 4′-(aminomethyl)fluorescein (1 mg/ml in DMF, Invitrogen) was added to form a Schiff’s base. The mixture was stirred overnight at room temperature. Lastly, to reduce the Schiff’s base and form a stable alkylamine bond, 800 μl of 160mM sodium cyanoborohydride was added, stirring on ice for 1 hour followed by 4 hours stirring at room temperature. Conjugation product was purified on sephadex column and was dialyzed against PBS.
In vivo REACTION
All animal experiments were approved by the Yale Animal Care and Use Committee. Nude mice were anesthetized with 1.5% isoflurane. Three sets of MCF7 cells were prepared. One set was labeled with Feridex only, the second set was co-labeled with Feridex and dextranase as above, while the third set was used as control unlabeled cells. Following labeling, cells were treated with mitomycin C, a potent mitotic blocker, to prevent cells from expanding in vivo during the 8 day experiment. Trypan blue staining was performed to ensure cell viability. Next, MCF-7 cells, 0.5 × 10⁶ mixture of 90% unlabeled and 10% Feridex labeled cells in 20 μl, were injected into the left hind limb muscle of nude mice (n=6). The contralateral side received 0.5 × 10⁶ mixture of 90% unlabeled and 10% Feridex plus dextranase labeled cells in 20 μl.
In vivo MRI measurements
Under 1% isoflurane anesthesia in 90% oxygen/10% medical air, both mouse legs were placed in the center of a home built transmit-receive volume coil. Respiratory rate was maintained at 40 breaths/minute and body temperature was maintained at 37° C by use of a circulating water bath. 3D T2* gradient echo MRI was performed using the following imaging parameters: FOV of 2.56 × 2.56 × 2.00 cm, 256 × 256 × 128, TR = 50 ms, TE = 5 ms. Images of the mouse legs were obtained at 1, 3 and 8 days after injection. Following MRI, animals were revived and returned to the animal facility, after the end point measurement mice were sacrificed. MRI data was analyzed using both BioImagesuite software (25) as well as Amide software (freeware, amide.sourceforge.com) to determine the volume (mm3) of the susceptibility effect and CNR. CNR Feridex = ABS [(SI Feridex area − SI control muscle tissue)/σ noise], CNR dextranase = ABS [(SI Feridex-dextranase area − SI control muscle tissue)/σ noise]. Statistical analysis was performed using the Student’s t-test (1 tail, paired).
RESULTS
Dextranase cleavage of Feridex nanoparticles releases iron oxide cores
Cleavage of Feridex nanoparticles by dextranase was established in acetate and citrate buffers, pH 6.0 and 5.5 respectively, both supplemented with Ca2+, an essential cofactor. These buffers were chosen to approximate the chemical environment of low pH compartments in the cells, namely endosomes and lysosomes (21). Reaction mixtures were incubated for 3 days at 37°C on a turning wheel to achieve complete reaction. However, dextran cleavage was evident within minutes as indicated both by clearing of the solution as well as by the observation of brown precipitate at the bottom of the vial (Figure 1A). Even at this one hour time point, a significant change (p= 0.0001) in T2 was determined in each sample, with a decrease in T2 of 68 ± 11 to 50 ± 2 msec (27%), (Figure 1B). After 3 days incubation, the T2 values of Feridex only samples constituted at 0.1 mM iron in acetate and citrate buffer in agar were 115 ± 8 ms and 109 ±12 ms, respectively (Figure 2A). Following incubation with dextranase, these T2 values dropped to 67 ± 4 ms and 77 ± 18 ms. These changes following enzymatic cleavage of the Feridex were 48 ms and 34 ms or 42% (P=0.05) and 28%, respectively for acetate and citrate (P=0.17). T2* significantly decreased (p<0.005) from 15 ± 0.3 ms to 8 ± 0.2 ms and 15 ± 0.2 ms to 10 ± 0.3 ms in acetate and citrate buffers, manifesting a 55% and a 65% drop, respectively (Figure 2B). These decreases in T2 and T2* are also evident on R2 and R2* maps demonstrating elevations in transverse relaxation rates following treatment with dextranase.
Figure 1.
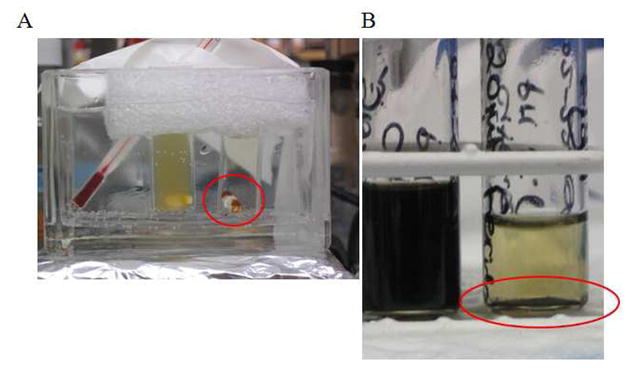
Photographs of REACTION following incubation of Feridex (1 mM iron) at 37°C. A) Reaction in acetate buffer, pH 6.0 for 40 minutes. Left vial contained Feridex only, right vial contained Feridex plus 25 nM dextranase. Note released iron cores attracted to stir bar in right vessel (red circle). B) Reaction in citrate buffer after 72 hours. Left vial contained Feridex only, right vial contained Feridex plus 25 nM dextranase. Note released iron cores on bottom of right vessel (red circle).
Figure 2.
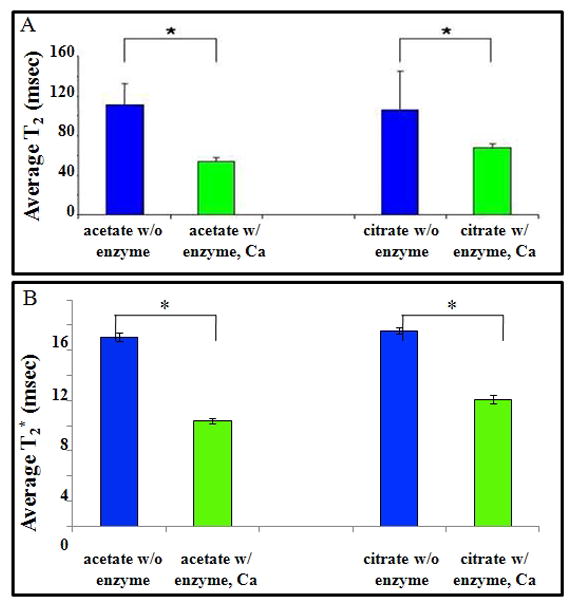
Reduction of transverse relaxation times following enzymatic cleavage of Feridex. A) T2 and B) T2*of Feridex samples after 72 hours incubation with and without dextranase, in acetate and citrate buffer.
In cellulo dextranase cleavage of Feridex nanoparticles
In cellulo cleavage of Feridex by dextranase and the consequent effect on cellular T2 relaxation time was assessed STO mouse embryonic fibroblasts. Cells were either un-labeled, labeled with Feridex (1mM iron) only or labeled with both Feridex and dextranase (25 nM). Since Feridex is shuttled to endosomes and lysosomes following its incorporation into the cells (21), it was important to determine that the enzyme and Feridex are co-localized in the same intracellular compartment to allow cleavage of the particles. Confocal fluorescence microscopy of cells that were double labeled with a prepared fluorescein fluorescent Feridex and Texas Red labeled dextranase confirmed double labeling (Figure 3C). The viability of cells following cleavage of dextran coat was assessed by Neutral Red viability assay and was found to be unaffected by dextranase activity (data not shown).
Figure 3.
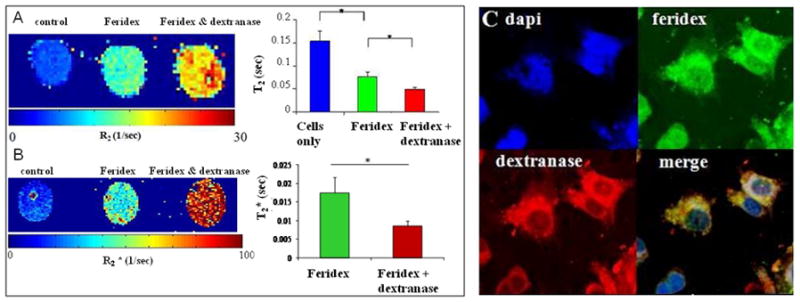
In cellulo reduction of transverse relaxation times following 2 hour enzymatic cleavage of Feridex coating. (A) R2 and (B) R2* mapping of cell samples, accompanied by corresponding T2 and T2* for each sample studied. (C) Confocal fluorescence microscopy of cells co-labeled with green fluorescent feridex and red fluorescent dextranase.
T2 was measured and R2 maps were generated for these three cell groups at two hours after labeling. As evident from Figure 3A, cells labeled only with Feridex possessed higher R2 values compared with the unlabeled cells. Furthermore, cells that were co-labeled with dextranase exhibited elevation in the observed R2, compared to Feridex only labeled cells. T2 values were calculated on ROIs and were found to be 153 ± 22 ms for control unlabeled cells. T2 dropped to 77 ± 9 ms after labeling with Feridex and co-labeling with dextranase further reduced the measured T2 to 50 ± 4 ms, a change in T2 of 27 ms or 35%, significant with p<0.05. T2* was reduced from 17 ms ± 4 for cells labeled with feridex to 8 ms ± 1 for cells treated with dextranase, a 50% drop (p<0.05) (Figure 3B). This can also be appreciated on the R2* map. Further confirmation for the cleavage of the feridex coat by dextranase was provided by immunohistochemistry analysis. Dextran staining on Feridex only labeled cells revealed a condensed pattern of staining that considerably differed from the diffuse pattern observed in dextranase treated cells (Figure 4).
Figure 4.
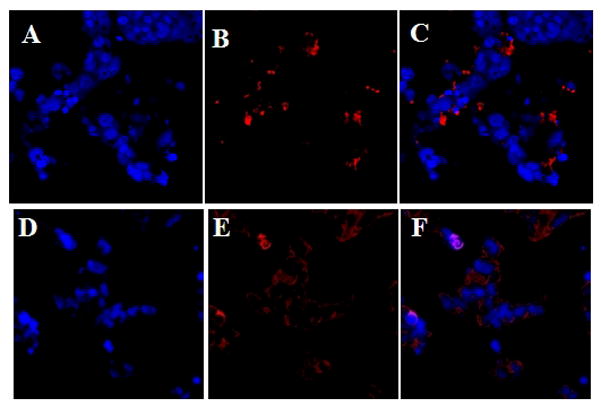
Confocal microscope images of MCF7 cells following labeling with Feridex without and with dextranase. Feridex only cells (A–C), Feridex and dextranase (D–F). A, D dapi stain; B, E anti-dextran stain (cy5, red); C, F merged images.
T2* modulation in vivo following cleavage of Feridex by dextranase
An in vivo demonstration of REACTION was established in nude mice. Two sets of MCF 7 breast tumor cells were labeled with Feridex only or co-labeled with Feridex and dextranase. A mixture of 10 % labeled MCF 7 and 90 % unlabeled MCF 7 cells was inoculated into the hindlimb muscles of nude mice. Contrast from either labeled cell group were undetectable using T2 weighted MR imaging. This is likely due to the low number of labeled cells, only 50k labeled cells (data unshown). However, T2* weighted MR images acquired at 1 day post injection demonstrated that a greater susceptibility effect was generated by cells that were co-labeled with dextranase and Feridex relative to Feridex only labeled cells (Figure 5A). Evaluation of the susceptibility effect was accomplished by calculation of two parameters that are affected by T2* relaxivity of the particles, volume of dark contrast and CNR of the injection spots (26). The volume of the dark contrast associated with cells that were co-labeled with Feridex and dextranase was measured to be 680 mm3 ± 380 while the volume of dark contrast containing cells that were labeled only with Feridex was 200 mm3 ± 140, a 340% difference (Figure 5B, n=6 for each group, p = 0.04). Similarly, calculation of the CNR showed that the CNR of the region containing Feridex and dextranase co-labeled cells was 7.24 ± 0.35, while the CNR of the region containing Feridex only labeled cells was 4.88 ± 0.61, a 48% difference (Figure 5C, p = 0.001). To summarize, the contrast from the co-labeled cells encompassed 340% larger volume and became 48% darker than the contrast from Feridex only labeled cells. Since equal amounts of cells and particles were used to generate the two sets of spots, the differences in the spots’ sizes and CNR as were measured on T2* images could only result from improved T2* relaxivity.
Figure 5.
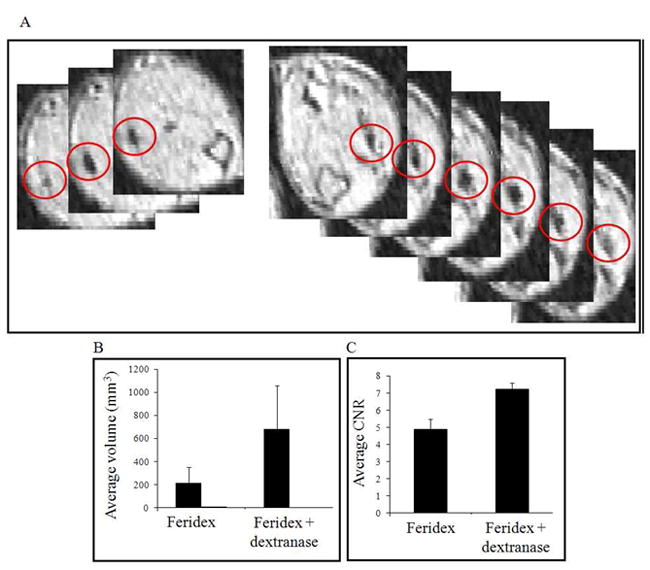
In vivo REACTION, 24 hours after injection of labeled cells. A) Left, three slices from MRI of leg injected with cells labeled only with Feridex. Dark contrast regions are circled in red. Slices are separated by 156 microns. Right, six slices from MRI of leg injected with cells labeled with Feridex and dextranase. Dark contrast regions are circled in red. Slices are separated by 156 microns. B) Graph of measured volume of dark contrast regions and C) contrast to noise ratio from cells labeled with Feridex only or double labeled with Feridex and dextranase.
DISCUSSION
Increase in effective nanoparticle relaxivity by way of aggregation of nanoparticles to report on molecular events has been well demonstrated (16). Here a different paradigm to increasing nanoparticle relaxivity is introduced, involving the enzymatic degradation of an intact nanoparticle to release the encapsulated magnetic cores. The magnetic core of iron oxide nanoparticles creates both a static magnetic field offset and strong magnetic field gradients near the core. Far from the core, only weak magnetic fields exist. Thick coating over a magnetic center results in water molecules remaining far from the magnetic core, yielding relatively low r2 and r2* molar relaxivity. Removal of the thick polymer coat surrounding the magnetic core reduces the distance of approach for water protons to the magnetic core, thus allowing water to experience both higher magnetic field inhomogeneities and steeper magnetic field gradients. Thus, as the particle coating thickness decreases, for a single iron oxide core, r2 and r2* relaxivity increase (19).
In this work, it was first demonstrated, in vitro, that enzymatic removal of the polymer coating surrounding the magnetic cores results in significant changes in relaxivity of the particles, revealed by a change in T2 and T2* of samples. This release of magnetic cores was seen as a brown precipitate in the reaction vessel. Next, was a demonstration of the modulation of transverse relaxation times of Feridex-labeled cells in the presence of dextranase, due to enzymatic digestion of the coat and release of the encapsulated magnetic core. This was an important experiment demonstrating that indeed the enzymes are functional when co-localized with particles within endosomes. Co-localization was verified by confocal microscopy. A direct support to the enzyme digestion of the particles comes from the diffused pattern of dextran staining in cells following treatment with dextranase. Lastly, it was demonstrated that this enzymatic activity was preserved in vivo and that relaxivity changes of Feridex following enzymatic cleavage resulted in large changes in both susceptibility induced dark contrast volume and CNR. In all cases, cell free, in cellulo and in vivo, T2* relaxivity changes were greater than T2 changes, especially in vivo. This may be due to further aggregation of naked iron oxide cores following release from particles and the low number of labeled cells used. Whether REACTION manifests itself as a T2* phenomenon remains to be validated in other paradigms. Clearly, it will depend on the size of the particles used and the degree of masking of the iron cores.
Cellular therapies have a clear clinical trajectory that can be accelerated by imaging protocols that not only detect cell transplantation, but also stem cell differentiation or cellular activation. To that end, improved MR reporter systems need to be developed. In the study presented here, Feridex was used as a proof of principle particle. Improvements to this paradigm would be engineering better particles and a genetic expression system. Improved particles would possess a lower initial r2 or r2* than Feridex, allowing for greater dynamic range in relaxivity following enzymatic release of the magnetic cores. As the enzymatic activity needs to occur in the same location as the nanoparticles, the expression of the enzyme needs to be targeted to the endosomes or lysosomes. Work on these two theoretical and experimental aspects are underway in the laboratory.
CONCLUSION
A new paradigm in environmentally sensitive MRI contrast agents is introduced whereby an enzyme degrades the outer polymer coating of a magnetic nanoparticle, releasing the encapsulated magnetic core, increasing r2 and r2* molar relaxivity. Significant increases in relaxivity were achieved both in vitro in cell free assays and in cells. Furthermore, these changes in relaxivity revealed significant changes in volume and CNR of dark contrast regions of transplanted cells in live animals, over eight days.
References
- 1.Granot D, Addadi Y, Kalchenko V, Harmelin A, Kunz-Schughart LA, Neeman M. In vivo imaging of the systemic recruitment of fibroblasts to the angiogenic rim of ovarian carcinoma tumors. Cancer Res. 2007;67(19):9180–9189. doi: 10.1158/0008-5472.CAN-07-0684. [DOI] [PMC free article] [PubMed] [Google Scholar]
- 2.Beckmann N, Falk R, Zurbrugg S, Dawson J, Engelhardt P. Macrophage infiltration into the rat knee detected by MRI in a model of antigen-induced arthritis. Magn Reson Med. 2003;49(6):1047–1055. doi: 10.1002/mrm.10480. [DOI] [PubMed] [Google Scholar]
- 3.Henning EC, Ruetzler CA, Gaudinski MR, Hu TC, Latour LL, Hallenbeck JM, Warach S. Feridex preloading permits tracking of CNS-resident macrophages after transient middle cerebral artery occlusion. J Cereb Blood Flow Metab. 2009;29(7):1229–1239. doi: 10.1038/jcbfm.2009.48. [DOI] [PMC free article] [PubMed] [Google Scholar]
- 4.Walczak P, Chen N, Eve D, Hudson J, Zigova T, Sanchez-Ramos J, Sanberg PR, Sanberg CD, Willing AE. Long-term cultured human umbilical cord neural-like cells transplanted into the striatum of NOD SCID mice. Brain Res Bull. 2007;74(1–3):155–163. doi: 10.1016/j.brainresbull.2007.06.015. [DOI] [PMC free article] [PubMed] [Google Scholar]
- 5.Shapiro EM, Skrtic S, Sharer K, Hill JM, Dunbar CE, Koretsky AP. MRI detection of single particles for cellular imaging. Proc Natl Acad Sci U S A. 2004;101(30):10901–10906. doi: 10.1073/pnas.0403918101. [DOI] [PMC free article] [PubMed] [Google Scholar]
- 6.Bulte JW, Kraitchman DL. Iron oxide MR contrast agents for molecular and cellular imaging. NMR Biomed. 2004;17(7):484–499. doi: 10.1002/nbm.924. [DOI] [PubMed] [Google Scholar]
- 7.Shapiro EM, Gonzalez-Perez O, Garcia-Verdugo JM, Alvarez-Buylla A, Koretsky AP. Magnetic resonance imaging of the migration of neuronal precursors generated in the adult rodent brain. Neuroimage. 2006;32(3):1150–1157. doi: 10.1016/j.neuroimage.2006.04.219. [DOI] [PMC free article] [PubMed] [Google Scholar]
- 8.Cohen B, Ziv K, Plaks V, Israely T, Kalchenko V, Harmelin A, Benjamin LE, Neeman M. MRI detection of transcriptional regulation of gene expression in transgenic mice. Nat Med. 2007;13(4):498–503. doi: 10.1038/nm1497. [DOI] [PubMed] [Google Scholar]
- 9.Zurkiya O, Chan AW, Hu X. MagA is sufficient for producing magnetic nanoparticles in mammalian cells, making it an MRI reporter. Magn Reson Med. 2008;59(6):1225–1231. doi: 10.1002/mrm.21606. [DOI] [PMC free article] [PubMed] [Google Scholar]
- 10.Gilad AA, McMahon MT, Walczak P, Winnard PT, Jr, Raman V, van Laarhoven HW, Skoglund CM, Bulte JW, van Zijl PC. Artificial reporter gene providing MRI contrast based on proton exchange. Nat Biotechnol. 2007;25(2):217–219. doi: 10.1038/nbt1277. [DOI] [PubMed] [Google Scholar]
- 11.Louie AY, Huber MM, Ahrens ET, Rothbacher U, Moats R, Jacobs RE, Fraser SE, Meade TJ. In vivo visualization of gene expression using magnetic resonance imaging. Nat Biotechnol. 2000;18(3):321–325. doi: 10.1038/73780. [DOI] [PubMed] [Google Scholar]
- 12.Himmelreich U, Aime S, Hieronymus T, Justicia C, Uggeri F, Zenke M, Hoehn M. A responsive MRI contrast agent to monitor functional cell status. Neuroimage. 2006;32(3):1142–1149. doi: 10.1016/j.neuroimage.2006.05.009. [DOI] [PubMed] [Google Scholar]
- 13.Chen JW, Querol SM, Bogdanov A, Jr, Weissleder R. Imaging of myeloperoxidase in mice by using novel amplifiable paramagnetic substrates. Radiology. 2006;240(2):473–481. doi: 10.1148/radiol.2402050994. [DOI] [PubMed] [Google Scholar]
- 14.Perez JM, Josephson L, O’Loughlin T, Hogemann D, Weissleder R. Magnetic relaxation switches capable of sensing molecular interactions. Nat Biotechnol. 2002;20(8):816–820. doi: 10.1038/nbt720. [DOI] [PubMed] [Google Scholar]
- 15.Perez JM, O’Loughin T, Simeone FJ, Weissleder R, Josephson L. DNA-based magnetic nanoparticle assembly acts as a magnetic relaxation nanoswitch allowing screening of DNA-cleaving agents. J Am Chem Soc. 2002;124(12):2856–2857. doi: 10.1021/ja017773n. [DOI] [PubMed] [Google Scholar]
- 16.Perez JM, Josephson L, Weissleder R. Use of magnetic nanoparticles as nanosensors to probe for molecular interactions. Chembiochem. 2004;5(3):261–264. doi: 10.1002/cbic.200300730. [DOI] [PubMed] [Google Scholar]
- 17.Huh YM, Jun YW, Song HT, Kim S, Choi JS, Lee JH, Yoon S, Kim KS, Shin JS, Suh JS, Cheon J. In vivo magnetic resonance detection of cancer by using multifunctional magnetic nanocrystals. Journal of the American Chemical Society. 2005;127(35):12387–12391. doi: 10.1021/ja052337c. [DOI] [PubMed] [Google Scholar]
- 18.Tanimoto A, Oshio K, Suematsu M, Pouliquen D, Stark DD. Relaxation effects of clustered particles. J Magn Reson Imaging. 2001;14(1):72–77. doi: 10.1002/jmri.1153. [DOI] [PubMed] [Google Scholar]
- 19.LaConte LE, Nitin N, Zurkiya O, Caruntu D, O’Connor CJ, Hu X, Bao G. Coating thickness of magnetic iron oxide nanoparticles affects R2 relaxivity. J Magn Reson Imaging. 2007;26(6):1634–1641. doi: 10.1002/jmri.21194. [DOI] [PubMed] [Google Scholar]
- 20.Bowen CV, Zhang XW, Saab G, Gareau PJ, Rutt BK. Application of the static dephasing regime theory to superparamagnetic iron-oxide loaded cells. Magnetic Resonance in Medicine. 2002;48(1):52–61. doi: 10.1002/mrm.10192. [DOI] [PubMed] [Google Scholar]
- 21.Arbab AS, Wilson LB, Ashari P, Jordan EK, Lewis BK, Frank JA. A model of lysosomal metabolism of dextran coated superparamagnetic iron oxide (SPIO) nanoparticles: implications for cellular magnetic resonance imaging. NMR Biomed. 2005;18(6):383–389. doi: 10.1002/nbm.970. [DOI] [PubMed] [Google Scholar]
- 22.Arbab AS, Bashaw LA, Miller BR, Jordan EK, Bulte JW, Frank JA. Intracytoplasmic tagging of cells with ferumoxides and transfection agent for cellular magnetic resonance imaging after cell transplantation: methods and techniques. Transplantation. 2003;76(7):1123–1130. doi: 10.1097/01.TP.0000089237.39220.83. [DOI] [PubMed] [Google Scholar]
- 23.Walczak P, Kedziorek DA, Gilad AA, Lin S, Bulte JW. Instant MR labeling of stem cells using magnetoelectroporation. Magn Reson Med. 2005;54(4):769–774. doi: 10.1002/mrm.20701. [DOI] [PubMed] [Google Scholar]
- 24.Repetto G, del PA, Zurita JL. Neutral red uptake assay for the estimation of cell viability/cytotoxicity. Nat Protoc. 2008;3(7):1125–1131. doi: 10.1038/nprot.2008.75. [DOI] [PubMed] [Google Scholar]
- 25.Duncan JS, Papademetris X, Yang J, Jackowski M, Zeng X, Staib LH. Geometric strategies for neuroanatomic analysis from MRI. Neuroimage. 2004;23 (Suppl 1):S34–S45. doi: 10.1016/j.neuroimage.2004.07.027. [DOI] [PMC free article] [PubMed] [Google Scholar]
- 26.Shapiro EM, Skrtic S, Koretsky AP. Sizing it up: cellular MRI using micron-sized iron oxide particles. Magn Reson Med. 2005;53(2):329–338. doi: 10.1002/mrm.20342. [DOI] [PubMed] [Google Scholar]


