

Abstract
The median (MR) and dorsal raphe (DR) nuclei contain the majority of the 5-hydroxytryptamine (5-HT, serotonin) neurons that project to limbic forebrain regions, are important in regulating homeostatic functions and are implicated in the etiology and treatment of mood disorders and schizophrenia. The primary synaptic inputs within and to the raphe are glutamatergic and GABAergic. The DR is divided into three subfields, i.e., ventromedial (vmDR), lateral wings (lwDR) and dorsomedial (dmDR). Our previous work shows that cell characteristics of 5-HT neurons and the magnitude of the 5-HT1A and 5-HT1B receptor-mediated responses in the vmDR and MR are not the same. We extend these observations to examine the electrophysiological properties across all four raphe subfields in both 5-HT and non-5-HT neurons. The neurochemical topography of glutamatergic and GABAergic cell bodies and nerve terminals were identified using immunohistochemistry and the morphology of the 5-HT neurons was measured. Although 5-HT neurons possessed similar physiological properties, important differences existed between subfields. Non-5-HT neurons were indistinguishable from 5-HT neurons. GABA neurons were distributed throughout the raphe, usually in areas devoid of 5-HT neurons. Although GABAergic synaptic innervation was dense throughout the raphe (immunohistochemical analysis of the GABA transporters GAT1 and GAT3), their distributions differed. Glutamate neurons, as defined by vGlut3 antibodies, were intermixed and co-localized with 5-HT neurons within all raphe subfields. Finally, the dendritic arbor of the 5-HT neurons was distinct between subfields. Previous studies regard 5-HT neurons as a homogenous population. Our data support a model of the raphe as an area composed of functionally distinct subpopulations of 5-HT and non-5-HT neurons, in part delineated by subfield. Understanding the interaction of the cell properties of the neurons in concert with their morphology, local distribution of GABA and glutamate neurons and their synaptic input, reveals a more complicated and heterogeneous raphe. These results provide an important foundation for understanding how specific subfields modulate behavior and for defining which aspects of the circuitry are altered during the etiology of psychological disorders.
Keywords: dorsal raphe, median raphe, electrophysiology, vGlut3, GABA, GAT
Introduction
The median raphe (MR) and dorsal raphe (DR) nuclei contain the 5-hydroxytryptamine (5-HT, serotonin) cell bodies that provide the majority of 5-HT innervation of the forebrain. These 5-HT neurons have been implicated in mediating numerous homeostatic functions, i.e., stress responses, sleep-wake cycles, arousal, pain, learning and memory, and temperature regulation (Abrams et al., 2004; Buhot, 1997; Herman and Cullinan, 1997; Lopez et al., 1999; Lowry, 2002; Meneses, 1998; Wang and Nakai, 1994). Additionally, MR and DR1 are also implicated in the etiology and treatment of pathophysiological processes, in particular mood disorders and psychoses (Kroeze and Roth, 1998; Meltzer, 1999; Mourilhe and Stokes, 1998). Understanding how specific raphe circuits and neuron populations control particular behaviors requires a mechanistic description at the cellular and circuit level. Many investigators have proposed that the different subfields of DR and MR have differential roles in terms of mediating stress, anxiety and depression (Adell et al., 1997; Andrade and Graeff, 2001; Andrade et al., 1999; Andrews et al., 1997; Andrews et al., 1994; File and Gonzalez, 1996; Gonzalez and File, 1997; Gonzalez et al., 1998; Graeff et al., 1996; Lowry, 2002). Raphe circuits involve direct modulation of the HPA axis as well as indirectly mediated influences orchestrated by raphe projections to other limbic structures (e.g., the hippocampus, amygdala, and medial prefrontal cortex) and brainstem areas that regulate the autonomic nervous system.
MR and DR project to many of the same forebrain regions but also have distinct projections; additionally DR subfields project to different brain regions (Azmitia and Segal, 1978; Datiche et al., 1995; Imai et al., 1986a; Imai et al., 1986b; Johnson et al., 2008; Lowry, 2002; Vertes, 1991; Vertes et al., 1999; Vertes and Martin, 1988). For example, the rostral DR projects to the caudate-putamen and substantia nigra, the middle DR to the amygdala, whereas the caudal DR projects to the lateral and medial septum, ventral hippocampus, bed nucleus of the stria terminalis, locus coeruleus and hypothalamus. The MR projects to limbic regions such as the habenula, medial and lateral septum, medial prefrontal cortex, and dorsal and ventral hippocampus. Subfield projections (i.e, dmDR, vmDR and lwDR) of the middle and caudal DR project to the amygdala, medial prefrontal cortex and parts of the autonomic nervous system, all regions that are involved in uncontrollable stress and anxiety (Abrams et al., 2005; Abrams et al., 2004; Hale and Lowry, 2011; Johnson et al., 2008; Petrov et al., 1992; Sawchenko et al., 1983).
Non-5-HT containing neurons are present and occur in equal or greater number to 5-HT neurons in DR and MR (Descarries et al., 1982; Kiss et al., 2002; Kohler and Steinbusch, 1982; Li et al., 2001; Van Bockstaele et al., 1993). For any given neurotransmitter, however, the number of neurons is lower, i.e., one third to one tenth less, than the number of 5-HT neurons. Most of non-5-HT neurons are differentially distributed within DR, e.g., GABA in lwDR and CRF cell bodies in dmDR (Allers and Sharp, 2003; Commons et al., 2003; Day et al., 2003). The evidence is less clear for non-5-HT neurons in MR. Many report that non-5-HT neurotransmitters are co-localized with 5-HT (Amilhon et al., 2010; Fremeau et al., 2002; Fu et al., 2010; Ma and Bleasdale, 2002). Thus both 5-HT and the non-5-HT neurotransmitters may be co-released within the raphe as well as in projection areas (Cardin et al., 2010; Varga et al., 2009).
Previous studies characterizing the active and passive membrane characteristics of 5-HT neurons in DR have been tentative since most did not use neurochemical identification. Of the three studies primarily cited as a basis for identifying putative 5-HT neurons (Aghajanian and Lakoski, 1984; Aghajanian and Vandermaelen, 1982; Vandermaelen and Aghajanian, 1983) only one used neurochemical identification. The hallmark characteristics include a firing rate of 1–5 Hz, an action potential with a long duration and large afterhyperpolarization (AHP) and a hyperpolarizing response to 5-HT1A receptor activation. Additionally, several laboratories have proposed different subtypes of 5-HT neurons (Gartside et al., 2000; Hajos and Sharp, 1996; Kocsis et al., 2006). We have recently used whole cell recording techniques in concert with immunohistochemistry to identify the cellular characteristics of both 5-HT and non-5-HT neurons in rat vmDR and MR (Beck et al., 2004). Findings in these two regions have emphasized the necessity to examine these characteristics in all raphe subfields. Results from these studies indicate that differences between 5-HT and non-5-HT neurons are not great enough to identify the neurons electrophysiologically; immunohistochemical identification is required since the electrophysiological properties overlap.
The present report completes our investigation of 5-HT and non-5-HT cell characteristics within the rat raphe subfields. Additionally we report the regional mapping of GABA and glutamate cell bodies and synaptic boutons within the raphe as well as differences in dendritic arborization of 5-HT cells across subfields. Understanding the unique characteristics of 5-HT and non-5-HT neurons within the different raphe subfields in concert with their anatomy and topography leads to a greater understanding of the mechanisms which govern raphe signaling, through which raphe neurons regulate homeostatic processes and that may be altered in pathological states.
2.0 Material and Methods
2.1 Animals
Male Sprague–Dawley rats (100–150 g) were used (Taconic, Germantown, NY) in accordance with the National Institutes of Health guide for the care and use of laboratory animals and approved by the institutional IACUC committee. At this size and age (P35 to P42), animals were juveniles and had not yet reached adulthood. However, the males are sexually mature, i.e, gonads have dropped. Recordings made in animals this size produce healthier slices in which the majority of the neural circuits have developed.
2.2 Electrophysiological recording
Brain slices were prepared as previously described (Beck et al., 2004; Lemos et al., 2006; Lemos et al., 2010). Coronal slices (200 μm), containing DR and MR, were placed in aCSF (mM, NaCl 124, KCl 2.5, NaH2PO4 1.25, MgSO4 2.0, CaCl2 2.5, dextrose 10 and NaHCO3 26) at 37°C bubbled with 95% O2/5% CO2. After one hour, slices were kept at room temperature. Tryptophan (2.5 μM) was included in the holding chamber to maintain 5-HT synthesis, but was not in the aCSF perfusing the slice in the recording chamber.
Each slice was placed in a recording chamber (Warner Instruments, Hamden, CT) and perfused with aCSF at 2 ml/min at 32°C maintained by an in-line solution heater (TC-324, Warner Instruments). Neurons were visualized using a Nikon E600 upright microscope and targeted under DIC. Electrodes were filled with an intracellular solution of (in mM) K-gluconate, 130; NaCl, 5; Na phosphocreatine, 10; MgCl2, 1; EGTA, 0.02; HEPES, 10; MgATP, 2; and Na2GTP, 0.5; with biocytin, 0.1%; pH 7.3.
Whole-cell recordings were obtained using a Multiclamp 700B (Molecular Devices, Instruments,Sunnyvale, CA). Cell characteristics were recorded using current clamp techniques as previously described (Beck et al., 2004; Lemos et al., 2010). Signals were collected and stored using a Digidata 1320 analog-to-digital converter and pClamp 9.0 software (Molecular Devices). All drugs were made in stock solutions, diluted on the day of the experiment and added directly to the ACSF.
2.3 Data analysis
Cellular characteristics were analyzed using Clampfit 9 (Molecular Devices). ANOVA was used to test significance (Prism, Graphpad Software, LaJolla, CA). Neuman-Keuls was used for post-hoc analysis. A probability of p<0.05 was considered significant. All data are reported as mean ± SEM.
2.4 Neuron identity and morphology
To determine whether recorded cells were 5-HT-containing or not, slices were immunostained for tryptophan hydroxylase (TPH), an enzyme in the biosynthetic pathway for 5-HT production as previously described (Beck et al., 2004; Crawford et al., 2010; Kirby et al., 2008; Kirby et al., 2007; Lamy and Beck, 2010; Lemos et al., 2006; Lemos et al., 2010). Neurons that were positively stained with TPH were classified as 5-HT whereas those without TPH were identified as non-5-HT. After electrophysiological recording, slices were placed in 4% paraformaldehyde and stored at 4°C until staining. Sections were incubated with mouse anti-TPH (1:500, Sigma) in PBS with 0.25% Triton X-100 and 0.5% bovine serum albumin for 24 h at room temperature. After several washes, slices were then incubated donkey anti-mouse antibody conjugated to AlexaFluor 488 (1:200; Invitrogen, Carlsbad, CA, USA) for 60 min at room temperature. To visualize the biocytin-filled neuron, slices were incubated in streptavidin-conjugated AlexaFluor 647 (1:200; Invitrogen) in PBS with 0.25% Triton X-100 and 0.5% bovine serum albumin for 90 min at room temperature. After several washes, sections were mounted on Superfrost slides and coverslipped with Prolong Gold Antifade mounting media (Invitrogen, Carlsbad, CA). Labeled cells were visualized using a Leica confocal DMIRE2 microscope (Leica, Allendale, NJ). A 20X scan consisting of several serial, optical sections (0.6 μm) was acquired at the level of the cell body of the biocytin-labeled neuron. Scans of the TPH staining of the same sections were also obtained separately to determine co-localization and identification of whether the neuron was 5-HT or non-5-HT. For morphological analysis, the total number of optical sections taken during the scan depended on the length of the dendrites and the depth that the dendrites traveled through the section, as more optical sections were needed to scan longer, deeper extending dendrites. The entire extent of the dendritic tree of each neuron was obtained for analysis. Images were captured using digital camera and Leica Confocal software (Version 2.5, Leica). The xyz confocal stacks were collected and analyzed using the Neurolucida software program (MicroBrightfield, Williston, VT).
2.5 GAD67, GAT, and vGlut Immunostaining
Animals were deeply anesthetized, then perfused transcardially with 50 ml saline followed by 50 ml 4% paraformaldehyde. The brains were isolated, postfixed in paraformaldehyde overnight at 4°C, then submerged in 30% sucrose in 0.1 M phosphate buffer. Coronal sections encompassing the rostrocaudal extent of the raphe were cut on a cryostat into 40-μm-thick sections.
Sections were washed in phosphate-buffered saline (PBS; pH 7.4) then incubated in the primary antibodies overnight at room temperature in PBS with 0.25% Triton X-100 and 0.5% bovine serum albumin. To identify 5-HT neurons sections were incubated with mouse anti-TPH (1:500; T0678; Sigma, St. Louis, MO) or rabbit anti-5-HT (1:20001:20080; ImmunoStar, Hudson WI). To determine the distribution of GABA afferent fibers and whether 5-HT might be co-localized with GABA or glutamate, sections also were incubated with either GAT1 (1:500; G0157; Sigma), GAT3 (1:500; G8407; Sigma), GAD67 (1:200; MAB5406; Millipore, Billerica, MA), or vGlut3 (1:1000; AB5421; Millipore). After several washes, sections were incubated in the appropriate Alexa Fluor-conjugated secondary antibodies (Table 1) for 90 minutes at room temperature. Control experiments that omitted primary antibody yielded no staining (data not shown). In addition staining for TPH, 5-HT, vGlut3 or GAD-67 was as previously described (Abrams et al., 2004; Allers and Sharp, 2003; Commons, 2009; Commons et al., 2005; Crawford et al., 2010; Fu et al., 2010). For the GAT1 and GAT3 antibodies, according to manufacturer’s specifications, preabsorption of the antisera with the immunogen peptide eliminated all immunostaining.
Table 1.
Summary table of immunostaining
| Staining combinations | 1° antibodies | 2° antibodies |
|---|---|---|
| 5-HT + GAD67 |
|
|
| TPH+GAT1 |
|
|
| TPH+GAT3 |
|
|
| TPH+vGlut3 |
|
|
After a number of washes, sections were mounted on Superfrost slides and coverslipped with Prolong Gold Antifade mounting media (Invitrogen). Labeled cells were visualized using a Leica DMR fluorescence microscope. Images were captured using a digital camera and Openlab 3.09 software (Improvision, Inc., Lexington, MA). Images were adjusted to optimal color balance and contrast using Adobe Photoshop 6.0 software (Adobe, San Jose, CA)
3.0 Results
3.1 Electrophysiology
To determine whether recorded cells were 5-HT or non-5-HT, slices were stained for biocytin and TPH after recording. Although standard practice in the field is to use electrophysiological measures to identify 5-HT neurons, we have previously demonstrated that confirmation using immunocytochemical staining is necessary since there is an overlap in the electrophysiological characteristics of 5-HT and non-5-HT neurons in the DR (Beck et al., 2004; Kirby et al., 2003). Similarly, applying electrophysiological criteria that have been used within the field based on the classic paper by Vandermaelen and Aghajanian (Vandermaelen and Aghajanian, 1983), using sharp electrode intracellular recording techniques, i.e., AP duration>1.8 ms, AHP amplitude > 10 mV, and input resistance = 412–772 MOhm (input resistance corrected for whole cell recording by taking mean and standard deviation of all recorded 5-HT neurons) to the current data set led to high error rates in all subfields of the DR and the MR. Using input resistance as a criteria resulted in an error rate of 100%, with every non-5-HT cell falling into the expected range for 5-HT neurons. Similarly, AHP amplitude failed to identify neurons accurately in any of the subfields with 78–94% of non-5-HT neurons being misidentified as 5-HT. Error rates from using AP duration as the criteria were lower, but still demonstrated a large degree of overlap (non-5-HT neurons misidentified as 5-HT: LW=67%, vmDR=41%, dmDR=26%, MR=13%; 5-HT neurons misidentified as non-5-HT: LW=26%, vmDR=43%, dmDR=39%, MR=33%). Similar results were found using other cell characteristics (data not shown). Thus, raphe cell types cannot be distinguished by their electrophysiological properties alone. For the following analyses, cells were classified as 5-HT-containing if they were positively labeled with TPH and non-5-HT if they were not.
3.1.1 5-HT cells: Cellular properties and 5-HT1A response of across subfield
The resting membrane potential (RMP) of 5-HT neurons differed between raphe subfields (ANOVA, F(3,114)=7.54, p<0.001) with 5-HT neurons in dmDR having a more hyperpolarized resting potential compared to vmDR and MR neurons (Newman-Keuls posthoc, p<0.05, Figure 1). Resistance of 5-HT neurons in MR was significantly larger than that of neurons from all other raphe subfields (ANOVA, F(3,114)=7.94, p<0.001; Newman-Keuls posthoc, p<0.05, Figure 1). The action potential amplitude of 5-HT lwDR neurons was significantly greater than that of other 5-HT neurons, due to their lower resting membrane potential (ANOVA, F(3,109)=21.32, p<0.001; Newman-Keuls posthoc, p<0.05, Figure 2). The activation gap (i.e. the difference between the resting membrane potential and the action potential threshold) was larger for 5-HT dmDR cells than 5-HT neurons in any other subfield (ANOVA, F(3,114)=6.44, p<0.001; Newman-Keuls posthoc, p<0.05). AHP amplitude was greatest in MR and smallest in dmDR (ANOVA, F(3,114)=22.39, p<0.001; Newman-Keuls posthoc, p<0.05). Tau, action potential duration, action potential threshold, and AHP t(1/2) of 5-HT neurons were not different across subfields (Figure 1, 2 and 3).
Figure 1. Passive properties of 5-HT and non-5-HT neurons across raphe subfields.

(A): Raw trace: Hyperpolarizing and depolarizing current is injected into the cell in a stepwise manner. The cell’s response is measured and its passive characteristics determined. (B) RMP: Across subfields, 5-HT neurons in the dmDR having a more hyperpolarized resting potential compared to vmDR and MR 5-HT neurons (a vs. b: different letters indicate statistical significance between the groups, p<0.05). There was no difference in non-5-HT neurons across subfields. Overall, 5-HT cells have a more hyperpolarized resting membrane potential than non-5-HT cells (solid and dotted lines, p<0.05). Comparing 5-HT and non-5-HT neurons within each specific subfield, 5-HT cells in the dmDR are more hyperpolarized than non-5-HT dmDR cells (ANOVA interaction: F(3,202)=6.05, p<0.001, Newman-Keuls posthoc, *p<0.05). (C) Resistance: Across subfields, resistance of MR 5-HT neurons was significantly greater than that of 5-HT neurons from all other raphe subfields (a vs. b: different letters indicate statistical significance between the groups, p<0.05). Resistance of non-5-HT neurons did not differ across subfields. Overall, 5-HT neurons have a larger resistance compared to non-5-HT neurons (solid and dotted lines, p<0.05). Comparing cell types within a given subfield, MR 5-HT cells have a greater resistance than MR non-5-HT cells (ANOVA interaction, F(3,202)=4.45, p<0.005; Newman-Keuls posthoc, *p<0.05). (D) Tau: 5-HT neurons did not differ across subfields. Among non-5-HT neurons, MR non-5-HT neurons had a lower tau than non-5-HT cells in lw and vmDR (a vs. b: different letters indicate statistical significance between the groups, p<0.05). Tau was usually greater in 5-HT neurons than in non-5-HT cells across subfields (solid and dotted lines, p<0.05). N=number of cells in each group.
Figure 2. Active properties of 5-HT and non-5-HT neurons across raphe subfields.

(A): Raw trace: Action potential trace with arrows indicating measurement points used to determine the active properties of the neurons. (B) AP Threshold: Action potential threshold of 5-HT neurons did not differ across subfields. MR non-5-HT neurons possessed a more hyperpolarized action potential threshold than dmDR and vmDR non-5-HT cells (a vs. b: different letter indicates statistical significance between groups, p<0.05). Generally 5-HT neurons had AP thresholds at more depolarized potentials compared to non-5-HT cells (solid and dotted lines, p<0.05). (C) AP Amplitude: Across subfield, AP amplitude of 5-HT lwDR neurons was significantly greater than that of 5-HT neurons in the remaining subfields (a vs. b: different letter indicates statistical significance between groups, p<0.05). AP amplitude was greater in lwDR non-5-HT neurons than non-5-HT cells in any other raphe subfield (c vs. d vs. e: different letter indicates statistical significance between groups, p<0.05). Action potential amplitude was similar between 5-HT and non-5-HT neurons within a particular subfield. (D) AP Duration: For both 5-HT and non-5-HT neurons, AP duration did not differ across subfields. Overall, 5-HT cells have a longer AP duration compared to non-5-HT cells (solid and dotted lines, p<0.05). (E) Activation Gap: Across raphe subfields, the activation gap is larger for 5-HT dmDR cells than 5-HT neurons in any of the other subfields (a vs. b: different letter indicates statistical significance between groups, p<0.05). MR non-5-HT neurons had a smaller activation gap compared to non-5-HT cells in the vmDR (c vs. d: different letter indicates statistical significance between groups, p<0.05). The magnitude of the activation gap is generally greater in 5-HT neurons compared to non-5-HT cells (solid and dotted lines, p<0.001). Comparing within each subfield, the magnitude of the activation gap of dmDR and MR 5-HT cells is greater than that of the non-5-HT cells within the same subfields (ANOVA interaction: F(3,202)=6.19, p<0.01, Newman-Keuls posthoc, *p<0.05). N=number of cells in each group.
Figure 3. Characteristics of the afterhyperpolarization of 5-HT and non-5-HT neurons across raphe subfield.

(A) Raw trace: Action potential trace with arrow indicating measurement points used to determine the properties of the AHP. (B) AHP Amplitude: 5-HT in the MR had the largest AHP amplitude (a vs. b), and dmDR 5-HT cells had the smallest (c vs. d) compared to all the other 5-HT neurons (a vs. b, c vs. d, different letters indicate significant differences between groups, p<0.05). AHP amplitude of non-5-HT neurons did not differ across subfields. AHP amplitude was generally greater in 5-HT cells than non-5-HT neurons (solid and dotted lines, p<0.01). Comparing cell types within individual subfields, 5-HT MR cells have a greater AHP amplitude than non-5-HT MR cells (ANOVA interaction, F(3,202)=4.45, p<0.001, Newman-Keuls posthoc, *p<0.05). (C) AHP t(1/2): 5-HT neurons did not differ across subfields. Non-5-HT neurons in the MR had a shorter AHP t(1/2) compared to lwDR and vmDR non-5-HT cells (a vs. b: different letter indicates statistical significance between groups, p<0.05). 5-HT cells have a longer AHP t(1/2) compared to non-5-HT neurons overall (solid and dotted lines, p<0.05). Comparing cell types within the individual subfields, dmDR and MR 5-HT neurons have a greater AHP t(1/2) than non-5-HT cells in the same subfield (*p<0.05). N=number of cells in each group.
Administration of the 5-HT1A receptor agonist 5-carboxyamidotryptamine (5-CT) produced a hyperpolarization of the membrane potential and a reduction in membrane resistance (Figure 4). The magnitude of the response to a saturating concentration of 5-CT (100 nM), as previously determined (Beck et al., 2004), led to responses of differing magnitude in 5-HT neurons across subfields. The dmDR 5-HT neurons produced significantly less hyperpolarization in response to 5-CT compared to vmDR (ANOVA, F(3,72)=4.71, p<0.005; Newman-Keuls posthoc, p<0.05).
Figure 4. 5-CT responses in 5-HT and non-5-HT neurons across subfield.
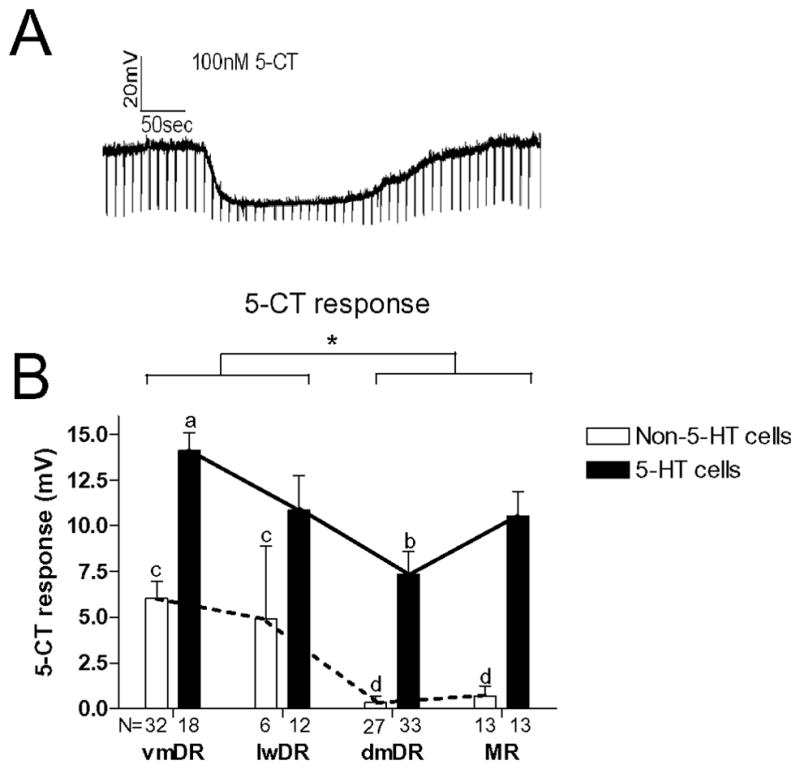
(A) Raw trace: Example trace showing of cell membrane potential. Downward deflections indicate changes in voltage in response to a 300 pA current pulse through the electrode to monitor resistance. The period during which 5-CT was perfused through the recording chamber is indicated by the line above the voltage trace. (B) 5-CT response: Comparing the response to 5-CT in 5-HT neurons across the four subfields, dmDR 5-HT neurons produced a smaller membrane hyperpolarization compared to 5-HT cells in the vmDR (a vs. b: different letter indicates statistical significance between groups, p<0.05). MR and dmDR non-5-HT cells had a smaller response compared to non-5-HT neurons in the lwDR and vmDR (c vs. d: different letters indicate statistical significance between the groups, p<0.05). Comparing 5-HT and non-5-HT neurons, overall vmDR and lwDR show a significantly greater 5-CT response compared to dmDR and MR (*p<0.05). Across all subfields, 5-HT cells produce greater 5-HT1A response compared to non-5-HT cells (solid and dotted lines, p<0.05). N=number of cells in each group.
Taking into consideration all of the active and passive membrane properties, generally the characteristics of 5-HT cells recorded from vmDR, lwDR, and MR were similar. However there were significant differences when looking individually at each of the cell characteristics. These individual differences within each subfield are important in concert with synaptic input in terms of defining the output of the 5-HT neurons.
3.1.2 Non-5-HT cells: Cellular properties and 5-HT1A response across subfields
Both 5-HT and non-5-HT neurons were recorded within the region containing 5-HT neurons in each of the subfields. Neurons were not recorded in those areas that we immunohistochemically defined as containing primarily glutamate or GABAergic neurons (see below).
Unlike 5-HT neurons, resting membrane potential, resistance, action potential duration, and AHP amplitude of non-5-HT neurons did not differ across subfields. The greatest difference in characteristics was seen in MR non-5-HT neurons that had a lower tau (ANOVA, F(3,87)=5.90, p<0.005; Newman-Keuls posthoc, p<0.05), a more hyperpolarized action potential threshold (ANOVA, F(3,88)=5.07, p<0.005; Newman-Keuls posthoc, p<0.05) that was consistent with the lower activation gap (ANOVA, F(3,88)=3.88, p<0.05; Newman-Keuls posthoc, p<0.05), and a shorter AHP t1/2 (ANOVA, F(3,81)=4.19, p<0.01; Newman-Keuls posthoc, p<0.05) compared to non-5-HT neurons primarily within vmDR and lwDR (see Figures 1, 2 and 3 and their captions). Action potential amplitude was greater in lwDR non-5-HT neurons than non-5-HT cells in any other raphe subfield (ANOVA, F(3,88)=11.91, p<0.001; Newman-Keuls posthoc, p<0.05).
An important characteristic of 5-HT neurons is the presence of the 5-HT1A receptor-mediated activation of an inward rectifying potassium channel, resulting in a hyperpolarization. However, the 5-HT1A receptor-mediated response was also present in non-5-HT cells in vmDR and lwDR (Figure 4). In MR and dmDR, non-5-HT cells produced a very small or nonexistent hyperpolarization in response to 5-CT. In contrast, non-5-HT neurons in lwDR and vmDR produced responses that were about half the magnitude of that seen in the 5-HT neurons (ANOVA, F(3,74)=9.78, p<0.001; Newman-Keuls posthoc, p<0.05).
3.1.3 5-HT and non-5-HT cells: Comparing cell characteristics and 5-HT1A response between cell types
As stated above, 5-HT and non-5-HT neurons could not be distinguished based solely on their electrophysiological properties since there was a significant degree of overlap. However, the active and passive properties that differed between 5-HT and non-5-HT cells were those that compose the hallmark features of the 5-HT neuron and the magnitude of this difference was greater in some subfields. Thus, even though there was a large overlap in cell properties, 5-HT and non-5-HT cells were easier to distinguish electrophysiologically within certain subfields, specifically, the dmDR and lwDR. In addition, for all of the measured properties, the two-way interaction was significant indicating that the magnitude of the differences within and between 5-HT and non-5-HT neurons differed across subfields (Figures 1, 2 and 3). These data emphasize the fact the cellular properties of the 5-HT and non-5-HT neurons are subfield dependent.
However, a comparison across subfields of 5-HT and non-5-HT neuron characteristics revealed that 5-HT cells had a more hyperpolarized RMP than non-5-HT cells (ANOVA main effect cell type, F(1,202)=12.9, p<0.001; Newman-Keuls posthoc, p<0.05); tau was greater (ANOVA main effect cell type, F(1,201)=8.36, p<0.005, Newman-Keuls posthoc, p<0.05); resistance was larger (ANOVA main effect cell type, F(1,202)=12.9, p<0.001; Newman-Keuls posthoc, p<0.05); AP threshold was more depolarized than non-5-HT cells (ANOVA main effect cell type, F(1,198)=5.60, p<0.05); AP duration was longer (ANOVA main effect cell type, F(1,197)=26.81, p<0.01; Newman-Keuls posthoc, p<0.05); AHP amplitude was greater (ANOVA main effect cell type, F(1,198)=7.01, p<0.01); and 5-HT cells had a longer AHP t(1/2) compared to non-5-HT neurons (ANOVA main effect cell type, F(1,194)=20.63, p<0.05; Newman-Keuls posthoc, p<0.05). The magnitude of the activation gap was greater in 5-HT neurons compared to non-5-HT cells (ANOVA main effect cell type, F(1,202)=24.57, p<0.001). This was consistent with the more hyperpolarized resting membrane potential and more depolarized action potential threshold of 5-HT neurons compared to non-5-HT cells (Figures 1 and 2). Comparing within each subfield, the magnitude of the activation gap in dmDR and MR 5-HT cells was greater than in non-5-HT cells in those subfields (ANOVA interaction, F(3,202)=6.19, p<0.01, Newman-Keuls posthoc, p<0.05). The only characteristic that was similar between 5-HT and non-5-HT neurons within a given subfield was AP amplitude (Figure 2).
The 5-HT1A receptor mediated response was also greater in 5-HT neurons across all subfields compared to non-5-HT neurons (ANOVA main effect cell type: F(1,146)=58.2, p<0.0001, Newman-Keuls posthoc, p<0.05). The sensitivity to 5-CT was different when comparing subfields regardless of cell type (ANOVA main effect subfield: F(3,146)=12.1, p<0.0001, Figure 4) where vmDR and lwDR had greater 5-CT responses compared to dmDR and MR (Newman-Keuls posthoc, p<0.05). .
3.2 Distribution of GAD67, GAT1, GAT3, vGlut3, and 5-HT neurons in the raphe
3.2.1 GAD67
To determine the distribution of GABA neurons, the antibody for the GABA synthezing enzyme GAD67 was used. GAD67 neurons were found throughout the rostro-caudal extent of DR (Figure 5). In DR, localization of GAD67 cells shifted from ventral areas to more dorsal regions as one traversed caudally through DR. In rostral sections, GAD67 was expressed just below and to either side of vmDR just above the beginning of the intrafascicular zone. In mid-DR sections, GAD67 neurons were concentrated just lateral to the most dorsal portion of vmDR. In caudal regions, GAD-67 labeled cells extended from the area lateral to vmDR up into the region lateral to dmDR. Very few GAD67 neurons were found mid-line or within vmDR or dmDR. Limited co-localization of GAD67 and TPH was observed in vmDR and dmDR.
Figure 5. GAD67 expression in the DR.

GAD67 cells are found ventral to the vmDR in rostral sections and more dorsal locations in the caudal raphe (A1-C1). GAD67 labeling is less intense in the vmDR, lwDR, and dmDR (A2-C2) compared to the surrounding regions (A1-C1; A3-C3). However, although there is little colocalization between GAD67 and 5-HT overall (A1-C1; A2-C2; A3-C3) some colocalization exists between GAD67 and 5-HT, particularly in areas lateral to the vmDR. (A4-C4). Red=GAD67; Green=5-HT.
In contrast to the DR, GAD67 neurons were found in both mid-line and lateral regions across the rostrocaudal extent of MR (Figure 6). 5-HT neurons were found just lateral and adjacent to the population of GAD67 neurons at the midline with little overlap or co-localization between the two populations.
Figure 6. GAD67 expression in the MR.

GAD67 cells were localized to midline and lateral regions of the MR (A1-C1). 5-HT neurons (A2-B2) are interspersed with GAD67 cells across the rostrocaudal extent of MR (A3-C3). Limited co-localization exists between GAD67 and 5-HT (A4-C4). Red=GAD67; Green=5-HT.
3.2.2: GAT1
Antibodies for the GABA plasma membrane transporters GAT1 and GAT3 were used to define GABAergic axons and nerve terminals in the raphe. GAT1 distribution varied across the rostro-caudal extent of DR (Figure 7). In more rostral and caudal sections, GAT1 was observed in areas lateral to midline with a marked drop in staining intensity in vmDR and dmDR. In these rostral and caudal sections, GAT1 puncta and TPH cell populations remained distinctly segregated. In more mid-DR regions however, GAT1 was found across the entire region with TPH neurons interspersed with and surrounded by GAT1 puncta. GAT1 puncta were found around both 5-HT (TPH-labeled) and non-5-HT cells primarily in mid-DR sections.
Figure 7. GAT1 expression in the DR.

In rostral and caudal DR, GAT1 is primarily expressed in areas lateral to vmDR and dmDR (A1, C1). In mid-DR sections, GAT1 is evenly distributed across the DR (B1). Neurons labeled with tryptophan hydroxylase (TPH; A2-B2) are interspersed with GAT1-labeled fibers across the rostrocaudal extent of DR, especially the mid-DR (A3-C3, A4-C4). Confocal images show that GAT1-labeled fibers surround both 5-HT (TPH-labeled, solid arrow) and non5-HT (dashed arrow) neurons (D1-D3). Red=GAT1; Green=TPH
GAT1 staining was much less robust in MR (Figure 8). Across the extent of MR, strong GAT1 staining was observed lateral to the intrafascicular region. GAT1 staining was present in more ventral regions closer to MR and at midline but was less intense. As in DR, GAT1 puncta surrounded both 5-HT (TPH-labeled) and non-5-HT neurons in MR.
Figure 8. GAT1 expression in the MR.

GAT1 was found in regions lateral to the MR (A1-C1). Most TPH-labeled MR neurons (A2-C2) were located along the midline and not within the area of greatest GAT1 expression (A4-C4, D1–D3). Red=GAT1; Green=TPH
3.2.3: GAT3
GAT3 staining was robust and evenly distributed throughout DR. In contrast to GAT1, GAT3 was found in midline and lateral regions across the rostro-caudal DR (Figure 9). Additionally the intensity of staining and density of GAT3 puncta appeared greater than that for GAT1. GAT3 puncta surrounded both 5-HT (TPH-labeled) and non-5-HT neurons in all subfields across DR.
Figure 9. GAT3 expression in the DR.

GAT3 was expressed evenly throughout the DR (A1-C1). Thus, DR neurons labeled with TPH (A2-C2), across all subfields, were interspersed with GAT3-labeled fibers across the rostrocaudal extent of DR(A3-C3, A4-C4). Confocal images show that GAT3-labeled fibers surround individual TPH-labeled neurons (D1–D3). Red=GAT3; Green=TPH
GAT3 staining in MR was most robust in the mid-MR and caudal regions and appeared fairly uniform throughout the midline and lateral area (Figure 10). Less intense staining was seen in the rostral MR. Similar to the results in DR, GAT3 staining in MR appeared more intense than that for GAT1 in MR. Additionally, GAT3 staining was less intense in MR than DR. Both 5-HT and non-5-HT MR neurons were surrounded by GAT3 puncta.
Figure 10. GAT3 expression in the MR.

GAT3 was most strongly expressed in the middle and caudal sections of the MR in both midline and lateral areas (A1-C1). MR neurons labeled with TPH (A2-C2), were interspersed with GAT3-labeled fibers across most of the MR (A3-C3, A4-C4). Confocal images show that GAT3-labeled fibers surround individual TPH-labeled neurons (D1–D3). Red=GAT3; Green=TPH
3.2.4: vGlut3
We have previously determined the distribution of vesicular glutamate transporters 1 and 2 (vGlut 1 and 2) (Commons et al., 2005). vGlut3 anti-bodies were used to define cell bodies and terminals of glutamate neurons within the brain slice. Punctate staining for vGlut3 was found throughout the rostro-caudal DR (Figure 11). vGlut3 labeling appeared interspersed within 5-HT neuronal populations in all subfields. Additionally vGlut3 was localized to non-5-HT cells in areas lateral to 5-HT DR populations.
Figure 11. vGlut3 expression in the DR.

In the DR, vGlut3 was observed in all subfields, overlapping with regions TPH is highly expressed (A1-C1, A2-C2, A3-C3). In addition, vgGut3 was expressed in non-5-HT cells lateral to the dmDR and vmDR (A1-C1, A3-C3). TPH cells were interspersed with vGlut3 puncta across the DR (A4-C4). Confocal images show that vGlut3 puncta co-localize with individual TPH-labeled neurons (D1–D3). Red=vGlut3; Green=TPH
Labeling for vGlut3 was also observed across the rostro-caudal extent of MR though this was less robust than in DR (Figure 12). In general, vGlut3 was found within 5-HT MR cells at the midline and in non-5-HT cells lateral to MR.
Figure 12. vGlut3 expression in the MR.

In the MR, vGlut3 was modestly expressed along the midline and had stronger expression in more lateral areas (A1-C1). Some vGlut3 was found interspersed with the population of TPH-labeled neurons (A2-C2, A3-C3). In addition, vGlut3 was expressed in 5-HT (TPH-labeled) and non-5-HT neurons (A4-C4). Red=vGlut3; Green=TPH
3.3 Morphology of 5-HT neurons in the raphe subfields
3.3.1: Morphology of 5-HT neurons
Morphometric analysis of biocytin-filled 5-HT neurons across the raphe subfields was performed using Neurolucida software. This analysis was not conducted for non-5HT neurons. Confocal stacks were generated (0.5 μm optical slices) and included the full extent of the dendritic arbor of a neuron within the 200 μm slice. The majority of cells were recorded from the middle of the slice and the total length of the dendritic arbor usually extended for >1000 μ.. Although some dendrites may have been cut when making slices for recording, all comparisons were made in the same fashion for all cells. Therefore comparable information was obtained for each cell with regard to the dendritic distribution, length, number, and orientation. Cell body size was also measured.
3.3.2: Soma
Characteristics of the soma of 5-HT neurons differed across subfields (Figure 13). The cell bodies were found in all shapes, i.e., round, oval, multipolar, pyramidal as has been previously reported for raphe (Dahlstrom and Fuxe, 1964; Diaz-Cintra et al., 1981; Hale and Lowry, 2011; Steinbusch et al., 1981). Soma volume (ANOVA, F(3,49)=8.5, p =0.0001, vmDR = lwDR > dmDR = MR), surface area (ANOVA, F(3,48)=8.6, p< 0.0001, vmDR = lwDR > dmDR = MR) and total area (ANOVA, F(3,49)=8.4, p = 0.0001, vmDR = lwDR > dmDR = MR) of 5-HT neurons were all significantly larger in vmDR and lwDR than in dmDR and MR.
Figure 13. Characteristics of the soma of 5-HT neurons across raphe subfields.

In all measures (soma volume, surface area, and total area), 5-HT neurons in the vmDR and lwDR had larger cell bodies than 5-HT cells in the dmDR and MR (N=11–14 neurons/group, *p<0.05).
3.3.3: Dendrites
The dendritic arbor of 5-HT neurons was also distinct across raphe subfields (Figure 14). Number of primary dendrites (dendrites directly extending from the cell body) per neuron was not different across subfield. There was a statistically significant difference for the number of ends and number of branch points (ANOVA, F(3,49) = 3.3, p=0.038; ANOVA F(3,49) = 3.9, p = 0.015), but posthoc analysis did not reveal any differences. There was a significantly greater variability in the number of branch points and ends in the vmDR and MR subfields (Bartlett’s test for equal variances = 11.10, p = 0.011). Scatter plot data demonstrate that the range for number of branch points in vmDR and MR was very large, from 1 to 12 branch points, whereas in the lwDR and the dmDR the number was between 0 and 6 (Figure 14B). The same situation existed for the ends, but to a lesser degree (Figure 14C). Total dendritic length was significantly different, i.e., sum of the length of all dendritic processes, with MR having the shortest total dendrite length compared to the remaining subfields (ANOVA, F(3,49)=5.1, p = 0.004, vmDR = lwDR = dmDR > MR).
Figure 14. Dendrite length and branching in 5-HT neurons across raphe subfields.

(A) The number of primary dendrites (dendrites extending directly from the soma) did not differ across subfield. (B–C) The number of ends and branch points of 5-HT neurons showed a range of variability across the subfields. The dendritic arbor varied between individual neurons within the MR and vmDR, indicating a greater variety in the dendritic architecture of cells within these subfields. In comparison, dendritic arbors of individual neurons within the lwDR and dmDR 5-HT were similar within each subfield. (D) The total dendritic length of neurons in the MR was shorter than that of all the other subfields (*p<0.05). N=11–14 neurons/group.
3.3.4: Sholl and Polar Histograms
To examine whether the dendritic arbor of 5-HT neurons showed a directional preference, polar histograms were created for each neuron and an average polar histogram generated for each subfield (Figure 15A). The dendritic arbor of vmDR and MR neurons generally extended in the dorsal or ventral direction. Dendrites of lwDR and dmDR 5-HT neurons extended in a wider variety of directions. Sholl analysis was also performed (Figure 15B, B1, and B2). The number of times the dendrites cross each radial segment (20 μ) was determined as well as the length of each dendritic segment within each radii. Total dendritic length within each radii differed between subfields (Figure 15, B1). In MR, the length of dendrite within a given radii decreased more sharply compared to the decrease seen in 5-HT neurons within other subfields. This is particularly true about 100 μ from the cell body, indicating that most of the dendritic arbor of MR neurons is found closer to the cell body compared to other 5-HT cells (Figure B1, ANOVA, F(183,2928)=1.9, p < 0.0001). The number of intersections for each radii differed between subfields (ANOVA, F(39,637) = 6.5, p < 0.0001). Dendrites of vmDR and MR neurons had more intersections of radial segments close to the center indicating a more complex dendritic arbor closer to the cell soma (Figure 15, B2). Additionally, MR had fewer intersections on radial segments at a greater distance from the center compared to the neurons from the vmDR, lwDR, and dmDR. This is consistent with the shorter overall length of dendrites on MR neurons. Dendrites of lwDR and dmDR neurons had a low number of intersections at radial segments close to the cell body (Figure 15, B2). Thus, in lwDR and dmDR neurons, dendritic complexity and branching is more complex at distances further away from the soma.
Figure 15. Polar histogram and Scholl analysis of 5-HT neurons across raphe subfields.

(A) Composite polar histograms of neurons from each raphe subfield. Dendritic arbors from neurons in the vmDR and MR tended to extend preferentially in the ventral and dorsal direction. In comparison, lwDR and dmDR neurons did not show a strong directional preference and extended in a wider variety of directions. (A1) Representative traces of neurons from each subfield. Neurons were traced using Neurolucida software and polar histograms generated for each neuron. (A2) A composite tracing of all 5-HT neurons within a particular subfield. Individual tracings were overlayed on top of each other, centered on their cell bodies, and maintained the same scale. (B) Schematic of representative neuron used for Sholl analysis. (B1) Dendrites of MR 5-HT neurons tended to remain closer to the cell body with a sharp decrease in the length of dendrite found in a given radii after 100 μm compared to neurons in the other subfields. (B2) Dendrites of vmDR and MR neurons had a greater number of intersections at radial segments close to the center indicating branching closer to the cell soma. MR had fewer intersections at radial segments further from the center compared to the neurons from the other subfields. Dendrites of lwDR and dmDR neurons had a low number of intersections at radial segments close to the center indicating that dendritic branching occurred further from the soma of these neurons (*p<0.05). N=10–14 neurons/group.
4.0 Discussion
Despite similarities, the MR and subfields of the DR are clearly not uniform in terms of the active and passive characteristics of 5-HT and non-5-HT neurons, localization of GABA neurons, synaptic innervation by GABA and glutamate, and dendritic structure. Although 5-HT neurons possess some similar physiological properties, important differences exist between subfields. In most cases, non-5-HT neurons that are interspersed among 5-HT neurons greatly resemble 5-HT neurons, although significant differences between 5-HT and non-5-HT cells exist within certain subfields. GABA neurons were distributed throughout the raphe, usually in areas devoid of 5-HT neurons. Although, GABAergic synaptic innervation was dense throughout the raphe, distribution of the GABA transporters (GAT1 and GAT3) differed. In contrast, glutamate neurons, as defined by vGlut3, were intermixed and co-localized with 5-HT neurons within all subfields. Finally, the dendritic arbor of the 5-HT neurons was distinct between subfields. Although many experimental paradigms have treated 5-HT neurons as a homogenous population, these data support a model of the raphe as an area composed of functionally distinct subpopulations of 5-HT and non-5-HT neurons, in part delineated by subfield. Thus, understanding the local circuitry within and between the raphe subfields provides an important foundation for understanding how the raphe modulates behavior and for defining which aspects of the circuitry are altered during the etiology of psychological disorders.
4.1 Electrophysiology
Traditionally, defining characteristics of 5-HT neurons include a large membrane resistance, large AHP, long AP duration, and hyperpolarization in response to 5-HT1A receptor activation (Aghajanian and Lakoski, 1984; Aghajanian and Vandermaelen, 1982). Using traditionally-defined electrophysiological parameters alone (Vandermaelen and Aghajanian, 1983), we were not able to reliably characterize individual neurons as 5-HT or non-5-HT. However, in all raphe subfields, differences in cellular characteristics between populations of 5-HT and non-5-HT neurons existed, though the magnitude of these differences varied. Non-5-HT neurons had a more depolarized resting membrane potential and a smaller activation gap than 5-HT neurons, indicating that non-5-HT neurons would be more responsive to excitatory input. However, within the vmDR and the lwDR, non-5-HT neurons had characteristics that were similar to 5-HT neurons. In contrast, the difference in cellular characteristics between 5-HT and non-5-HT cell populations was greatest and most consistent within dmDR and MR. 5-HT neurons within the dmDR had a hyperpolarized resting membrane potential and a large activation gap, indicating that they would be less responsive to synaptic input and would require greater afferent input to generate an action potential compared to 5-HT neurons in other regions.
These differences in cellular characteristics have functional implications for how we understand signaling within the raphe. For example, vGlut3 is strongly expressed in both the DR and MR, and in both regions vGlut3 and TPH2 or serotonin have similar levels of colocalization (Amilhon et al., 2010; Commons, 2009; Fremeau et al., 2002; Hioki et al., 2010). However, despite these similarities, the variations in cellular characteristics, which regulate the ability and ease with which a given population of cells fire an action potential, suggests that functional control of signaling of these cells would differ. Thus, dmDR neurons would most likely be less responsive to synaptic input than MR cells. These subfield specific variations in cellular characteristics indicate that despite similar expression patterns of particular markers, regulation of 5-HT and non-5-HT neuron signaling is controlled not only by synaptic input and receptor expression, but also by expression of the particular ion channels that define the cellular characteristics.
The variations in cellular characteristics between and within the different neuron types within a subfield have the potential to impact the control of several behaviors. The dmDR and lwDR subfields have been implicated in certain drug actions, response to stressors and anxiety related behaviors, such as social defeat, anxiogenic drugs, urocortin II, inhibition of sympathomimetic responses and uncontrollable stress (Abrams et al., 2005; Gardner et al., 2005; Hammack et al., 2003; Johnson et al., 2004; Lowry et al., 2005; Maier and Watkins, 2005; Staub et al., 2005). Non-5-HT neurons, i.e., GABA neurons, within the lwDR are implicated in the circuitry regulating swim stress induced immobility (Roche et al., 2003), and in mediating the actions of the stress hormone CRF in this region (Waselus et al., 2005).
The response to 5-HT1A receptor activation was found in both 5-HT and non-5-HT neurons as has been previously reported (Beck et al., 2004; Kirby et al., 2000; Marinelli et al., 2004). The magnitude of the response varied across the subfields. For 5-HT neurons, the greatest response was seen in vmDR. Non-5-HT neurons within the dmDR and the MR did not exhibit any significant hyperpolarization. The 5-HT1A receptor is altered by behavioral stress, stress hormones and antidepressant treatment (Bermack et al., 2004; Blier and Ward, 2003; Davidson and Stamford, 1998; Greenwood et al., 2005; Jolas et al., 1994; Laaris et al., 1995; Laaris et al., 1997; Lanfumey et al., 1999; Le Poul et al., 1999). Additionally, recent studies have demonstrated that the 5-HT1A autoreceptor, not the heteroreceptor, is important for stress resilience and the etiology of mood disorders (Liu et al., 2010; Richardson-Jones et al., 2011). However, the majority of these studies were conducted in the midline of the raphe without examining changes in the various subfields. Differences in magnitude of the 5-HT1A autoreceptor response across raphe subfields would suggest that selective activation or disruption of this receptor in certain subfields has the potential to produce a greater impact. Future research is needed to determine which population of 5-HT1A receptor-containing neurons within the different subfields is altered by its elimination in knockout mice, by particular stressors or antidepressant treatment. Additionally, it is necessary to determine if these alterations are limited to 5-HT1A autoreceptors or extend to 5-HT1A heteroreceptors within vmDR or lwDR. Since the magnitude of the response was different between the subfields, the efficacy of the 5-HT1A receptor coupling to its second messenger system is also a potential site for selective modulation. Previously our lab and others have demonstrated that alterations in the 5-HT1A receptor-mediated response by stress hormones occurs at downstream sites (Lanfumey et al., 1999; Okuhara and Beck, 1998).
While slice recording allows for efficient access to neurons across the different raphe subfields, the current data should be interpreted with the recognition that some of the afferent input to the raphe neurons has been severed. Thus, while a portion of the local circuitry remains intact, the relative influence of regions outside the slice may not be reflected in the data. This limitation may lead to some differences between the electrophysiological observations in the slice compared to an in vivo preparation. Nevertheless, consistent with our general observation of differences between the raphe subfields, reports utilizing in vivo data (Hajos et al., 2007; Kocsis et al., 2006) have shown that the raphe subfields possess distinct properties. Additionally, some studies suggest that raphe neurons are organized topographically, with rostro-caudal differences in excitability and in the magnitude of the 5-CT response existing within a given subfield (Crawford et al., 2010; Hale and Lowry, 2011). Thus, it is likely that our data underestimates the degree of electrophysiological heterogeneity between cells within a particular raphe subfield.
4.2 GABA and glutamate
One of the main neurotransmitter systems modulating the activity of 5-HT and non-5-HT neurons in the raphe is GABA. Although a portion of this inhibitory input originates outside the raphe, whole cell recordings in slices and immunohistochemical staining have shown that local GABA circuits have a part in governing raphe signaling (Allers and Sharp, 2003; Belin et al., 1979; Belin et al., 1983; Day et al., 2004; Fu et al., 2010; Harandi et al., 1987; Lemos et al., 2006; Stamp and Semba, 1995). The distribution of GABA neurons was generally distinct from that of the 5-HT neurons, with GABAergic populations located just lateral to 5-HT subfields in both the DR and MR (Allers and Sharp, 2003; Day et al., 2004; Fu et al., 2010). Nevertheless, some limited co-localization with GABA and 5-HT was observed, consistent with other reports (Belin et al., 1983; Fu et al., 2010; Harandi et al., 1987; Nanopoulos et al., 1982; Stamp and Semba, 1995). Thus, a subset of raphe neurons could release both neurotransmitters within the raphe as well as in the limbic forebrain projection sites. Additionally, although GABA neurons in the raphe were primarily thought to function as interneurons, some studies provide evidence that GABA neurons in the raphe may project to forebrain structures (Puig et al., 2005; Van Bockstaele et al., 1993). However, whether GABA is released by raphe neurons themselves or by forebrain interneurons which receive raphe afferents has not been conclusively determined. 5-HT is clearly an important communicator from the raphe. However, whether this is true of GABA neurons in the raphe remains to be determined.
This is the first report of the distribution of the GABAergic afferent input in the raphe using the GABA transporters, GAT1 and GAT3. GABA transporters remove GABA from the synaptic cleft and serve as a mechanism to regulate inhibitory signaling. Our results showed that in the rostral and caudal DR, GAT1 was preferentially expressed in regions lateral to the population of 5-HT neurons. Thus in the rostral and caudal DR, GAT1 is more likely to regulate inhibitory input to non-5-HT neurons. In middle raphe sections, GAT1 was found throughout the entire region and thus most likely regulates GABA input to both 5-HT and non-5-HT cells. In comparison, GAT3 was evenly distributed throughout the entire raphe and alterations in GAT3 would affect GABAergic input to a wider range of neuronal phenotypes. Both GAT1 and GAT3 were found in the MR though staining was less intense than in the DR. Most studies of the function of GABA transporters have been conducted in the hippocampus. The GAT1 molecules are located on presynaptic boutons and they shape the time course of evoked inhibitory postsynaptic currents and suppress tonic conductance at extrasynaptic GABAA receptors (Chiu et al., 2002). In GAT1 knockout mice there is enhanced GABA spillover and an increase in presynaptic GABAB activity (Alle and Geiger, 2007; Chiu et al., 2002; Gonzalez-Burgos, 2010). Long term deficiency of GAT1 in knockout mice leads to enhanced extracellular GABA levels and activation of extrasynaptic GABAA receptors that produce tonic current; in addition, due to the chronic elevation of extracellular GABA, phasic inhibition by GABAB receptors is decreased due to receptor downregulation (Jensen et al., 2003). GAT-1 and GAT-3 differ in inhibitor sensitivities, ionic dependencies, and distribution throughout the nervous system (Conti et al., 2004). Furthermore, GAT1 and GAT3 differentially regulate GABA transmission. For example, GAT1 can selectively modulate IPSC decay time and is generally associated with regulating GABA clearance at synapses (Jin et al., 2011). In comparison, GAT3 regulates both decay time and amplitude and has a role in extracellular GABA clearance (Jin et al., 2011). Thus, the regionally specific distribution and expression of GAT1 and GAT3 In the raphe may represent another mechanism with which GABA input to the raphe subfields can be differentially governed. GAT1 knockout mice show reduced anxiety and depressive behavior, but have increased nervousness and tremors (Chiu et al., 2005; Liu et al., 2007). Downregulation of GAT3 expression has been associated with learned helplessness, a model of depression (Zink et al., 2009). Both GAT1 and GAT3 have been indicated as potential targets for drug therapy in treatment of neurological and psychiatric disorders. Thus, given the key role of serotonin and the raphe in these disorders, knowledge of the respective topographical distribution of GAT1 and GAT3 in the raphe provides a starting point for future studies to determine their impact on specific 5-HT and non-5-HT populations.
Serotonin signaling is also regulated by glutamate (Lee et al., 2003; Lemos et al., 2006; Liu et al., 2002; Pan and Williams, 1989; Tao and Auerbach, 2003). Previously we demonstrated the differential distribution of vGlut1 and 2 within the raphe, with vGlut1 synapsing predominantly on small-caliber distal dendrites and vGlut2 on larger caliber proximal dendritic shafts. Only a small fraction of the glutamatergic puncta are found on TPH containing dendrites (Commons et al., 2005). Robust staining for vGlut3 was found in 5-HT DR and MR cell bodies throughout the raphe, as previously reported (Amilhon et al., 2010; Commons, 2009; Fremeau et al., 2002; Hioki et al., 2010). Puncta of vGlut3 were extensively found throughout the DR on cell bodies and dendrites, but less so in the MR. Consistent with this result, our previous electrophysiological data has shown a greater frequency of glutamatergic synaptic activity in vmDR compared to MR (Lemos et al., 2006). Differences in the distribution of vGlut1, 2, and 3 may have implications for the regulation of glutamatergic signaling at specific synapses. Expression levels of vGlut 1 and 2 control quantal size and the efficacy of neurotransmission (Weston et al., 2011). However, vGlut 1 and 2 expression levels can be regulated in opposite ways with levels of one transporter increasing and the other decreasing in response to the same stimulus (Fremeau et al., 2004). Thus, expression levels of vGlut1 and 2 can play a significant role in regulating glutamatergic signaling at particular synapses. Similarly, vGlut3, though generally colocalized with other neurotransmitters, has also been shown to regulate glutamatergic neurotransmission in several systems including the medullary raphe and in inner hair cells (Nakamura et al., 2004; Ruel et al., 2008; Seal et al., 2008). Taken together this evidence suggests that one potential contributing factor to the variation in the relative glutamatergic input to 5-HT neurons across the raphe may be the differential expression of vGlut 1–3 within the subfields. Further research would be needed to define and determine the precise role of vGlut1, 2, and 3 in governing neurotransmission within the raphe.
Recent studies however, determined that co-localization of vGlut3 and 5-HT within axons is not very distinct throughout the raphe, but does occur in the ependyma and in the caudal raphe (Amilhon et al., 2010; Commons, 2009); co-localization is present in some terminal regions, i.e., the cortex and hippocampus (Amilhon et al., 2010). These data indicate that glutamate may be co-released with 5-HT primarily in the caudal raphe and in projection areas. A recent study using optogenetics demonstrated glutamate/serotonin co-release in the hippocampus (Varga et al., 2009). Several recent investigations have implicated vGlut3 in anxiety disorders; vGlut3 knockout mice exhibit anxiety type behavior and a decrease in 5-HT1A receptor mediated response in the raphe (Amilhon et al., 2010). Further experiments are necessary to determine if 5-HT neurons within the raphe release glutamate, which raphe neurons are activated by local glutamatergic neurons and whether subfield specific differences exist.
4.3 Morphology
The basic structure and organization of the dendritic arbors of 5-HT neurons differed between subfields. The architecture of a neuron’s dendritic arbor determines how a cell receives and processes input. Figure 16 summarizes the neurochemical distribution of vGlut3, GAD67, GAT1 and GAT3 with the composite morphology of the subfield neurons drawn to scale. MR had the shortest dendrites with most of its arbor close to the cell soma. This organization presents a physical limitation and MR 5-HT cells most likely receive most of their input from axons within or close to MR itself. In comparison dmDR and lwDR neurons had widely-dispersed dendritic arbors that extended in all directions and were likely to receive input from axons both within and outside of their subfield demarcation. Thus in the rostral and caudal DR where GAT1 fibers are generally found lateral to the midline, dmDR and lwDR neurons would receive input from this population of GABA neurons whereas vmDR cells with shorter dendrites in a predominantly dorsal-ventral orientation may not.
Figure 16. Schematic of rostral, middle, and caudal sections of raphe.

Schematic of vGlut3 (pink), GAD67, (blue), GAT1 (red and orange), and GAT3 (yellow and orange) expression overlayed on diagrams of rostral, middle, and caudal raphe. A scale drawing of tracings from vmDR, lwDR, dmDR and MR 5-HT neurons with their dendritic arbor is also included. Note that the drawings are composed of an overlay of all tracings from a specific subfield in order to provide a general idea of the range and direction of dendritic arborization of 5-HT neurons in each subfield. Diagram of raphe sections adapted from Paxinos and Watson (1998).
Many studies have implicated the mid to caudal dmDR and lwDR in stress related behavioral tasks or disorders, such as the Porsolt swim test, uncontrollable stress and social defeat (Bouwknecht et al., 2007; Gardner et al., 2005; Lowry et al., 2008; Maier and Watkins, 2005; Paul et al., 2011; Roche et al., 2003). Neuronal projections to the DR from the medial prefrontal cortex and lateral habenula provide two key routes by which information processed by mood-regulatory, cortico-limbic-striatal circuits input into the 5-HT system (Celada et al., 2001; Jankowski and Sesack, 2004; Varga et al., 2003). These nuclei inhibit 5-HT neurons by activating local GABAergic inputs to 5-HT cells. Thus, the distribution of 5-HT neurons, the extent of their dendritic arbors, and the relative location of GABA terminals within the subfields is crucial for understanding the circuitry mediating stress and mood disorders. The morphological and neurochemical information provided here forms a basis for further experiments to explore how the local circuitry and topographical organization of the raphe governs its communication with other brain regions.
5.0 Conclusion
The electrophysiological properties, distribution of excitatory and inhibitory inputs, and dendritic architecture of 5-HT neurons differ across subfield. Additionally 5-HT neurons are distinct from non-5-HT cells although the magnitude of this difference is greater in some raphe subfields. Previous studies have often treated 5-HT neurons as a homogenous population. However, comparison of the projection patterns from various raphe subfields in conjunction with behavioral evidence suggests that distinct local circuits within the raphe subfields may govern different homeostatic mechanisms and aspects of behavior. Thus, understanding the topographical organization of 5-HT and non-5-HT neurons across the various raphe subfields, their cellular characteristics, and the relative distribution of their inputs is crucial in providing insight into the mechanisms through which this area governs a wide variety of behaviors.
Research highlights.
Raphe neurons in different subfields are often treated as a homogenous population.
We show that properties of 5-HT and non-5-HT neurons differ across subfields.
Distribution of input to 5-HT and non-5-HT neurons also varies by subfield.
Topographical organization of the raphe reveals subfield specific mechanisms.
Different raphe subfields have been proposed to control a variety of behaviors.
Acknowledgments
This work is funded by the National Institute of Mental Health under grant number MH0754047.
Role of the Funding Source
The funding source for this work, the National Institute of Mental Health, did not play any role in study design; collection, analysis, and interpretation of data; writing of the report; or in the decision to submit the paper for publication.
Abbreviations
- DR
dorsal raphe
- vmDR
ventromedial dorsal raphe
- lwDR
lateral wing dorsal raphe
- dmDR
dorsomedial dorsal raphe
- MR
medial raphe
- vGlut3
vesicular glutamate transporter 3
Footnotes
Disclosure Statement
This work is funded by the National Institute of Mental Health under grant number MH0754047. The authors have nothing else to disclose.
References
- Abrams JK, Johnson PL, Hay-Schmidt A, Mikkelsen JD, Shekhar A, Lowry CA. Serotonergic systems associated with arousal and vigilance behaviors following administration of anxiogenic drugs. Neuroscience. 2005;133:983–997. doi: 10.1016/j.neuroscience.2005.03.025. [DOI] [PubMed] [Google Scholar]
- Abrams JK, Johnson PL, Hollis JH, Lowry CA. Anatomic and functional topography of the dorsal raphe nucleus. Annals of the New York Academy of Sciences. 2004;1018:46–57. doi: 10.1196/annals.1296.005. [DOI] [PubMed] [Google Scholar]
- Adell A, Casanovas JM, Artigas F. Comparative study in the rat of the actions of different types of stress on the release of 5-HT in raphe nuclei and forebrain areas. Neuropharmacology. 1997;36:735–741. doi: 10.1016/s0028-3908(97)00048-8. [DOI] [PubMed] [Google Scholar]
- Aghajanian GK, Lakoski JM. Hyperpolarization of serotonergic neurons by serotonin and LSD: studies in brain slices showing increased K+ conductance. Brain research. 1984;305:181–185. doi: 10.1016/0006-8993(84)91137-5. [DOI] [PubMed] [Google Scholar]
- Aghajanian GK, Vandermaelen CP. Intracellular identification of central noradrenergic and serotonergic neurons by a new double labeling procedure. Journal of Neuroscience. 1982;2:1786–1792. doi: 10.1523/JNEUROSCI.02-12-01786.1982. [DOI] [PMC free article] [PubMed] [Google Scholar]
- Alle H, Geiger JR. GABAergic spill-over transmission onto hippocampal mossy fiber boutons. Journal of Neuroscience. 2007;27:942–950. doi: 10.1523/JNEUROSCI.4996-06.2007. [DOI] [PMC free article] [PubMed] [Google Scholar]
- Allers KA, Sharp T. Neurochemical and anatomical identification of fast- and slow-firing neurones in the rat dorsal raphe nucleus using juxtacellular labelling methods in vivo. Neuroscience. 2003;122:193–204. doi: 10.1016/s0306-4522(03)00518-9. [DOI] [PubMed] [Google Scholar]
- Amilhon B, Lepicard E, Renoir T, Mongeau R, Popa D, Poirel O, Miot S, Gras C, Gardier AM, Gallego J, Hamon M, Lanfumey L, Gasnier B, Giros B, El Mestikawy S. VGLUT3 (vesicular glutamate transporter type 3) contribution to the regulation of serotonergic transmission and anxiety. Journal of Neuroscience. 2010;30:2198–2210. doi: 10.1523/JNEUROSCI.5196-09.2010. [DOI] [PMC free article] [PubMed] [Google Scholar]
- Andrade TG, Graeff FG. Effect of electrolytic and neurotoxic lesions of the median raphe nucleus on anxiety and stress. Pharmacology, Biochemistry & Behavior. 2001;70:1–14. doi: 10.1016/s0091-3057(01)00512-3. [DOI] [PubMed] [Google Scholar]
- Andrade TG, Silva AM, Silva CL, Graeff FG. Effect of electrolytic lesion of the median raphe nucleus on behavioral and physiological measures of stress. Acta Physiol Pharmacol Ther Latinoam. 1999;49:279–289. [PubMed] [Google Scholar]
- Andrews N, File SE, Fernandes C, Gonzalez LE, Barnes NM. Evidence that the median raphe nucleus--dorsal hippocampal pathway mediates diazepam withdrawal-induced anxiety. Psychopharmacology. 1997;130:228–234. doi: 10.1007/s002130050233. [DOI] [PubMed] [Google Scholar]
- Andrews N, Hogg S, Gonzalez LE, File SE. 5-HT 1A receptors in the median raphe nucleus and dorsal hippocampus may mediate anxiolytic and anxiogenic behaviours respectively. European Journal of Pharmacology. 1994;264:259–264. doi: 10.1016/0014-2999(94)00473-0. [DOI] [PubMed] [Google Scholar]
- Azmitia EC, Segal M. An autoradiographic analysis of the differential ascending projections of the dorsal and median raphe nuclei in the rat. Journal of Comparative Neurology. 1978;179:641–667. doi: 10.1002/cne.901790311. [DOI] [PubMed] [Google Scholar]
- Beck SG, Pan YZ, Akanwa AC, Kirby LG. Median and dorsal raphe neurons are not electrophysiologically identical. Journal of Neurophysiology. 2004;91:994–1005. doi: 10.1152/jn.00744.2003. [DOI] [PMC free article] [PubMed] [Google Scholar]
- Belin MF, Aguera M, Tappaz M, McRae-Degueurce A, Bobillier P, Pujol JF. GABA-accumulating neurons in the nucleus raphe dorsalis and periaqueductal gray in the rat: a biochemical and radioautographic study. Brain research. 1979;170:279–297. doi: 10.1016/0006-8993(79)90107-0. [DOI] [PubMed] [Google Scholar]
- Belin MF, Nanopoulos D, Didier M, Aguera M, Steinbusch H, Verhofstad A, Maitre M, Pujol JF. Immunohistochemical evidence for the presence of gamma-aminobutyric acid and serotonin in one nerve cell. A study on the raphe nuclei of the rat using antibodies to glutamate decarboxylase and serotonin. Brain research. 1983;275:329–339. doi: 10.1016/0006-8993(83)90994-0. [DOI] [PubMed] [Google Scholar]
- Bermack JE, Haddjeri N, Debonnel G. Effects of the potential antidepressant OPC-14523 [1-[3-[4-(3-chlorophenyl)-1-piperazinyl]propyl]-5-methoxy-3,4-dihydro-2-qu inolinone monomethanesulfonate] a combined sigma and 5-HT1A ligand: modulation of neuronal activity in the dorsal raphe nucleus. The Journal of Pharmacology and Experimental Therapeutics. 2004;310:578–583. doi: 10.1124/jpet.104.066472. [DOI] [PubMed] [Google Scholar]
- Blier P, Ward NM. Is there a role for 5-HT1A agonists in the treatment of depression? Biological Psychiatry. 2003;53:193–203. doi: 10.1016/s0006-3223(02)01643-8. [DOI] [PubMed] [Google Scholar]
- Bouwknecht JA, Spiga F, Staub DR, Hale MW, Shekhar A, Lowry CA. Differential effects of exposure to low-light or high-light open-field on anxiety-related behaviors: relationship to c-Fos expression in serotonergic and non-serotonergic neurons in the dorsal raphe nucleus. Brain research bulletin. 2007;72:32–43. doi: 10.1016/j.brainresbull.2006.12.009. [DOI] [PMC free article] [PubMed] [Google Scholar]
- Buhot MC. Serotonin receptors in cognitive behaviors. Current Opinion in Neurobiology. 1997;7:243–254. doi: 10.1016/s0959-4388(97)80013-x. [DOI] [PubMed] [Google Scholar]
- Cardin JA, Carlen M, Meletis K, Knoblich U, Zhang F, Deisseroth K, Tsai LH, Moore CI. Targeted optogenetic stimulation and recording of neurons in vivo using cell-type-specific expression of Channelrhodopsin-2. Nat Protoc. 2010;5:247–254. doi: 10.1038/nprot.2009.228. [DOI] [PMC free article] [PubMed] [Google Scholar]
- Celada P, Puig MV, Casanovas JM, Guillazo G, Artigas F. Control of dorsal raphe serotonergic neurons by the medial prefrontal cortex: Involvement of serotonin-1A, GABA(A), and glutamate receptors. Journal of Neuroscience. 2001;21:9917–9929. doi: 10.1523/JNEUROSCI.21-24-09917.2001. [DOI] [PMC free article] [PubMed] [Google Scholar]
- Chiu CS, Brickley S, Jensen K, Southwell A, McKinney S, Cull-Candy S, Mody I, Lester HA. GABA transporter deficiency causes tremor, ataxia, nervousness, and increased GABA-induced tonic conductance in cerebellum. The Journal of neuroscience : the official journal of the Society for Neuroscience. 2005;25:3234–3245. doi: 10.1523/JNEUROSCI.3364-04.2005. [DOI] [PMC free article] [PubMed] [Google Scholar]
- Chiu CS, Jensen K, Sokolova I, Wang D, Li M, Deshpande P, Davidson N, Mody I, Quick MW, Quake SR, Lester HA. Number, density, and surface/cytoplasmic distribution of GABA transporters at presynaptic structures of knock-in mice carrying GABA transporter subtype 1-green fluorescent protein fusions. The Journal of neuroscience : the official journal of the Society for Neuroscience. 2002;22:10251–10266. doi: 10.1523/JNEUROSCI.22-23-10251.2002. [DOI] [PMC free article] [PubMed] [Google Scholar]
- Commons KG. Locally collateralizing glutamate neurons in the dorsal raphe nucleus responsive to substance P contain vesicular glutamate transporter 3 (VGLUT3) Journal of Chemical Neuroanatomy. 2009;38:273–281. doi: 10.1016/j.jchemneu.2009.05.005. [DOI] [PMC free article] [PubMed] [Google Scholar]
- Commons KG, Beck SG, Bey VW. Two populations of glutamatergic axons in the rat dorsal raphe nucleus defined by the vesicular glutamate transporters 1 and 2. European Journal of Neuroscience. 2005;21:1577–1586. doi: 10.1111/j.1460-9568.2005.03991.x. [DOI] [PMC free article] [PubMed] [Google Scholar]
- Commons KG, Connolley KR, Valentino RJ. A neurochemically distinct dorsal raphe-limbic circuit with a potential role in affective disorders. Neuropharmacology. 2003;28:206–215. doi: 10.1038/sj.npp.1300045. [DOI] [PubMed] [Google Scholar]
- Conti F, Minelli A, Melone M. GABA transporters in the mammalian cerebral cortex: localization, development and pathological implications. Brain research. Brain research reviews. 2004;45:196–212. doi: 10.1016/j.brainresrev.2004.03.003. [DOI] [PubMed] [Google Scholar]
- Crawford LK, Craige CP, Beck SG. Increased intrinsic excitability of lateral wing serotonin neurons of the dorsal raphe: a mechanism for selective activation in stress circuits. J Neurophysiol. 2010;103:2652–2663. doi: 10.1152/jn.01132.2009. [DOI] [PMC free article] [PubMed] [Google Scholar]
- Dahlstrom A, Fuxe K. Evidence for the existence of monoamine-containing neurons in the central nervous system - I. Demonstration of monoamines in cell bodies of brain stem neurons. Acta Physiol Scand. 1964;62:1–55. [PubMed] [Google Scholar]
- Datiche F, Luppi PH, Cattarelli M. Serotonergic and non-serotonergic projections from the raphe nuclei to the piriform cortex in the rat: a cholera toxin B subunit (CTb) and 5-HT immunohistochemical study. Brain research. 1995;671:27–37. doi: 10.1016/0006-8993(94)01293-q. [DOI] [PubMed] [Google Scholar]
- Davidson C, Stamford JA. Contrasting effects of chronic paroxetine on 5-HT 1A control of dorsal raphe cell firing and 5-HT release. Neuroreport. 1998;9:2535–2538. doi: 10.1097/00001756-199808030-00020. [DOI] [PubMed] [Google Scholar]
- Day HE, Greenwood BN, Hammack SE, Watkins LR, Fleshner M, Maier SF, Campeau S. Differential expression of 5-HT 1A, a1b adrenergic, CRH-R1 and DRH-R2 receptor mRNA in serotonergic, GABAergic and catecholaminergic cells of the rat dorsal raphe neucleus. Society for Neuroscience Abstracts. 2003:713.4. doi: 10.1002/cne.20138. [DOI] [PMC free article] [PubMed] [Google Scholar]
- Day HE, Greenwood BN, Hammack SE, Watkins LR, Fleshner M, Maier SF, Campeau S. Differential expression of 5HT-1A, alpha 1b adrenergic, CRF-R1, and CRF-R2 receptor mRNA in serotonergic, gamma-aminobutyric acidergic, and catecholaminergic cells of the rat dorsal raphe nucleus. Journal of Comparative Neurology. 2004;474:364–378. doi: 10.1002/cne.20138. [DOI] [PMC free article] [PubMed] [Google Scholar]
- Descarries L, Watkins KC, Garcia S, Beaudet A. The serotonin neurons in nucleus raphe dorsalis of adult rat: a light and electron microscope radioautographic study. Journal of Comparative Neurology. 1982;207:239–254. doi: 10.1002/cne.902070305. [DOI] [PubMed] [Google Scholar]
- Diaz-Cintra S, Cintra L, Kemper T, Resnick O, Morgane PJ. Nucleus raphe dorsalis: a morphometric Golgi study in rats of three age groups. Brain research. 1981;207:1–16. doi: 10.1016/0006-8993(81)90675-2. [DOI] [PubMed] [Google Scholar]
- File SE, Gonzalez LE. Anxiolytic effects in the plus-maze of 5-HT 1A -receptor ligands in dorsal raphe and ventral hippocampus. Pharmacology, Biochemistry & Behavior. 1996;54:123–128. doi: 10.1016/0091-3057(95)02108-6. [DOI] [PubMed] [Google Scholar]
- Fremeau RT, Jr, Burman J, Qureshi T, Tran CH, Proctor J, Johnson J, Zhang H, Sulzer D, Copenhagen DR, Storm-Mathisen J, Reimer RJ, Chaudhry FA, Edwards RH. The identification of vesicular glutamate transporter 3 suggests novel modes of signaling by glutamate. Proc Natl Acad Sci USA. 2002;99:14488–14493. doi: 10.1073/pnas.222546799. [DOI] [PMC free article] [PubMed] [Google Scholar]
- Fremeau RT, Jr, Kam K, Qureshi T, Johnson J, Copenhagen DR, Storm-Mathisen J, Chaudhry FA, Nicoll RA, Edwards RH. Vesicular glutamate transporters 1 and 2 target to functionally distinct synaptic release sites. Science. 2004;304:1815–1819. doi: 10.1126/science.1097468. [DOI] [PubMed] [Google Scholar]
- Fu W, Le Maitre E, Fabre V, Bernard JF, David Xu ZQ, Hokfelt T. Chemical neuroanatomy of the dorsal raphe nucleus and adjacent structures of the mouse brain. The Journal of comparative neurology. 2010;518:3464–3494. doi: 10.1002/cne.22407. [DOI] [PubMed] [Google Scholar]
- Gardner KL, Thrivikraman KV, Lightman SL, Plotsky PM, Lowry CA. Early life experience alters behavior during social defeat: focus on serotonergic systems. Neuroscience. 2005;136:181–191. doi: 10.1016/j.neuroscience.2005.07.042. [DOI] [PubMed] [Google Scholar]
- Gartside SE, Hajos-Korcsok E, Bagdy E, Harsing LG, Jr, Sharp T, Hajos M. Neurochemical and electrophysiological studies on the functional significance of burst firing in serotonergic neurons. Neuroscience. 2000;98:295–300. doi: 10.1016/s0306-4522(00)00060-9. [DOI] [PubMed] [Google Scholar]
- Gonzalez-Burgos G. GABA transporter GAT1: a crucial determinant of GABAB receptor activation in cortical circuits? Adv Pharmacol. 2010;58:175–204. doi: 10.1016/S1054-3589(10)58008-6. [DOI] [PubMed] [Google Scholar]
- Gonzalez LE, File SE. A five minute experience in the elevated plus-maze alters the state of the benzodiazepine receptor in the dorsal raphe nucleus. Journal of Neuroscience. 1997;17:1505–1511. doi: 10.1523/JNEUROSCI.17-04-01505.1997. [DOI] [PMC free article] [PubMed] [Google Scholar]
- Gonzalez LE, Ouagazzal AM, File SE. Stimulation of benzodiazepine receptors in the dorsal hippocampus and median raphe reveals differential GABAergic control in two animal tests of anxiety. European Journal of Neuroscience. 1998;10:3673–3680. doi: 10.1046/j.1460-9568.1998.00375.x. [DOI] [PubMed] [Google Scholar]
- Graeff FG, Guimaraes FS, De Andrade TG, Deakin JF. Role of 5-HT in stress, anxiety, and depression. Pharmacology, Biochemistry & Behavior. 1996;54:129–141. doi: 10.1016/0091-3057(95)02135-3. [DOI] [PubMed] [Google Scholar]
- Greenwood BN, Foley TE, Day HE, Burhans D, Brooks L, Campeau S, Fleshner M. Wheel running alters serotonin (5-HT) transporter, 5-HT1A, 5-HT1B, and alpha 1b-adrenergic receptor mRNA in the rat raphe nuclei. Biological Psychiatry. 2005;57:559–568. doi: 10.1016/j.biopsych.2004.11.025. [DOI] [PubMed] [Google Scholar]
- Hajos M, Allers KA, Jennings K, Sharp T, Charette G, Sik A, Kocsis B. Neurochemical identification of stereotypic burst-firing neurons in the rat dorsal raphe nucleus using juxtacellular labelling methods. European Journal of Neuroscience. 2007;25:119–126. doi: 10.1111/j.1460-9568.2006.05276.x. [DOI] [PubMed] [Google Scholar]
- Hajos M, Sharp T. Burst-firing activity of presumed 5-HT neurones of the rat dorsal raphe nucleus: electrophysiological analysis by antidromic stimulation. Brain research. 1996;740:162–168. doi: 10.1016/s0006-8993(96)00869-4. [DOI] [PubMed] [Google Scholar]
- Hale MW, Lowry CA. Functional topography of midbrain and pontine serotonergic systems: implications for synaptic regulation of serotonergic circuits. Psychopharmacology. 2011;213:243–264. doi: 10.1007/s00213-010-2089-z. [DOI] [PubMed] [Google Scholar]
- Hammack SE, Schmid MJ, LoPresti ML, Der-Avakian A, Pellymounter MA, Foster AC, Watkins LR, Maier SF. Corticotropin releasing hormone type 2 receptors in the dorsal raphe nucleus mediate the behavioral consequences of uncontrollable stress. Journal of Neuroscience. 2003;23:1019–1025. doi: 10.1523/JNEUROSCI.23-03-01019.2003. [DOI] [PMC free article] [PubMed] [Google Scholar]
- Harandi M, Aguera M, Gamrani H, Didier M, Maitre M, Calas A, Belin MF. gamma-Aminobutyric acid and 5-hydroxytryptamine interrelationship in the rat nucleus raphe dorsalis: combination of radioautographic and immunocytochemical techniques at light and electron microscopy levels. Neuroscience. 1987;21:237–251. doi: 10.1016/0306-4522(87)90336-8. [DOI] [PubMed] [Google Scholar]
- Herman JP, Cullinan WE. Neurocircuitry of stress: central control of the hypothalamo-pituitary- adrenocortical axis. Trends in Neuroscience. 1997;20:78–84. doi: 10.1016/s0166-2236(96)10069-2. [DOI] [PubMed] [Google Scholar]
- Hioki H, Nakamura H, Ma YF, Konno M, Hayakawa T, Nakamura KC, Fujiyama F, Kaneko T. Vesicular glutamate transporter 3-expressing nonserotonergic projection neurons constitute a subregion in the rat midbrain raphe nuclei. The Journal of comparative neurology. 2010;518:668–686. doi: 10.1002/cne.22237. [DOI] [PubMed] [Google Scholar]
- Imai H, Park MR, Steindler DA, Kitai ST. The morphology and divergent axonal organization of midbrain raphe projection neurons in the rat. Brain Dev. 1986a;8:343–354. doi: 10.1016/s0387-7604(86)80054-7. [DOI] [PubMed] [Google Scholar]
- Imai H, Steindler DA, Kitai ST. The organization of divergent axonal projections from the midbrain raphe nuclei in the rat. Journal of Comparative Neurology. 1986b;243:363–380. doi: 10.1002/cne.902430307. [DOI] [PubMed] [Google Scholar]
- Jankowski MP, Sesack SR. Prefrontal cortical projections to the rat dorsal raphe nucleus: ultrastructural features and associations with serotonin and gamma-aminobutyric acid neurons. J Comp Neurol. 2004;468:518–529. doi: 10.1002/cne.10976. [DOI] [PubMed] [Google Scholar]
- Jensen K, Chiu CS, Sokolova I, Lester HA, Mody I. GABA transporter-1 (GAT1)-deficient mice: differential tonic activation of GABAA versus GABAB receptors in the hippocampus. J Neurophysiol. 2003;90:2690–2701. doi: 10.1152/jn.00240.2003. [DOI] [PubMed] [Google Scholar]
- Jin XT, Pare JF, Smith Y. Differential localization and function of GABA transporters, GAT-1 and GAT-3, in the rat globus pallidus. The European journal of neuroscience. 2011 doi: 10.1111/j.1460-9568.2011.07636.x. [DOI] [PMC free article] [PubMed] [Google Scholar]
- Johnson P, Lowry C, Truitt W, Shekhar A. Disruption of GABAergic tone in the dorsomedial hypothalamus attenuates responses in a subset of serotonergic neurons in the dorsal raphe nucleus following lactate-induced panic. Journal of Psychopharmacology. 2008;22:642–652. doi: 10.1177/0269881107082900. [DOI] [PMC free article] [PubMed] [Google Scholar]
- Johnson PL, Lightman SL, Lowry CA. A functional subset of serotonergic neurons in the rat ventrolateral periaqueductal gray implicated in the inhibition of sympathoexcitation and panic. Annals of the New York Academy of Sciences. 2004;1018:58–64. doi: 10.1196/annals.1296.006. [DOI] [PubMed] [Google Scholar]
- Jolas T, Haj-Dahmane S, Kidd EJ, Langlois X, Lanfumey L, Fattaccini CM, Vantalon V, Laporte AM, Adrien J, Gozlan H. Central pre- and postsynaptic 5-HT 1A receptors in rats treated chronically with a novel antidepressant, cericlamine. The Journal of Pharmacology and Experimental Therapeutics. 1994;268:1432–1443. [PubMed] [Google Scholar]
- Kirby LG, Freeman-Daniels E, Lemos JC, Nunan JD, Lamy C, Akanwa A, Beck SG. Corticotropin-releasing factor increases GABA synaptic activity and induces inward current in 5-hydroxytryptamine dorsal raphe neurons. Journal of Neuroscience. 2008;28:12927–12937. doi: 10.1523/JNEUROSCI.2887-08.2008. [DOI] [PMC free article] [PubMed] [Google Scholar]
- Kirby LG, Pan YZ, Freeman-Daniels E, Rani S, Nunan JD, Akanwa A, Beck SG. Cellular effects of swim stress in the dorsal raphe nucleus. Psychoneuroendocrinology. 2007;32:712–723. doi: 10.1016/j.psyneuen.2007.05.001. [DOI] [PMC free article] [PubMed] [Google Scholar]
- Kirby LG, Pernar L, Valentino RJ, Beck SG. Distinguishing characteristics of serotonin and non-serotonin-containing cells in the dorsal raphe nucleus: electrophysiological and immunohistochemical studies. Neuroscience. 2003;116:669–683. doi: 10.1016/s0306-4522(02)00584-5. [DOI] [PMC free article] [PubMed] [Google Scholar]
- Kiss J, Csaki A, Bokor H, Kocsis K, Kocsis B. Possible glutamatergic/aspartatergic projections to the supramammillary nucleus and their origins in the rat studied by selective [(3)H]D-aspartate labelling and immunocytochemistry. Neuroscience. 2002;111:671–691. doi: 10.1016/s0306-4522(02)00037-4. [DOI] [PubMed] [Google Scholar]
- Kocsis B, Varga V, Dahan L, Sik A. Serotonergic neuron diversity: identification of raphe neurons with discharges time-locked to the hippocampal theta rhythm. Proc Natl Acad Sci USA. 2006;103:1059–1064. doi: 10.1073/pnas.0508360103. [DOI] [PMC free article] [PubMed] [Google Scholar]
- Kohler C, Steinbusch H. Identification of serotonin and non-serotonin-containing neurons of the mid-brain raphe projecting to the entorhinal area and the hippocampal formation. A combined immunohistochemical and fluorescent retrograde tracing study in the rat brain. Neuroscience. 1982;7:951–975. doi: 10.1016/0306-4522(82)90054-9. [DOI] [PubMed] [Google Scholar]
- Kroeze WK, Roth BL. The molecular biology of serotonin receptors: therapeutic implications for the interface of mood and psychosis. Biological Psychiatry. 1998;44:1128–1142. doi: 10.1016/s0006-3223(98)00132-2. [DOI] [PubMed] [Google Scholar]
- Laaris N, Haj-Dahmane S, Hamon M, Lanfumey L. Glucocorticoid receptor-mediated inhibition by corticosterone of 5-HT 1A autoreceptor functioning in the rat dorsal raphe nucleus. Neuropharmacology. 1995;34:1201–1210. doi: 10.1016/0028-3908(95)00095-n. [DOI] [PubMed] [Google Scholar]
- Laaris N, Le Poul E, Hamon M, Lanfumey L. Stress-induced alterations of somatodendritic 5-HT 1A autoreceptor sensitivity in the rat dorsal raphe nucleus--in vitro electrophysiological evidence. Fundamentals of Clinical Pharmacology. 1997;11:206–214. doi: 10.1111/j.1472-8206.1997.tb00187.x. [DOI] [PubMed] [Google Scholar]
- Lamy CM, Beck SG. Swim stress differentially blocks CRF receptor mediated responses in dorsal raphe nucleus. Psychoneuroendocrinology. 2010;35:1275–1428. doi: 10.1016/j.psyneuen.2010.03.003. [DOI] [PMC free article] [PubMed] [Google Scholar]
- Lanfumey L, Pardon MC, Laaris N, Joubert C, Hanoun N, Hamon M, Cohen-Salmon C. 5-HT 1A autoreceptor desensitization by chronic ultramild stress in mice. Neuroreport. 1999;10:3369–3374. doi: 10.1097/00001756-199911080-00021. [DOI] [PubMed] [Google Scholar]
- Le Poul E, Laaris N, Doucet E, Fattaccini CM, Mocaer E, Hamon M, Lanfumey L. Chronic alnespirone-induced desensitization of somatodendritic 5-HT1A autoreceptors in the rat dorsal raphe nucleus. European Journal of Pharmacology. 1999;365:165–173. doi: 10.1016/s0014-2999(98)00886-3. [DOI] [PubMed] [Google Scholar]
- Lemos JC, Pan YZ, Ma X, Lamy C, Akanwa AC, Beck SG. Selective 5-HT receptor inhibition of glutamatergic and GABAergic synaptic activity in the rat dorsal and median raphe. European Journal of Neuroscience. 2006;24:3415–3430. doi: 10.1111/j.1460-9568.2006.05222.x. [DOI] [PMC free article] [PubMed] [Google Scholar]
- Lemos JC, Zhang G, Walsh T, Kirby LG, Akanwa A, Brooks-Kayal A, Beck SG. Stress-Hyperresponsive WKY Rats Demonstrate Depressed Dorsal Raphe Neuronal Excitability and Dysregulated CRF-Mediated Responses. Neuropsychopharmacology : official publication of the American College of Neuropsychopharmacology. 2010 doi: 10.1038/npp.2010.200. [DOI] [PMC free article] [PubMed] [Google Scholar]
- Li YQ, Li H, Kaneko T, Mizuno N. Morphological features and electrophysiological properties of serotonergic and non-serotonergic projection neurons in the dorsal raphe nucleus. An intracellular recording and labeling study in rat brain slices. Brain research. 2001;900:110–118. doi: 10.1016/s0006-8993(01)02272-7. [DOI] [PubMed] [Google Scholar]
- Liu C, Maejima T, Wyler SC, Casadesus G, Herlitze S, Deneris ES. Pet-1 is required across different stages of life to regulate serotonergic function. Nat Neurosci. 2010 doi: 10.1038/nn.2623. [DOI] [PMC free article] [PubMed] [Google Scholar]
- Liu GX, Cai GQ, Cai YQ, Sheng ZJ, Jiang J, Mei Z, Wang ZG, Guo L, Fei J. Reduced anxiety and depression-like behaviors in mice lacking GABA transporter subtype 1. Neuropsychopharmacology : official publication of the American College of Neuropsychopharmacology. 2007;32:1531–1539. doi: 10.1038/sj.npp.1301281. [DOI] [PubMed] [Google Scholar]
- Lopez JF, Akil H, Watson SJ. Neural circuits mediating stress. Biological Psychiatry. 1999;46:1461–1471. doi: 10.1016/s0006-3223(99)00266-8. [DOI] [PubMed] [Google Scholar]
- Lowry CA. Functional subsets of serotonergic neurones: implications for control of the hypothalamic-pituitary-adrenal axis. Journal of Neuroendocrinology. 2002;14:911–923. doi: 10.1046/j.1365-2826.2002.00861.x. [DOI] [PubMed] [Google Scholar]
- Lowry CA, Hale MW, Evans AK, Heerkens J, Staub DR, Gasser PJ, Shekhar A. Serotonergic systems, anxiety, and affective disorder: focus on the dorsomedial part of the dorsal raphe nucleus. Annals of the New York Academy of Sciences. 2008;1148:86–94. doi: 10.1196/annals.1410.004. [DOI] [PubMed] [Google Scholar]
- Lowry CA, Johnson PL, Hay-Schmidt A, Mikkelsen J, Shekhar A. Modulation of anxiety circuits by serotonergic systems. Stress. 2005;8:233–246. doi: 10.1080/10253890500492787. [DOI] [PubMed] [Google Scholar]
- Ma QP, Bleasdale C. Modulation of brain stem monoamines and gamma-aminobutyric acid by NK1 receptors in rats. Neuroreport. 2002;13:1809–1812. doi: 10.1097/00001756-200210070-00024. [DOI] [PubMed] [Google Scholar]
- Maier SF, Watkins LR. Stressor controllability and learned helplessness: the roles of the dorsal raphe nucleus, serotonin, and corticotropin-releasing factor. Neuroscience & Biobehavioral Reviews. 2005;29:829–841. doi: 10.1016/j.neubiorev.2005.03.021. [DOI] [PubMed] [Google Scholar]
- Meltzer HY. The role of serotonin in antipsychotic drug action. Neuropharmacology. 1999;21:106S–115S. doi: 10.1016/S0893-133X(99)00046-9. [DOI] [PubMed] [Google Scholar]
- Meneses A. Physiological, pathophysiological and therapeutic roles of 5-HT systems in learning and memory. Reviews in the Neurosciences. 1998;9:275–289. doi: 10.1515/revneuro.1998.9.4.275. [DOI] [PubMed] [Google Scholar]
- Mourilhe P, Stokes PE. Risks and benefits of selective serotonin reuptake inhibitors in the treatment of depression. Drug Saf. 1998;18:57–82. doi: 10.2165/00002018-199818010-00005. [DOI] [PubMed] [Google Scholar]
- Nakamura K, Matsumura K, Hubschle T, Nakamura Y, Hioki H, Fujiyama F, Boldogkoi Z, Konig M, Thiel HJ, Gerstberger R, Kobayashi S, Kaneko T. Identification of sympathetic premotor neurons in medullary raphe regions mediating fever and other thermoregulatory functions. The Journal of neuroscience : the official journal of the Society for Neuroscience. 2004;24:5370–5380. doi: 10.1523/JNEUROSCI.1219-04.2004. [DOI] [PMC free article] [PubMed] [Google Scholar]
- Nanopoulos D, Belin MF, Maitre M, Vincendon G, Pujol JF. Immunocytochemical evidence for the existence of GABAergic neurons in the nucleus raphe dorsalis. Possible existence of neurons containing serotonin and GABA. Brain research. 1982;232:375–389. doi: 10.1016/0006-8993(82)90281-5. [DOI] [PubMed] [Google Scholar]
- Okuhara DY, Beck SG. Corticosteroids alter 5-hydroxytryptamine 1A receptor-effector pathway in hippocampal subfield CA3 pyramidal cells. The Journal of Pharmacology and Experimental Therapeutics. 1998;284:1227–1233. [PubMed] [Google Scholar]
- Paul ED, Hale MW, Lukkes JL, Valentine MJ, Sarchet DM, Lowry CA. Repeated social defeat increases reactive emotional coping behavior and alters functional responses in serotonergic neurons in the rat dorsal raphe nucleus. Physiol Behav. 2011 doi: 10.1016/j.physbeh.2011.01.006. [DOI] [PMC free article] [PubMed] [Google Scholar]
- Petrov T, Krukoff TL, Jhamandas JH. The hypothalamic paraventricular and lateral parabrachial nuclei receive collaterals from raphe nucleus neurons: a combined double retrograde and immunocytochemical study. Journal of Comparative Neurology. 1992;318:18–26. doi: 10.1002/cne.903180103. [DOI] [PubMed] [Google Scholar]
- Puig MV, Artigas F, Celada P. Modulation of the activity of pyramidal neurons in rat prefrontal cortex by raphe stimulation in vivo: involvement of serotonin and GABA. Cerebral Cortex. 2005;15:1–14. doi: 10.1093/cercor/bhh104. [DOI] [PubMed] [Google Scholar]
- Richardson-Jones J, Craige C, Nguyen NT, Kung HF, Gardier A, Dranovsky A, David DJ, Guiard B, Beck SG, Hen R, Leonardo E. Serotoinin-1A autoreceptors are necessary and sufficient for the normal formation of circuits underlying innate anxiety. Journal of Neuroscience. 2011 doi: 10.1523/JNEUROSCI.5836-10.2011. in press. [DOI] [PMC free article] [PubMed] [Google Scholar]
- Roche M, Commons KG, Peoples A, Valentino RJ. Circuitry underlying regulation of the serotonergic system by swim stress. Journal of Neuroscience. 2003;23:970–977. doi: 10.1523/JNEUROSCI.23-03-00970.2003. [DOI] [PMC free article] [PubMed] [Google Scholar]
- Ruel J, Emery S, Nouvian R, Bersot T, Amilhon B, Van Rybroek JM, Rebillard G, Lenoir M, Eybalin M, Delprat B, Sivakumaran TA, Giros B, El Mestikawy S, Moser T, Smith RJ, Lesperance MM, Puel JL. Impairment of SLC17A8 encoding vesicular glutamate transporter-3, VGLUT3, underlies nonsyndromic deafness DFNA25 and inner hair cell dysfunction in null mice. American journal of human genetics. 2008;83:278–292. doi: 10.1016/j.ajhg.2008.07.008. [DOI] [PMC free article] [PubMed] [Google Scholar]
- Sawchenko PE, Swanson LW, Steinbusch HW, Verhofstad AA. The distribution and cells of origin of serotonergic inputs to the paraventricular and supraoptic nuclei of the rat. Brain research. 1983;277:355–360. doi: 10.1016/0006-8993(83)90945-9. [DOI] [PubMed] [Google Scholar]
- Seal RP, Akil O, Yi E, Weber CM, Grant L, Yoo J, Clause A, Kandler K, Noebels JL, Glowatzki E, Lustig LR, Edwards RH. Sensorineural deafness and seizures in mice lacking vesicular glutamate transporter 3. Neuron. 2008;57:263–275. doi: 10.1016/j.neuron.2007.11.032. [DOI] [PMC free article] [PubMed] [Google Scholar]
- Stamp JA, Semba K. Extent of colocalization of serotonin and GABA in the neurons of the rat raphe nuclei. Brain research. 1995;677:39–49. doi: 10.1016/0006-8993(95)00119-b. [DOI] [PubMed] [Google Scholar]
- Staub DR, Spiga F, Lowry CA. Urocortin 2 increases c-Fos expression in topographically organized subpopulations of serotonergic neurons in the rat dorsal raphe nucleus. Brain research. 2005;1044:176–189. doi: 10.1016/j.brainres.2005.02.080. [DOI] [PubMed] [Google Scholar]
- Steinbusch HW, Nieuwenhuys R, Verhofstad AA, van der Kooy D. The nucleus raphe dorsalis of the rat and its projection upon the caudatoputamen. A combined cytoarchitectonic, immunohistochemical and retrograde transport study. J Physiol (Paris) 1981;77:157–174. [PubMed] [Google Scholar]
- Van Bockstaele EJ, Biswas A, Pickel VM. Topography of serotonin neurons in the dorsal raphe nucleus that send axon collaterals to the rat prefrontal cortex and nucleus accumbens. Brain research. 1993;624:188–198. doi: 10.1016/0006-8993(93)90077-z. [DOI] [PubMed] [Google Scholar]
- Vandermaelen CP, Aghajanian GK. Electrophysiological and pharmacological characterization of serotonergic dorsal raphe neurons recorded extracellularly and intracellularly in rat brain slices. Brain research. 1983;289:109–119. doi: 10.1016/0006-8993(83)90011-2. [DOI] [PubMed] [Google Scholar]
- Varga V, Kocsis B, Sharp T. Electrophysiological evidence for convergence of inputs from the medial prefrontal cortex and lateral habenula on single neurons in the dorsal raphe nucleus. European Journal of Neuroscience. 2003;17:280–286. doi: 10.1046/j.1460-9568.2003.02465.x. [DOI] [PubMed] [Google Scholar]
- Varga V, Losonczy A, Zemelman BV, Borhegyi Z, Nyiri G, Domonkos A, Hangya B, Holderith N, Magee JC, Freund TF. Fast synaptic subcortical control of hippocampal circuits. Science. 2009;326:449–453. doi: 10.1126/science.1178307. [DOI] [PubMed] [Google Scholar]
- Vertes RP. A PHA-L analysis of ascending projections of the dorsal raphe nucleus in the rat. Journal of Comparative Neurology. 1991;313:643–668. doi: 10.1002/cne.903130409. [DOI] [PubMed] [Google Scholar]
- Vertes RP, Fortin WJ, Crane AM. Projections of the median raphe nucleus in the rat. J Comp Neurol. 1999;407:555–582. [PubMed] [Google Scholar]
- Vertes RP, Martin GF. Autoradiographic analysis of ascending projections from the pontine and mesencephalic reticular formation and the median raphe nucleus in the rat. Journal of Comparative Neurology. 1988;275:511–541. doi: 10.1002/cne.902750404. [DOI] [PubMed] [Google Scholar]
- Wang QP, Nakai Y. The dorsal raphe: an important nucleus in pain modulation. Brain research bulletin. 1994;34:575–585. doi: 10.1016/0361-9230(94)90143-0. [DOI] [PubMed] [Google Scholar]
- Waselus M, Valentino RJ, Van Bockstaele EJ. Ultrastructural evidence for a role of gamma-aminobutyric acid in mediating the effects of corticotropin-releasing factor on the rat dorsal raphe serotonin system. J Comp Neurol. 2005;482:155–165. doi: 10.1002/cne.20360. [DOI] [PubMed] [Google Scholar]
- Weston MC, Nehring RB, Wojcik SM, Rosenmund C. Interplay between VGLUT Isoforms and Endophilin A1 Regulates Neurotransmitter Release and Short-Term Plasticity. Neuron. 2011;69:1147–1159. doi: 10.1016/j.neuron.2011.02.002. [DOI] [PubMed] [Google Scholar]
- Zink M, Vollmayr B, Gebicke-Haerter PJ, Henn FA. Reduced expression of GABA transporter GAT3 in helpless rats, an animal model of depression. Neurochem Res. 2009;34:1584–1593. doi: 10.1007/s11064-009-9947-2. [DOI] [PubMed] [Google Scholar]