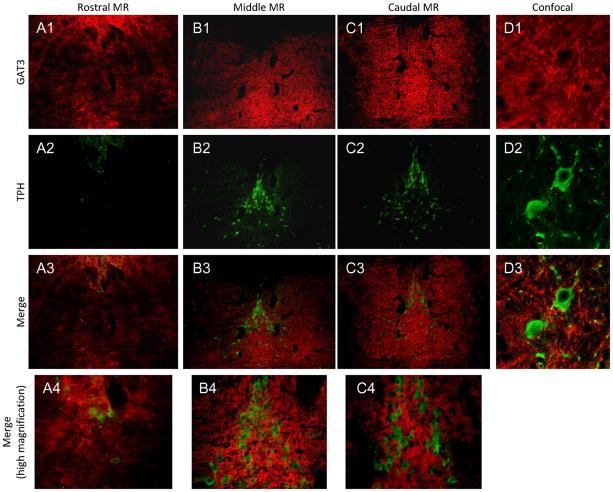
Figure 10. GAT3 expression in the MR.
GAT3 was most strongly expressed in the middle and caudal sections of the MR in both midline and lateral areas (A1-C1). MR neurons labeled with TPH (A2-C2), were interspersed with GAT3-labeled fibers across most of the MR (A3-C3, A4-C4). Confocal images show that GAT3-labeled fibers surround individual TPH-labeled neurons (D1–D3). Red=GAT3; Green=TPH

