

Abstract
Budding of retroviruses requires the structural precursor polyprotein, Gag, to target the plasma membrane through its N-terminal matrix (MA) domain. For HIV-1, the interaction between membrane signaling molecule phosphatidylinositol 4,5-diphosphate (PIP2) and MA induces the exposure of myristate and promotes membrane binding. Here we studied oligomerization of the naturally unmyristylated equine infectious anemia virus (EIAV) MA and its interaction with PIP2-C4 primarily using solution NMR spectroscopy. The measured 1H–15N residual dipolar coupling agrees with the atomic coordinates from the EIAV MA crystal structure. The analytical ultracentrifugation results show a dominant population of monomeric EIAV MA at a concentration of 63 μM and 20 °C, along with a small trimer and a broad distribution of other oligomers. The monomer–trimer equilibrium model and the quaternary packing of the trimer were further established by the concentration-dependent 15N spin relaxation rates and chemical shifts. Binding of MA to PIP2-C4 was detected by chemical shift mapping (CSM) with an apparent Kd of 182 ± 56 μM, a value similar to that reported for HIV-1 MA. The PIP2 binding site includes the Loop region between Helix2 and Helix3 in the EIAV MA. CSM and spin relaxation dispersion reveal a coupling of conformational change and submillisecond dynamics, respectively, between the Loop and trimeric Interface Residues due to PIP2 binding. We infer that PIP2 participates in the initial trimer formation of EIAV MA, but more importantly, the concentration effect is dominant in shifting the equilibrium toward trimer, in line with the entropic switch mechanism proposed for myristylated HIV-1 MA.
During the maturation of retroviruses, the structural precursor polypeptide, Gag, is targeted to the cytosolic side of the infected cell membrane through its N-terminal matrix protein (MA)1 domain. MA domain and other determinants in Gag direct protein and genome RNA assembly underneath the lipid bilayer and the subsequent budding and release of viral particles (1, 2). Despite poor sequence homology, MA domains from various retroviruses are similar in size (14–15 kDa) and share a highly conserved tertiary structure composed of five helices (3). HIV-1 MA membrane binding is stabilized through contributions from a bipartite motif in the protein comprised of an N-terminal fatty acid moiety and basic charges (4–6). The three-dimensional (3D) structure of HIV-1 MA has been determined using both X-ray crystallography (7) and solution NMR spectroscopy (8, 9). The protein crystallized as a trimer and exists as a monomer in solution at low millimolar concentrations. Phosphatidylinositol 4,5-diphosphate (PIP2), a signaling molecule on the inner leaflet of the plasma membrane, is responsible for recruiting many cytosolic proteins through electrostatic interactions (10). Recent biochemical studies (11) and NMR structural studies on HIV-1 MA in complex with PIP2 bearing short aliphatic chains (PIP2-C4 or PIP2-C6) (12, 13) suggest PIP2 is the lipid anchor for HIV-1 MA. Consistent with the notion that the N-terminal myristate plays a critical role in targeting and protein assembly, PIP2 binding induces conformational change in HIV-1 MA, resulting in the exposure of the fatty acid and stronger membrane binding affinity (12). However, recent mutational studies suggest that PIP2 binding alone may not be sufficient to expose myristate (13).
Equine infectious anemia virus (EIAV) MA lacks myristoylation sites. Neither the mechanism of recruitment to the membrane nor the actual packing of MA within the particle is fully understood. The 3D structure of the EIAV MA monomer was similar to that of HIV-1 MA, although, as noted above, HIV-1 MA crystallized as a trimer while EIAV MA was crystallized in a nonsymmetric dimeric unit (14). Fluorescence studies suggest that EIAV MA exists as a multimer of two to three units and is versatile in its interaction with both neutral and negatively charged lipid bilayers (15). A higher-resolution picture of the EIAV MA oligomeric state was not available from the anisotropic measurement using fluorescence spectroscopy (15).
To characterize the oligomeric form and to determine whether PIP2 binding is conserved, we carried out a series of measurements on the structure and dynamics of EIAV MA using solution NMR spectroscopy and analytical ultracentrifugation. Our results are consistent with a primary monomer–trimer equilibrium model for EIAV MA at micromolar concentrations. Chemical shift mapping (CSM) indicated that the trimeric packing of HIV-1 MA is also adopted by EIAV MA. EIAV MA has both charged and hydrophobic residues that interact with PIP2-C4. The binding site for PIP2 phosphate groups is in the Loop between Helix2 and Helix3, in contrast to HIV-1 MA where binding involves the β-Helix2–Helix4 cleft, with β designating the loop between Helix1 and Helix2. In addition, PIP2-C4 binding indirectly induces chemical shift changes and submillisecond dynamics on some residues located on the trimeric interface. PIP2 appears to participate in the initial step promoting MA trimer formation, but the driving force for oligomerization is still predominantly the high local concentration of the MAs.
MATERIALS AND METHODS
EIAV MA
The wild-type EIAV MA consists of 124 residues. Its primary sequence is MGDPLTWSKA10-LKKLEKVTVQ20GSQKLTTGNC30NWALSLVDLF40-HDTNFVKEKD50WQLRDVIPLL60EDVTQTLSGQ70ERE-AFERTWW80AISAVKMGLQ90INNVVDGKAS100-FQLLRAKYEK110KTANKKQSEP120SEEY. Our construct includes a His tag with the sequence A(H)6GR at the N-terminus. The other modification is the replacement of the four C-terminal residues (SEEY) with one L residue. The recombinant protein contains a total of 130 residues with a theoretical MW of 14 929. The mass confirmed with electrospray ionization mass spectroscopy was 14 928. Residues are indexed according to the native sequence throughout the text.
The MA gene was cloned into the pET3a vector, and the protein was expressed in Escherichia coli strain BL21-DE3. 15N and 13C isotope-labeled protein was expressed in minimal medium with 15NH4Cl and [13C]glucose as the sole nitrogen and carbon sources, respectively. The nickel resin and the standard purification protocol for His-tagged proteins from Novagen (San Diego, CA) were employed. Chromatography was carried out at 4 °C. The protein was further purified on a reverse-phase C4 HPLC column from Phenomenex (Torrance, CA). The final NMR sample contains EIAV MA at a concentration of <0.5 mM in 20 mM sodium acetate buffer (pH 4.5), 0.01% NaN3, and 6% D2O. The slight acidic buffer was employed since a neutral pH and high ionic strength will lead to line broadening and precipitation due to oligomerization. All reported protein concentrations were based on UV absorbance in 6 M GuHCl (ε280 28 990 M−1 cm−1).
The structural coordinates of EIAV MA in the dimeric crystal structure (PDB entry 1HEK) were adopted for analysis. The monomer model corresponds to molecule A in the dimer. The trimer model was constructed through structural homologous alignment with the trimer structure of HIV-1 MA (PDB entry 1HIW) (7) according to the method of Hatanaka et al. (14). The coordinates of atom HN were calculated using MOLMOL (16).
Analytical Ultracentrifugation
For sedimentation velocity experiments, a Beckman Optima XL-I analytical ultracentrifuge and a four-place AN-Ti rotor were used. The MA sample was dialyzed against buffer containing 20 mM sodium acetate (pH 4.5) and 10 mM NaCl. The final protein concentration was 63 μM. The sedimentation experiments were performed on both the lipid free and the MA–PIP2-C4 complex sample at a 1:1 molar ratio. Centrifuge cells fitted with double-sector centerpieces and sapphire windows were filled with 0.4 mL of the protein sample. After reaching thermal equilibrium at 20.0 °C at rest, the rotor was accelerated to 54 000 rpm. Interference and absorbance scans at 295 nm were started immediately after the rotor reached the set speed and collected until no further sedimentation boundary movement was observed. The apparent sedimentation coefficient distributions were analyzed by Lamm equation modeling using the SEDFIT software of Schuck (17). Positions of menisci and bottoms as well as frictional ratios were optimized during the fitting procedure. The final accepted fits had a rmsd of <0.006. To obtain information about the amount of oligomers present in samples, absorption and interference data were analyzed globally with SEDPHAT using the hybrid model (17). In this procedure, monomer, dimer, and trimer were fitted as global discrete species with fixed molecular weights and higher-molecular weight species were modeled with a continuous sedimentation coefficient distribution.
NMR Spectroscopy
All NMR experiments other than those for assignment and dipolar coupling measurements were performed on a Bruker Avance 800 MHz spectrometer equipped with a cryo-probe and Z pulse field gradient. The others were performed on a Bruker Avance 600 MHz spectrometer with a cryo-probe and Z pulse field gradient. The proton carrier frequency was set on water resonance, and the 15N carrier frequency was set at 118.02 ppm. The backbone 15N assignments were accomplished using standard 3D HNCO, HN(CO)CA, and HNCA experiments on 15N-and 13C-labeled EIAV MA (18). The N–H bond residual dipolar couplings (RDCs) were measured on a 500 μM sample aligned in 5% stretched polyacrylamide gels at 15 °C using the IPAP pulse sequence (19). Every 1H–15N HSQC data set consists of 512 (t2) × 128 (t1) real data points. NMRPipe (20) was used for data processing.
PIP2 Titration
PIP2-C4 (Echelon Biosciences Inc., Salt Lake City, UT) or PIP2-C6 (Cayman Chemical, Ann Arbor, MI) was dissolved in acetate buffer to yield a stock concentration of 3.36 mM. The initial 15N-labeled EIAV MA sample had a volume of 250 μL and a concentration of 195 μM. The titration was performed at 10 °C with sequential addition of PIP2-C4 at concentrations of 40.3, 80.6, 121, 161, 202, 269, 336, 403, 470, and 605 μM. The 1H–15N HSQC spectra were collected for every titration. The normalized 1H–15N chemical shift deviation (δHN) was calculated according to eq 1 (21). The error range was 1 ppb based on duplicate measurement. The titration curve was subjected to a nonlinear χ2 minimization routine in GRACE (Grace Development Team) using eq 2 (22)
| (1) |
| (2) |
where ΔHN is the maximum chemical shift deviation, L is the total ligand concentration, P is the total protein concentration, and Kd is the apparent dissociation constant.
Backbone 15N Spin Relaxation Measurement
The longitudinal and transverse 15N spin relaxation rates and 1H–15N heteronuclear NOE (23) were measured for three 15N-labeled samples, MA at 52.4 or 262 μM and MA at 52.4 μM in the presence of 105 μM PIP2-C4. All relaxation data were collected at 14 °C. The T1 delays being used were 20, 164, 324, 532, 724, 884, 1204, and 1492 ms. The T1ρ delays being used were 6, 12, 22, 32, 42, 58, 70, and 86 ms. The T1ρ spin lock frequency was 2.5 kHz (24), and spectra were collected in an interleaved manner to minimize the effects of systematic errors. The T2 CPMG (25) time delays being used were 4, 32, and 64 ms for τcp at 0.5 ms and 8, 32, and 64 ms for τcp at 2 ms. τcp is defined as one-half of the duration time between two successive 180°15N pulses during spin echo delays (26). The relaxation rate was derived from the exponential decay of HSQC peak heights using the minimization routine in Sparky (Goddard and Kneller, University of California, San Francisco). The R2 rates were calculated on the basis of R1ρ and R1 rates, applied spin lock strength, and the angular frequency offset of the individual 15N spin.
RESULTS
The dispersed 1H–15N HSQC spectrum indicates that EIAV MA was folded under the experimental condition (Figure S1). A total of 105 peaks, ranging from L5 to E119, could be identified on 1H–15N HSQC spectra without ambiguity. Prolines were at positions 4, 58, and 120. Peaks from residues E15, L25, N29–W32, E73, M87, and V94 were severely overlapped with each other or with the side chain 1H–15N peaks and thus omitted from the analysis. Only one set of peaks was observed for all residues in EIAV MA, suggesting that the protein was either in a single state or within fast exchange among multiple states.
Analytical Ultracentrifugation
We set out to characterize oligomeric species using ultracentrifugation on EIAV MA at a concentration of 63 μM. Sedimentation coefficient distribution analysis of the analytical ultracentrifugation data showed that more than 79% of EIAV MA is present in the monomer form represented by a single peak with an average S value of 1.7 (Figure 1). The rest of the distribution forms a broad spectrum extending from 3S to >20S. This distribution extends to even larger S values for sample containing PIP2-C4. To resolve this broad part of the distribution, we performed hybrid global analysis of the sedimentation velocity data, modeling smaller species (S < 9) with discrete components and larger species and possible aggregates with a continuous S distribution. The combined fitted amplitude of three discrete components with masses equal to those of protein monomer, dimer, and trimer was representing 90% of the protein loading concentration with the remaining 10% modeled by the continuous S distribution. Models with a reduced number of discrete components yield an unsatisfactory quality of the fit. Relative amplitudes of monomer, dimer, and trimer peaks were 79 ± 5, 3 ± 10 (5.7 S), and 18 ± 10% (8.9 S), respectively, for the MA sample without lipid and 74 ± 5, 6 ± 10 (4.5 S), and 20 ± 10% (8.2 S), respectively, for MA sedimenting in the presence of an equal concentration of PIP2-C4. Since monomer dominates the sedimentation profile, the uncertainty for the derived population of dimer and trimer species is significant, 10%, but nevertheless, the major species identified are monomer and trimer at 63 μM and 20 °C.
Figure 1.

Sedimentation coefficient distributions c(s) from the analysis of the sedimentation profiles of EIAV MA alone (—) and EIAV MA with an equal amount of PIP2-C4 (- - -). The protein concentration was 63 μM. The resulting S values of monomer, dimer, and trimer from the analysis are indicated.
Alignment Tensor
To use the EIAV MA X-ray crystal structure (14) for our subsequent analysis, we confirmed independently that the structure reflects the conformation of EIAV MA in solution. The agreement between the 15N–1H RDC measured in solution and the X-ray structure can be used as an evaluation. Due to long-range 1H–1H dipolar couplings that introduce line broadening and resonance overlaps, only dipolar couplings for 81 residues can be measured reliably in EIAV MA. To derive the alignment tensor, a singular-value decomposition method was employed to fit the N–H bond geometry from the crystal structure to the measured dipolar couplings. PALES (27) was used for all alignment calculations. Initially, all measured N–H RDC values were included in calculation of the tensor and resulted in a moderate correlation with a correlation coefficient R equal to 0.59 and a quality factor Q equal to 77% (28) (Figure 2A and Table S1). Removing the three dipolar couplings (V17, G69, and V95) with the largest deviation between measured and predicted couplings improved the correlation R to 0.67. Further removal of residues within the loop region produced the highest R (0.74), the lowest Q (58%), and the lowest χ2 value (Figure 2B and Table S1). All obtained alignment tensors were similar in orientation (α, β, and γ) and magnitude (Azz and rhombicity R), indicating that the stepwise removal of outliers did not change the alignment tensor considerably. The X-ray structure resolution of EIAV MA is 2.8 Å. The agreement described above is slightly worse in comparison to a typical Q value of ~40% for a 2.5 Å X-ray structure (29). This suggests that even though the overall structure agrees with our dipolar coupling data, there are some local differences between the X-ray and solution structures. In the following tensor analysis, only N–H RDCs from helical residues are included.
Figure 2.

Measured and calculated 15N–1H RDC correlation plots based on all 81 available residues (A) or 48 helical residues (B). The experimental error range is 1 Hz.
The measured RDC is a Boltzman weighted average from all possible oligomeric states. If the 3D structure is largely conserved from monomer to oligomer, dynamic averaging takes place only in the Saupe order matrix, as in eq 3
| (3) |
| (4) |
| (5) |
where A is the alignment tensor and T is the Euler rotation matrix specified in eqs 5 and 6, respectively. The population coefficient is pi for each oligomeric state i. There are six unknown parameters (p, Azz, R, α, β, and γ) for each state on the right part of eq 3. It is impossible to solve the system with only five known parameters, ensemble averaged. Fortunately, PALES (27) could predict both alignment tensor components Azz and R and tensor orientation (α, β, and γ) with the input of structure coordinates (Table 1), leaving only one unknown, pi. Since the protein was soaked into the alignment medium composed of a stretched polyacrylamide gel, the presumed alignment interaction will be steric. In these cases, PALES predictions are typically quite reliable. We minimized the difference between 3 × 3 matrices on both sides of eq 3. The results (Table 2) show that the monomer was the dominant species. If the dimer and trimer are the only possible oligomers other than the monomer, most likely the trimer would be the second dominant species at 22 ± 6%. Note that RDC can be much more sensitive to higher-order oligomers, e.g., hexamer due to its much larger effective size and possibly more anisotropic shape, so that the fraction of 22 ± 6% for the trimer is an estimate. Notwithstanding the limitation, the conclusions we made from RDC are that, first, the X-ray structure is largely correct and, second, the trimer structure, not dimer, is a more reasonable oligomer for taking into account the tensor averaging.
Table 1.
Predicted and Experimental Alignment Tensors
| Azzc | R | α (deg) | β (deg) | γ (deg) | |
|---|---|---|---|---|---|
| monomera | −33.4 × s | 0.329 | 89.7 | 40.5 | 194 |
| dimera | −56.9 × s | 0.624 | 53.2 | 40.7 | 286 |
| trimera | 62.3 × s | 0.0099 | 141 | 15.9 | 6.37 |
| SVDb | (41.6 ± 0.7) × s | 0.483 ± 0.014 | 77.7 ± 1.0 | 45.9 ± 3.0 | 338 ± 6 |
Both predicted and experimental alignment tensors were calculated in PALES. The coordinates used for different oligomer are described in Materials and Methods.
Singular-value decomposition (SVD) was used to derive the experimental tensor. The error range was estimated using the Monte Carlo method.
The axial component of alignment tensor Azz was scaled from the predicted irreducible alignment magnitude by an arbitrary factor s.
Table 2.
Results of Tensor Decomposition
| partitionb | |||
|---|---|---|---|
| monomer | 0.78 ± 0.06 | 1 | 0.78 ± 0.06 |
| dimer | 0 | 0 | 0c |
| trimer | 0.22 ± 0.06d | 0c | 0.22 ± 0.06d |
| χ2a | 0.555 | 0.663 | 0.555 |
χ2 was calculated on the basis of the difference between both sides of eq 3.
The error range was estimated using the Monte Carlo method.
Decomposition was carried out when either trimer or dimer population was assumed to be zero.
The estimation of population was made without taking into account other higher-order oligomers.
Concentration-Dependent 15N Spin Relaxation Rates
Compelling evidence for EIAV MA being in monomer–trimer equilibrium comes from the backbone 15N spin relaxation measurements of two samples with a 5-fold concentration difference. To the first approximation, the ratio of backbone 15N spin relaxation rates, R2/R1, is linearly related to the protein overall correlation time and average molecular weight. The average R2/R1 for a 52.4 μM sample excluding residues beyond E109 was 22.5 ± 3.6 (Figure 3A), indicating a correlation time of 11 ns (τc ≈ 0.5R2/R1). At 14 °C, the 11 ns tumbling time corresponds to a spherical molecule with a radius of 20 Å assuming the Debye–Stokes–Einstein relationship. The lengths of principal axes calculated from the EIAV MA monomer coordinates are 20, 17, and 15 Å. The hydrodynamic estimation supports the conclusion that the dominant species for EIAV MA in solution at low micromolar concentrations was the monomer. The average of R2/R1 for the 262 μM sample excluding residues beyond E109 was 26.5 ± 3.3 (Figure 3A), higher than the ratio of the diluted sample, 22.5 ± 3.6. One can assume that the 52.4 μM NMR sample has 84% monomer which is the upper bound partition from results of analytical ultracentrifugation at a concentration of 63 μM and 20 °C. With the expected correlation time of the trimer to increase by 3-fold, the 262 μM sample should have ~72% monomer.
Figure 3.

NMR-observed backbone 15N spin relaxation rate ratio plots (A) and chemical shift difference profile (B) of EIAV MA samples at different concentrations, 52.4 and 262 μM. For relaxation plots in panel A, there are 101 data points shown for 52.4 and 262 μM samples after the omission of overlapping residues. For the chemical shift difference plot in panel B, only fully isolated residues, 91 of 105, are shown. Interface Residues, including H41, D42, and V63–E71, are depicted as empty rectangular boxes. We define the PIP2 interacting region as N44–Q52 and A84–Y108 and show the range as filled rectangular boxes. The boxes are uniformly plotted in all the following profile figures.
Concentration-Dependent Chemical Shift Perturbation
Not surprisingly, the EIAV MA monomer–trimer equilibrium can be detected through its concentration-dependent chemical shifts. Chemical shifts from backbone amide 1H and 15N at sample concentrations of 52.4 and 262 μM were compared. Only completely isolated peaks are chosen for calculation of the normalized chemical shift difference using eq 1 (Figure 3B). The mean value of the chemical shift difference (δmean) for the 91 chosen residues was 6.2 ppb, and the standard deviation (δstd) was 5.3 ppb. The error range was 1 ppb based on duplicate measurements. The residues whose chemical shift changed by more than 11.5 ppb (δmean + δstd) were T27, H41, D42, F45, D50, V63, T64, T66, L67, S68, E71, S100, and K110. Most of them, residues H41, D42, and V63–E71, are located on the trimer interface
| (6) |
(Figure 4), and they are defined as Interface Residues. On the basis of the reconstructed EIAV MA trimer structure, H41/S68 and D42/E71 residue pairs are within close contact, where H41 and D42 are at the end of Helix2 and S68 and E71 are at the linker between Helix3 and Helix4 of the neighboring unit. The involvement of polar and charged amino acids suggests an electrostatic interaction for trimer formation. Other sites that exhibited chemical shift changes are residues F45 and D50 at the ends of the Loop between Helix2 and Helix3, residue T27 of Helix2, and residue S100 of Helix5. The residues outside of the Interface Residues might be involved in a correlated conformational change during trimerization, or the formation of other oligomers.
Figure 4.
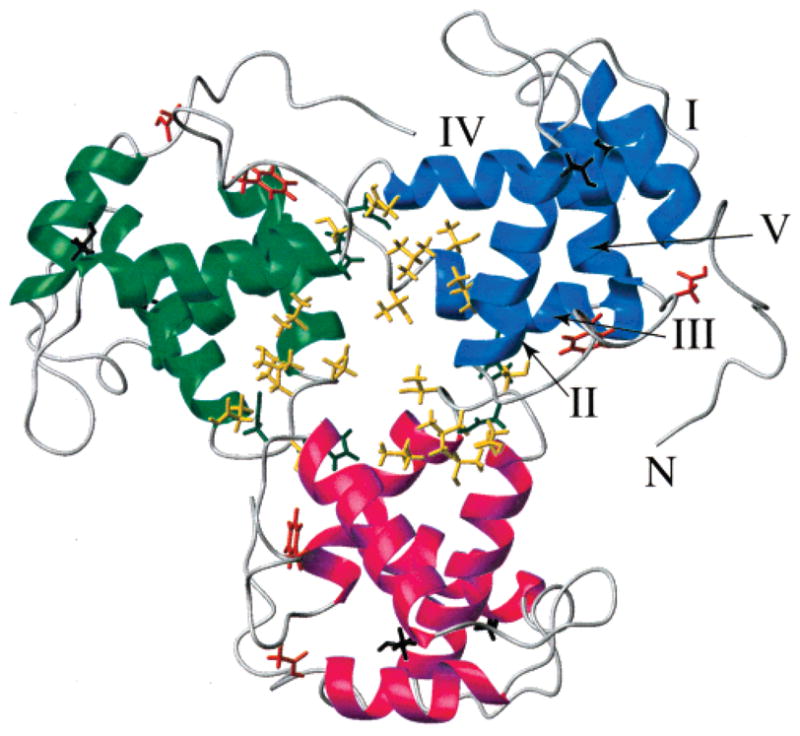
Residues exhibiting concentration-dependent chemical shifts mapped onto the trimer model of EIAV MA. Each monomer is colored differently. Helices are labeled for one monomer. Strongly perturbed residues have their side chain bonds displayed. Residues H41 and D42 are colored dark green. Residues V63, T64, T66, L67, S68, and E71 are colored gold. Residues F45 and D50 are colored orange-red. Residues T27 and S100 are colored black.
PIP2-Induced Chemical Shift Change
The quantitative titration of PIP2-C4 was carried out on an EIAV MA sample with a concentration of 195 μM at 10 °C. At a 1:1 molar ratio, the mean value of the chemical shift difference (δmean) is 5.7 ppb and the standard deviation (δstd) is 5.3 ppb. As a control, similar experiments were conducted using 1-oleoyl-2-hydroxy-sn-glycero-3-[phospho-rac-(1-glycerol)], another Pi-containing lipid, in place of PIP2-C4. One order of magnitude smaller changes in chemical shifts (δmax of 3.5 ppb) were observed (data not shown). The residues with chemical shift changes of >11.0 ppb (δmean + δstd) are D42, N44, E48, K49, D50, Q52, V63, G88, L104, Y108, K110, N114, and K116 (Figures 5A and 6). Residues N44–Q52 are within the Loop between Helix2 and Helix3. The major PIP2 interaction site was around residue K49 in the Loop region that exhibits one of the largest chemical shift differences, 27 ppb. The residues in the Loop region are mostly polar and charged. The other PIP2 binding region included nonpolar residues G88, L104, and Y108 located in the linker connecting Helix4 and Helix5. The only plausible model is one in which PIP2-C4 has its phosphate groups interacting with the Loop and the aliphatic chain contacting Helix4 and Helix5 simultaneously (Figure 7). The PIP2-C6 perturbation profile (Figure 5B) exhibited larger chemical shift changes at residues A84 and G88, consistent with the stronger interaction expected between the elongated aliphatic chain of PIP2 and Helix4 and Helix5. Therefore, we define the PIP2 interacting region as N44–Q52 and A84–Y108.
Figure 5.

NMR-observed chemical shift changes in EIAV MA induced by binding to PIP2-C4 (A) and PIP2-C6 (B). The EIAV MA concentrations were 195 (A) and 130 μM (B). The PIP2:protein molar ratio is 1:1. Only fully isolated residues, 91 of 105, are presented for both data sets.
Figure 6.

Overlay of 1H–15N HSQC spectra showing the trends of chemical shift changes upon PIP2-C4 titration. Only spectral regions around significantly perturbed residues, N44, E48, K49, D50, Q52, L104, and Y108, are enlarged. The black contours are peaks from the EIAV MA sample at a concentration of 195 μM. The red and blue contours represent the peaks from samples with protein:PIP2 molar ratios of 1:1 and 1:3, respectively.
Figure 7.

Residues affected by PIP2-C4 titration are mapped on the monomer structure of EIAV MA (A). Helices are colored magenta for Helix1, green for Helix2, blue for Helix3, yellow for Helix4, and cyan for Helix5. The loop between Helix2 and Helix3 is colored red. Strongly affected residues have their side chain bonds displayed. The backbone atoms are drawn for G88. Residues D42 and V63 are colored dark green and gold, respectively. Residues N44, E48, K49, D50, and Q52 are colored orange-red. Residues G88, L104, and Y108 are colored black. Residues P4 and W7 are also indicated with their Cα atoms drawn. The amide resonance for P4 is not available, while W7 shows a change in chemical shifts [just under the standard of deviation cutoff (Figure 5)], and they are in the PIP2 interaction site. (B) PIP2 interaction surface colored yellow using atoms from K49, G88, L104, Y108, P4, and W7. (C) Electrostatic surface plot of EIAV MA.
The apparent Kd was derived for the strongly affected residues (Figure 8 and Table 3). All five residues within the Loop region (N44–Q52) have their Kd in the range of 195 ± 68 μM. A similar magnitude of Kd was found for residues G88, L104, and Y108. The average Kd for the eight residues mentioned above is 182 ± 56 μM. Interface Residues D42 and V63 show significantly lower Kd values, 40 ± 10 μM. We attribute the apparent Kd difference to a highly cooperative secondary response. Binding of PIP2 to the Loop region strongly shifts the conformational equilibrium within some Interface Residues. The apparent Kd′ for the secondary shift is inversely related to the monomer–trimer equilibrium constant, Ka (>1), for D42 and V63 when PIP2 binds (Kd′ = Kd/Ka). This indicates that PIP2 binding in the Loop has the potential to lower the free energy difference of the monomer–trimer equilibrium of some Interface Residues, but not all. The salient correlation in chemical shift changes between D50 in the Loop and V63 in Interface Residues (Figure S2) suggests that the PIP2 binding event participates in the initial step toward trimerization.
Figure 8.

Representative PIP2-C4 titration curves. K49 is in the Loop region, while V63 belongs to Interface Residues. G88 is part of the linker between Helix4 and Helix5.
Table 3.
Apparent Kd Values Derived from the PIP2-C4 Titration Curve
| residuea | Kd (μM) | region |
|---|---|---|
| D42 | 30.2 | Interface Residues |
| N44 | 112 | Loop |
| E48 | 212 | Loop |
| K49 | 238 | Loop |
| D50 | 276 | Loop |
| Q52 | 139 | Loop |
| V63 | 50.6 | Interface Residues |
| G88 | 182 | linker of Helix4 and Helix5 |
| L104 | 147 | Helix5 |
| Y108 | 147 | Helix5 |
Kd was calculated for strongly affected residues only (Figure 5A).
Dynamics Associated with PIP2 Binding
Conformational shifts induced by biomolecular interactions are dynamic processes (30). The dynamics induced by PIP2 binding can be studied on multiple time scales using NMR spectroscopy (31, 32). Classical measurement of R1, R2, and heteronuclear NOE on backbone 15N is sensitive to nanosecond to picosecond dynamics. Relaxation rates were measured on the 52.4 μM protein sample alone and in the presence of 105 μM PIP2-C4. The average R2/R1 for the above PIP2-C4-saturated sample excluding residues beyond E109 was 23.9 ± 3.4, only slightly higher than the value of 22.5 ± 3.6 for the protein alone (Figure S3A). The rotational correlation time for EIAV MA was conserved in the presence of PIP2-C4. The moderate elevation of the R2/R1 ratio may come from both the conformational exchange-enhanced R2 (e.g., T43 exhibited an elevated R2 due to conformational exchange) and the slight reduction in the monomer population, which is expected from the analytical ultracentrifugation results as well (see the result and Figure 1). There was also no significant heteronuclear NOE difference between the two samples (Figure S3B), indicating that there were no changes in picosecond dynamics upon PIP2 binding.
All previously discussed R2 rates were derived from R1ρ experiments carried out at a spin lock strength of 2.5 kHz, presumably free of any Rex contribution on a microsecond to millisecond time scale. However, the apparent CPMG R2 rate, which reflects the combination of Rex and true R2, will increase with longer spin echo time (τcp) when any conformational exchange occurs on a time scale comparable to τcp. The 2.5 kHz spin lock strength corresponds to a τcp of 0.1 ms (26). The R2 measured from a spin lock pulse will be termed R2 (0.1 ms). We then determined CPMG R2 at τcp values of 0.5 and 2 ms on the PIP2-C4-saturated EIAV MA sample. The average of the R2(0.5 ms)/R2(0.1 ms) ratios was 1.02 ± 0.17 (Figure 9A). The residues with significantly enhanced R2 values were T43, V46, E48, G88, G97, and S118, chosen on the basis of the criterion that the lower bound of an individual ratio was larger than the sum of the global average and standard deviation of 1.19 (1.02 + 0.17). Consistent with the chemical shift mapping result, the PIP2-C4 binding region, the Loop, Helix4, and Helix5 are in motion, presumably diffusion-controlled, on a time scale close to 0.5 ms (τcp). The average of R2(2 ms)/R2(0.5 ms) was 1.06 ± 0.23 (Figure 9B). The most strongly affected residues were L36, T66, L67, and K98. Residues T66 and L67 are Interface Residues, and L36 is close to the Interface Residues. This suggests that the PIP2 on/off binding induces a slower motion on a time scale sensitive to τcp of 2 ms, on the residues listed above. The emerging slow-motion dynamics in part of the interface region indicates the possible initiation of trimerization.
Figure 9.

Effects of microsecond to millisecond dynamics on R2 CPMG relaxation rates of EIAV MA in the presence of PIP2-C4. (A) Ratio of R2 measured at 0.5 ms (τcp) to R2 derived from the R1ρ data set collected at a spin lock strength of 2.5 kHz. (B) Ratio of R2 measured at 2 ms (τcp) to that at 0.5 ms (τcp). Residues with significant R2 enhancements are shown as empty circles. The protein concentration was 52.4 μM, and the PIP2-C4 concentration was 105 μM.
To demonstrate that the dynamics at time scales of 0.5–2 ms are really induced by PIP2 interaction, the same set of CPMG R2 measurements were carried out on EIAV MA without PIP2-C4. The average R2(0.5 ms)/R2(0.1 ms) was 0.99 ± 0.15 (Figure S4A), and the most strongly affected residues were T27, V85, and K110. The average R2(2 ms)/R2(0.5 ms) was 1.10 ± 0.27 (Figure S4B), and the most strongly affected residues were G28 and T66. Thus, only T66 from Interface Residues exhibited slower motion dynamics with a time scale of ~2 ms. The results of this control experiment using EIAV MA alone support our interpretation that PIP2 binding induced MA dynamics in the submillisecond range: the PIP2-C4-induced Loop dynamics lead to a slower motion in some Interface Residues and might promote the initiation of MA trimer formation.
DISCUSSION
Structure and Oligomerization State of EIAV MA
Our RDC data are consistent with the X-ray coordinates (Figure 2). Moreover, our backbone 15N spin relaxation experiments detect a fast tumbling of the C-terminus after residue E109 (Figure 3A), which is consistent with the lack of electron density after residue E109 (14). These observations indicate that the protein structure is largely similar between the crystal form and solution state.
Though the 15N spin relaxation rates and analytical ultracentrifugation results at low micromolar concentrations are consistent with a dominant monomer species, the concentration-driven oligomerization is obvious as the R2/R1, to a good approximation linearly correlated with average molecular weight, increases 18% with a 5-fold concentration increase. This implies that the accumulation of Gag molecules locally in the proximity of the plasma membrane can be quite effective in promoting MA oligomerization and, thus, viral assembly. The concentration-dependent chemical shift changes and sedimentation result further establish that the major equilibrium of EIAV MA in solution is monomer–trimer at micromolar concentrations. The quaternary packing of EIAV MA is similar to that of the trimer of HIV-1 MA (7).
Since the averaged solution NMR signal is less sensitive to slow tumbling or highly anisotropic species, we cannot exclude the possible presence of higher-order oligomers or a nonsymmetric dimer as seen by the crystal structure (14). The broad distribution of heavier species after sedimentation (Figure 1) is also suggesting heterogeneity of EIAV MA oligomers. Residues T27 and S100 were identified as strongly affected ones from concentration-dependent chemical shifts (Figure 3B) but not assigned to any group. Residues T27, G28, and K110 exhibited significant microsecond to millisecond dynamics in the absence of PIP2 but played no role in the monomer–trimer equilibrium. These residues belong to Helix2 and Helix5, respectively. They therefore could be involved in oligomerization events other than trimerization. Indeed, inspection of the dimer coordinates of EIAV MA (14) reveals a short stretch of hydrophobic coiled-coil interface: side chains of W32, L36, and L39 on Helix2 of molecule A are in the proximity of side chains of A99 and L103 on Helix5 of molecule B. Mutation of W32 to I rendered the protein unstable (unpublished observation). Taken together, these observations suggest that the assembly mechanism of MA could be very versatile and includes both electrostatic and hydrophobic interactions, as suggested by recent computational (33) and EM studies (34).
PIP2 Binding to EIAV MA
Recent NMR structural studies on PIP2-C4 or -C6 in complex with wild-type HIV-1 MA or its mutants suggest that PIP2 may trigger the exposure of the N-terminal myristate moiety to complete Gag membrane anchoring (12, 13). It was also proposed that the high concentration of MA can promote the exposure of the myristate (35).
For HIV-1 MA, the major PIP2-C4 binding sites are within the β-Helix2–Helix4 cleft (12), the location of which is quite different from what we have identified as the PIP2 binding sites on EIAV MA. Also in contrast to findings with HIV-1 MA, we did not observe significant structural changes upon PIP2 binding to EIAV MA. Similar to the binding of PIP2-C4 to HIV-1 MA (Kd) 150 ± 30 and 240 ± 60 μM for myr+ and myr– MA, respectively), the interaction between EIAV MA and PIP2-C4 is energetically weak with an apparent Kd of 182 ± 56 μM.
We conclude that the Loop between Helix2 and Helix3 is interacting with the phosphate groups on the sugar ring of PIP2 and that Helix4 or Helix5 is responsible for possible hydrophobic interactions with the aliphatic chain. To establish the specificity of EIAV MA PIP2 interaction, a K49A mutant was constructed. The NMR spectrum of the mutant, other than the regions close to residue K49, mimics that of the wild type. Chemical shift mapping of the PIP2 titration of the K49A mutant EIAV also showed a very similar profile to that of the wild-type protein (data not shown). This suggests that a single mutation at that site did not change the overall structure or the local PIP2 binding site arrangement significantly. The titration, however, resulted in a binding curve markedly different than the one for the wild-type protein (Figure S5). The binding curve cannot be fit with a single state binding, suggesting that the relationship between PIP2 binding and oligomerization of the K49A mutant of EIAV MA may have shifted.
A recent in vivo finding that the deletion of Helix4 in Rous Sarcoma Virus (RSV) MA inhibits Gag membrane targeting (36) is consistent with our finding that A84 and G88, located at the C-terminus of Helix4 in EIAV MA, also contribute to the PIP2 interaction. We suspect they interact with the aliphatic chain of PIP2. Like EIAV MA, the N-termini of RSV Gag lacks myristoylation, and the apparent Kd of its lipid binding is on the order of 0.1–1 mM (37). Besides chemical shift probes, the spin relaxation offers an independent measure of the PIP2 binding. Any thermodynamic equilibrium necessitates certain dynamics. The monomer–oligomer equilibrium of EIAV MA has its intrinsic dynamics which can be judged from several of the Interface Residues and Loop showing extremely elevated R2/R1 values (Figure 3A). To minimize the contribution of the oligomerization to the measured dynamics, we carried out the CPMG relaxation study on a diluted EIAV MA sample (52.4 μM). A successful derivation of kinetic constants requires knowledge about the partitioning of each state and the exact chemical shift difference among states (31), which is not trivial to determine. However, an approximation can be made: the correlation time of any conformational exchange must be close to the experimental spin echo time delay for Rex to contribute (26, 32). Our results suggest that PIP2-C4 binding induces dynamic motion of the Loop region and Interface Residues with time scales of close to 0.5 and 2 ms, respectively.
A fundamental question about the Gag or its MA is whether its oligomerization and PIP2 or inositol phosphates binding are correlated, as suggested by Rein and collaborators in their studies of HIV-1 Gag (38–40). Specifically, inositol hexakisphosphate was found to be able to introduce trimerization of HIV-1 Gag (40). Our results suggest that PIP2 binding in solution is imperceptibly promoting MA trimerization, as judged by the 6% rise in R2/R1 and 5% decrease in the monomer population detected by ultracentrifugation in the presence of PIP2. Although this is not a large effect, the recruiting of Gag to the plasma membrane, if through PIP2, could significantly increase the local MA concentration, which in turn would drive oligomerization effectively. The primary role of PIP2 could be to recruit MA to the plasma membrane during the EIAV budding process, which is perhaps also true for HIV-1 (11, 13). The marginal Kd, being on the order of only 100–200 μM, between PIP2 and MA seems too weak to align Gag molecules on the membrane surface. However, this seemingly small free energy term associated with PIP2 binding could add up quickly in the effectively high local concentration of the Gag proteins assembled during virus budding. A similar idea was proposed (33, 37) and could be a general phenomenon for multi-ligand-based interactions (41).
Supplementary Material
Acknowledgments
We thank Henry Fales for the mass characterization of EIAV MA.
Footnotes
This work was supported by the Intramural Research Program of the National Institutes of Health (NIH), National Heart, Lung, and Blood Institute, to N.T. and Grant R01 AI 068463 from National Institute of Allergy and Infectious Diseases of the NIH to C.C.
Abbreviations: CPMG, Carr–Purcell–Meiboom–Gill; CSM, chemical shift mapping; EIAV, equine infectious anemia virus; EM, electron microscopy; HIV-1, human immunodeficiency virus-1; HSQC, heteronuclear single-quantum correlation spectrum; IPAP, in-phase anti-phase; MA, matrix protein; PIP2, phosphatidylinositol 4,5-diphosphate; RDC, residual dipolar coupling; RSV, Rous sarcoma virus.
SUPPORTING INFORMATION AVAILABLE
A table of alignment tensor parameters (Table S1), a HSQC spectrum (Figure S1), an overlay of HSQC spectra showing the trends of chemical shift changes of D50 and V63 with a concentration increase (Figure S2), profiles of 15N R2/R1 and heteronuclear NOE in the presence of PIP2-C4 (Figure S3), a CPMG R2 profile of EIAV MA alone (Figure S4), and a binding curve of residue 49 as a function of PIP2 titration to the K49A mutant of EIAV compared to the wild-type protein (Figure S5). This material is available free of charge via the Internet at http://pubs.acs.org.
References
- 1.Scarlata S, Carter C. Role of HIV-1 Gag domains in viral assembly. Biochim Biophys Acta. 2003;1614:62–72. doi: 10.1016/s0005-2736(03)00163-9. [DOI] [PubMed] [Google Scholar]
- 2.Morita E, Sundquist WI. Retrovirus budding. Annu Rev Cell Dev Biol. 2004;20:395–425. doi: 10.1146/annurev.cellbio.20.010403.102350. [DOI] [PubMed] [Google Scholar]
- 3.Chapman MS, Liljas L. Structural folds of viral proteins. Adv Protein Chem. 2003;64:125–196. doi: 10.1016/s0065-3233(03)01004-0. [DOI] [PubMed] [Google Scholar]
- 4.Bryant M, Ratner L. Myristoylation-dependent replication and assembly of human immunodeficiency virus 1. Proc Natl Acad Sci USA. 1990;87:523–527. doi: 10.1073/pnas.87.2.523. [DOI] [PMC free article] [PubMed] [Google Scholar]
- 5.Bouamr F, Scarlata S, Carter C. Role of myristylation in HIV-1 Gag assembly. Biochemistry. 2003;42:6408–6417. doi: 10.1021/bi020692z. [DOI] [PubMed] [Google Scholar]
- 6.Zhou W, Parent LJ, Wills JW, Resh MD. Identification of a membrane-binding domain within the amino-terminal region of human immunodeficiency virus type 1 Gag protein which interacts with acidic phospholipids. J Virol. 1994;68:2556–2569. doi: 10.1128/jvi.68.4.2556-2569.1994. [DOI] [PMC free article] [PubMed] [Google Scholar]
- 7.Hill CP, Worthylake D, Bancroft DP, Christensen AM, Sundquist WI. Crystal structures of the trimeric human immunodeficiency virus type 1 matrix protein: Implications for membrane association and assembly. Proc Natl Acad Sci USA. 1996;93:3099–3104. doi: 10.1073/pnas.93.7.3099. [DOI] [PMC free article] [PubMed] [Google Scholar]
- 8.Massiah MA, Starich MR, Paschall C, Summers MF, Christensen AM, Sundquist WI. Three-dimensional structure of the human immunodeficiency virus type 1 matrix protein. J Mol Biol. 1994;244:198–223. doi: 10.1006/jmbi.1994.1719. [DOI] [PubMed] [Google Scholar]
- 9.Matthews S, Barlow P, Clark N, Kingsman S, Kingsman A, Campbell I. Refined solution structure of p17, the HIV matrix protein. Biochem Soc Trans. 1995;23:725–729. doi: 10.1042/bst0230725. [DOI] [PubMed] [Google Scholar]
- 10.McLaughlin S, Murray D. Plasma membrane phosphoinositide organization by protein electrostatics. Nature. 2005;438:605–611. doi: 10.1038/nature04398. [DOI] [PubMed] [Google Scholar]
- 11.Ono A, Ablan SD, Lockett SJ, Nagashima K, Freed EO. Phosphatidylinositol (4,5) bisphosphate regulates HIV-1 Gag targeting to the plasma membrane. Proc Natl Acad Sci USA. 2004;101:14889–14894. doi: 10.1073/pnas.0405596101. [DOI] [PMC free article] [PubMed] [Google Scholar]
- 12.Saad JS, Miller J, Tai J, Kim A, Ghanam RH, Summers MF. Structural basis for targeting HIV-1 Gag proteins to the plasma membrane for virus assembly. Proc Natl Acad Sci USA. 2006;103:11364–11369. doi: 10.1073/pnas.0602818103. [DOI] [PMC free article] [PubMed] [Google Scholar]
- 13.Saad JS, Loeliger E, Luncsford P, Liriano M, Tai J, Kim A, Miller J, Joshi A, Freed EO, Summers MF. Point mutations in the HIV-1 matrix protein turn off the myristyl switch. J Mol Biol. 2007;366:574–585. doi: 10.1016/j.jmb.2006.11.068. [DOI] [PMC free article] [PubMed] [Google Scholar]
- 14.Hatanaka H, Iourin O, Rao ZH, Fry E, Kingsman A, Stuart DI. Structure of equine infectious anemia virus matrix protein. J Virol. 2002;76:1876–1883. doi: 10.1128/JVI.76.4.1876-1883.2002. [DOI] [PMC free article] [PubMed] [Google Scholar]
- 15.Provitera P, Bouamr F, Murray D, Carter C, Scarlata S. Binding of equine infectious anemia virus matrix protein to membrane bilayers involves multiple interactions. J Mol Biol. 2000;296:887–898. doi: 10.1006/jmbi.1999.3482. [DOI] [PubMed] [Google Scholar]
- 16.Koradi R, Billeter M, Wuthrich K. MOLMOL: A program for display and analysis of macromolecular structures. J Mol Graphics. 1996;14:51–55. doi: 10.1016/0263-7855(96)00009-4. [DOI] [PubMed] [Google Scholar]
- 17.Schuck P. On the analysis of protein self-association by sedimentation velocity analytical ultracentrifugation. Anal Biochem. 2003;320:104–124. doi: 10.1016/s0003-2697(03)00289-6. [DOI] [PubMed] [Google Scholar]
- 18.Bax A, Grzesiek S. Methodological Advances in Protein NMR. Acc Chem Res. 1993;26:131–138. [Google Scholar]
- 19.Ottiger M, Delaglio F, Bax A. Measurement of J and dipolar couplings from simplified two-dimensional NMR spectra. J Magn Reson. 1998;131:373–378. doi: 10.1006/jmre.1998.1361. [DOI] [PubMed] [Google Scholar]
- 20.Delaglio F, Grzesiek S, Vuister GW, Zhu G, Pfeifer J, Bax A. NMRPipe: A multidimensional spectral processing system based on UNIX pipes. J Biomol NMR. 1995;6:277–293. doi: 10.1007/BF00197809. [DOI] [PubMed] [Google Scholar]
- 21.Garrett DS, Seok YJ, Peterkofsky A, Clore GM, Gronenborn AM. Identification by NMR of the binding surface for the histidine-containing phosphocarrier protein HPr on the N-terminal domain of enzyme I of the Escherichia coli phosphotransferase system. Biochemistry. 1997;36:4393–4398. doi: 10.1021/bi970221q. [DOI] [PubMed] [Google Scholar]
- 22.Maciejewski MW, Shin R, Pan B, Marintchev A, Denninger A, Mullen MA, Chen K, Gryk MR, Mullen GP. Solution structure of a viral DNA repair polymerase. Nat Struct Biol. 2001;8:936–941. doi: 10.1038/nsb1101-936. [DOI] [PubMed] [Google Scholar]
- 23.Barbato G, Ikura M, Kay LE, Pastor RW, Bax A. Backbone dynamics of calmodulin studied by 15N relaxation using inverse detected two-dimensional NMR spectroscopy: The central helix is flexible. Biochemistry. 1992;31:5269–5278. doi: 10.1021/bi00138a005. [DOI] [PubMed] [Google Scholar]
- 24.Peng JW, Thanabal V, Wagner G. Improved Accuracy of Heteronuclear Transverse Relaxation-Time Measurements in Macromolecules: Elimination of Antiphase Contributions. J Magn Reson. 1991;95:421–427. [Google Scholar]
- 25.Loria JP, Rance M, Palmer AG. A relaxation-compensated Carr-Purcell-Meiboom-Gill sequence for characterizing chemical exchange by NMR spectroscopy. J Am Chem Soc. 1999;121:2331–2332. [Google Scholar]
- 26.Ishima R, Torchia DA. Estimating the time scale of chemical exchange of proteins from measurements of transverse relaxation rates in solution. J Biomol NMR. 1999;14:369–372. doi: 10.1023/a:1008324025406. [DOI] [PubMed] [Google Scholar]
- 27.Zweckstetter M, Bax A. Prediction of sterically induced alignment in a dilute liquid crystalline phase: Aid to protein structure determination by NMR. J Am Chem Soc. 2000;122:3791–3792. [Google Scholar]
- 28.Cornilescu G, Marquardt JL, Ottiger M, Bax A. Validation of protein structure from anisotropic carbonyl chemical shifts in a dilute liquid crystalline phase. J Am Chem Soc. 1998;120:6836–6837. [Google Scholar]
- 29.Bax A. Weak alignment offers new NMR opportunities to study protein structure and dynamics. Protein Sci. 2003;12:1–16. doi: 10.1110/ps.0233303. [DOI] [PMC free article] [PubMed] [Google Scholar]
- 30.Kern D, Zuiderweg ER. The role of dynamics in allosteric regulation. Curr Opin Struct Biol. 2003;13:748–757. doi: 10.1016/j.sbi.2003.10.008. [DOI] [PubMed] [Google Scholar]
- 31.Palmer AG, III, Kroenke CD, Loria JP. Nuclear magnetic resonance methods for quantifying microsecond-to-millisecond motions in biological macromolecules. Methods Enzymol. 2001;339:204–238. doi: 10.1016/s0076-6879(01)39315-1. [DOI] [PubMed] [Google Scholar]
- 32.Palmer AG., III NMR characterization of the dynamics of biomacromolecules. Chem Rev. 2004;104:3623–3640. doi: 10.1021/cr030413t. [DOI] [PubMed] [Google Scholar]
- 33.Murray PS, Li ZH, Wang JY, Tang CL, Honig B, Murray D. Retroviral matrix domains share electrostatic homology: Models for membrane binding function throughout the viral life cycle. Structure. 2005;13:1521–1531. doi: 10.1016/j.str.2005.07.010. [DOI] [PubMed] [Google Scholar]
- 34.Alfadhli A, Huseby D, Kapit E, Colman D, Barklis E. Human immunodeficiency virus type 1 matrix protein assembles on membranes as a hexamer. J Virol. 2007;81:1472–1478. doi: 10.1128/JVI.02122-06. [DOI] [PMC free article] [PubMed] [Google Scholar]
- 35.Tang C, Loeliger E, Luncsford P, Kinde I, Beckett D, Summers MF. Entropic switch regulates myristate exposure in the HIV-1 matrix protein. Proc Natl Acad Sci USA. 2004;101:517–522. doi: 10.1073/pnas.0305665101. [DOI] [PMC free article] [PubMed] [Google Scholar]
- 36.Scheifele LZ, Rhoads JD, Parent LJ. Specificity of plasma membrane targeting by the Rous sarcoma virus Gag protein. J Virol. 2003;77:470–480. doi: 10.1128/JVI.77.1.470-480.2003. [DOI] [PMC free article] [PubMed] [Google Scholar]
- 37.Dalton AK, Murray PS, Murray D, Vogt VM. Biochemical characterization of Rous sarcoma virus MA protein interaction with membranes. J Virol. 2005;79:6227–6238. doi: 10.1128/JVI.79.10.6227-6238.2005. [DOI] [PMC free article] [PubMed] [Google Scholar]
- 38.Campbell S, Fisher RJ, Towler EM, Fox S, Issaq HJ, Wolfe T, Phillips LR, Rein A. Modulation of HIV-like particle assembly in vitro by inositol phosphates. Proc Natl Acad Sci USA. 2001;98:10875–10879. doi: 10.1073/pnas.191224698. [DOI] [PMC free article] [PubMed] [Google Scholar]
- 39.Shkriabai N, Datta SA, Zhao Z, Hess S, Rein A, Kvaratskhelia M. Interactions of HIV-1 Gag with assembly cofactors. Biochemistry. 2006;45:4077–4083. doi: 10.1021/bi052308e. [DOI] [PubMed] [Google Scholar]
- 40.Datta SA, Zhao Z, Clark PK, Tarasov S, Alexandratos JN, Campbell SJ, Kvaratskhelia M, Lebowitz J, Rein A. Interactions between HIV-1 Gag molecules in solution: An inositol phosphate-mediated switch. J Mol Biol. 2007;365:799–811. doi: 10.1016/j.jmb.2006.10.072. [DOI] [PMC free article] [PubMed] [Google Scholar]
- 41.Kiessling LL, Gestwicki JE, Strong LE. Synthetic multivalent ligands in the exploration of cell-surface interactions. Curr Opin Chem Biol. 2000;4:696–703. doi: 10.1016/s1367-5931(00)00153-8. [DOI] [PubMed] [Google Scholar]
Associated Data
This section collects any data citations, data availability statements, or supplementary materials included in this article.