Abstract
We present a method to solve a convection-reaction system based on a least-squares finite element method (LSFEM). For steady-state computations, issues related to recirculation flow are stated and demonstrated with a simple example. The method can compute concentration profiles in open flow even when the generation term is small. This is the case for estimating hemolysis in blood. Time-dependent flows are computed with the space-time LSFEM discretization. We observe that the computed hemoglobin concentration can become negative in certain regions of the flow; it is a physically unacceptable result. To prevent this, we propose a quadratic transformation of variables. The transformed governing equation can be solved in a straightforward way by LSFEM with no sign of unphysical behavior. The effect of localized high shear on blood damage is shown in a circular Couette-flow-with-blade configuration, and a physiological condition is tested in an arterial graft flow.
Keywords: convection-reaction system, variable transformation, least-squares finite element method, space-time formulation, nonlinear dynamics, blood damage estimation
1. Introduction
Convection-reaction equations are hyperbolic partial differential equations that arise from various engineering applications, e.g. blood damage estimation in medical devices, petroleum reservoir simulation, and ground-water contamination remediation [1, 2].
The equations can be derived from the general transport equations (convection-diffusion-reaction equations) by omitting diffusion when the convective flux dominates over diffusive flux. The solutions to these equations usually have moving steep fronts of the transported quantity that lead to serious numerical difficulties. In practice, the computed approximate solutions suffer from (a series of) overshoots and/or undershoots in the quantity; a situation that may cause negative values when only positive ones are expected.
The literature on the computational treatment of convection-reaction systems is not as extensive as that for convection-diffusion systems. Ewing et al. [2] approximated a solution by spline wavelets in the Eulerian-Lagrangian localized adjoint method (ELLAM). They focused on shock-tracking by adding fine wavelet corrections near steep fronts. However, the Lagrangian framework requires the method of characteristics, and is not trivial in complicated flow conditions with complex flow geometries. Ha and Kim [3] tested various explicit time-integration schemes for a convection-reaction equation, and showed that some integration schemes broke down more readily than others.
Other than the Lagrangian framework, the discontinuous-Galerkin finite element method (DGFEM) has become popular because it can accommodate shocks or discontinuities naturally [4]. Lacasse et al. [5] developed a DGFEM for the hemoglobin concentration estimation in blood devices. Accurate results were obtained for simple flow configurations using an adaptive mesh scheme. Yet, the error analysis required for the adaptive scheme is expensive because the error variable for the scheme must be approximated by basis functions higher-order than that of the concentration variable. Furthermore, some results exhibited negative concentrations, which are physically unacceptable.
Other approaches developed for convection-dominated systems are based on flux limiters, which adaptively blend high- and low-order discretizations, e.g., flux-corrected transport (FCT) and total variation diminishing (TVD) [6, 7]. Originally, standard limiters like minmod or superbee were designed for the 1D convection equation discretized by finite differences on a uniform mesh. Recently, both the FCT and TVD schemes were adapted to finite element methods, e.g., FEM-FCT [8, 9] and FEM-TVD [10]. When the schemes are successfully applied, they can provide sharp resolution of discontinuities, and therefore maintain the positivity of the transported quantity. In both cases, however, mass lumping is mandatory and there is an ambiguity in the choice of the limiter function [11]. Moreover, FEM-FCT suffers from severe convergence problems in the steady-state limit [10].
In summary, previous methods focused on improving accuracy in simple flow configurations. However, they are not easily applicable to a flow system with complex geometries because: (a) the algorithm based on the shock-tracking requires an adaptive addition of wave packets that is not trivial in handling multiple shock fronts [2]; (b) adaptive mesh algorithms are computationally expensive [5]; and (c) the flux limiter based methods require relatively complicated algorithms in the finite element framework [10, 11].
Here we present a numerical method based on a least-squares finite element method (LSFEM) that is simple enough to apply to complex flow systems, yet sufficiently accurate. We also present a transformed convection-reaction equation that overcomes the problem of negative concentration without requiring major modifications to the method itself.
We choose the problem of mechanical blood damage estimation [1, 12] as an example of a convection-reaction system. In this problem, damage is quantified by the amount of plasma-free (PF) hemoglobin, i.e., hemoglobin in blood plasma. Inside medical devices, it is released from the red blood cell distorted under shear flows. This particular example has an unusual coupling between the convection and reaction terms involving the shear rate, such that a sudden surge in the shear rate leads to a steep hemoglobin concentration gradient; this can cause the computed concentration to be negative, which is unphysical.
2. Scalar convection-reaction system
2.1. Governing equation for a convection-reaction system
The material balance for the PF hemoglobin can be described as a convection-diffusion-reaction equation:
| (1) |
where u is the fluid velocity, jcHb is the diffusive hemoglobin flux, and rΔHb is the PF hemoglobin generation rate. Under normal conditions, the PF hemoglobin concentration in blood flow is small; therefore, its diffusive flux is governed by Fick’s law:
| (2) |
where DcHb = 6×10⁻⁷ cm2/s is the self-diffusion coefficient for the hemoglobin [13].
For blood flow in typical biomedical devices, the characteristic length and velocity are L ~
 (1 cm) and V ~
 (10 cm/s), yielding a Péclet number
| (3) |
In other words, diffusion is negligible in typical device flows. Because blood is incompressible, Eq. (1) becomes a convection-reaction equation. When the total (sum of both RBC and plasma) hemoglobin concentration is constant, the PF hemoglobin concentration cHb can be written in terms of the ratio fHb between the PF hemoglobin and the total hemoglobin in the blood. For hemolysis in medical devices, the total hemoglobin is practically constant over time. Then the governing equation for the PF hemoglobin can be written as
| (4) |
The hemoglobin generation rate rΔHb requires a constitutive relationship between PF hemoglobin and shear stress. Garon and Farinas [12] and Farinas et al. [14] proposed two different linearized blood damage rate equations (without or with saturation effect) based on an experimental correlation by Giersiepen et al. [15]:
| (5) |
| (6) |
where mHb = 2.416/0.785 = 3.078, AHb = (3.62 × 10⁻⁷)1/0.785(μb)mHb, μb is blood viscosity, and Gf is a scalar shear rate. We use , where IIS is the second invariant of the rate of strain S = 1/2(∇u + ∇uT). Equation (6) has a saturation term (1 − fHb) that limits the maximum fHb to unity. For small fHb, Eq. (6) approaches Eq. (5), asymptotically.
2.2. Computation of flows with recirculations
For steady-state computation, the hyperbolic governing equation (4) needs an inlet boundary condition. However, there is no inlet boundary in a recirculating flow, and thus without the saturation effect in rΔHb, Eq. (4) is ill-posed: fHb grows without bound along recirculating streamlines. With the saturation effect in rΔHb, i.e. Eq. (6), the problem affords a sensible steady-state solution, i.e., fHb = 1 in a recirculating flow.
Garon and Farinas [12] proposed a “fast” hemolysis estimation for steady-state analysis based on a global balance. However, the problem mentioned above complicates a global material balance for a steady flow with recirculating zones. According to Garon and Farinas [12], the balance in a sudden-expansion flow (Fig. 1) is,
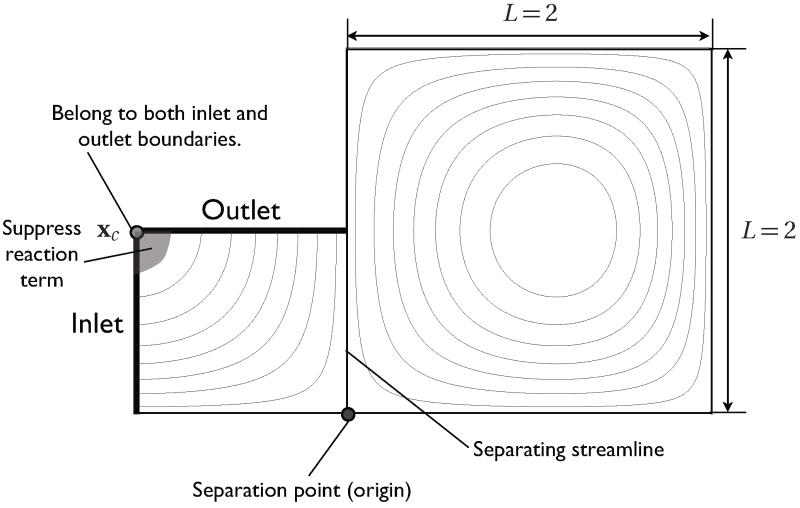
Figure 1.
Flow domain consists of an open-flow domain and a closed-flow domain. Note that there is no flux across the separating streamline.
| (7) |
where Ω = Ωo ∪ Ωr. Here, Ωo stands for open flow domain (with inlet boundary Γi and outlet boundaries Γo) and Ωr for recirculating flow domain, bounded by separating streamlines.
After applying the divergence theorem with zero inlet fHb, the balance equation becomes
| (8) |
where Γo is the outlet boundary and jHb,o is the hemoglobin flux across Γo. Garon and Farinas [12] used Eq. (8) to estimate jHb,o by integrating the reaction term over a given flow domain.
The total hemoglobin generation rate inside Ω can be divided into contributions from Ωr and Ωo. Therefore, the flux-averaged PF hemoglobin fraction f̄Hb can be expressed as
| (9) |
where q = ∫Γn · u dΓ is the flow rate, and (A) and (B) stand for the total hemoglobin generation rate contribution from Ωr and Ωo, respectively. The terms (A) and (B) come from two different material balances for Ωr and Ωo:
| (10) |
| (11) |
The first term of Eq. (10) vanishes, because there is no flux across Ωr.
For the reaction rate equation without a saturation effect, Eq. (5), the balance equation (10) is not valid because a steady state cannot be achieved in Ωr. Therefore, Eq. (9) will overestimate the hemoglobin flux by (A).
For the reaction rate equation with a saturation effect, Eq. (6), the balance equation becomes trivial: both terms in the left hand side of the balance equation vanish at the solution fHb = 1. In order to estimate the flux-averaged hemoglobin fraction, Farinas et al. [14] proposed a method to evaluate f̄Hb dividing the governing equation by 1 − fHb, i.e.
| (12) |
Note that the R.H.S. of the equation does not contain fHb so that the flux-averaged fHb can be evaluated without knowing fHb inside Ω (See Farinas et al. [14] for details). The method cannot, however, be applied in Ωr, because it requires fHb ≠ 1.
In a complex flow, it is not trivial to evaluate the global balance for the open flow domain(s) only. For example, one may need to determine whether a given element belongs to the open flow domain or not. Furthermore, some elements may straddle both open and closed flow domains at the same time. Finally, using continuous basis functions will induce some diffusion across separating streamlines. For these reasons, the concentration field must be computed in the whole flow domain to estimate the outlet flux.
3. Numerical method
3.1. Quadratic variable transformation
In the hemolysis estimation, the reaction term depends on a scalar fluid shear rate Gf from the pre-computed velocity field that is also used in evaluating the convection term. This coupling between convection and reaction is unusual. Moreover, the reaction term is always positive (there is no consumption term and Gf > 0).
However, small negative fHb values were reported, e.g. Fig. 11a of Lacasse et al. [5]. The values are typically observed near the regions where Gf changes abruptly, but they are not confined to the regions. They are spread out widely, usually along flow directions most likely due to convection. Overall, this symptom is called a “negative concentration” problem.
The velocity field is represented by continuous linear finite element basis functions so that the velocity gradient (and the shear rate) is discontinuous across element boundaries. The resulting discontinuous reaction term may lead to instabilities in fHb (caused by sharp gradients of the term [5]). To prevent this, we project the computed velocity gradients onto continuous linear basis functions by a least-squares projection method [16]. However, the projection method was not able to solve the negative concentration problem completely.
We propose a method to overcome the problem by expressing fHb:
| (13) |
where c is a real number and is a base value for the PF hemoglobin fraction. Because c2 is positive, fHb is always larger than .
For the steady-state computation, one can use the inlet fraction as and set c = 0 at the inlet boundary. For the transient problem, can be used as an initial value, with at the inlet boundary.
In typical biomedical devices, changes in fHb between the inlet and outlet of medical devices are lower than order 10−6 [12, 17], so that it is desirable to adjust c by a scaling factor κ. Defining C = κc, the governing equation (4) becomes
| (14) |
This leads to two possible governing equations:
| (15) |
| (16) |
From now, we will call Eqs. (4), (15), and (16) as the NF, S1, and S2 formulations, respectively.
The S1 formulation may suffer from inaccuracies for small C. The S2 formulation requires special care due to the singularity at C = 0. The condition C = 0 cannot be used as either an initial guess for the steady-state problem or an initial condition for the transient problem. One may also find difficulty in solving the equations using the standard Newton’s method, because of an extremely large residual value for small C; this difficulty can be overcome by the relaxed Newton’s method (see Sec. 3.2).
C = 0 can be, however, imposed at the inlet boundary with the finite element method; C values at numerical quadrature points for evaluating the residual for the governing equation are not on boundary. A typical inlet velocity profile has non-zero shear rate that increases the value of C slightly; exceptions include, for example, plug flow at the inlet. Therefore, C inside the flow domain is guaranteed to be always positive.
Another approach for solving the S2 formulation is to reduce the numerical singularity by modifying the governing equation. Here, we substitute 1/C by , where εr is a regularization parameter. The regularized formulation becomes
| (17) |
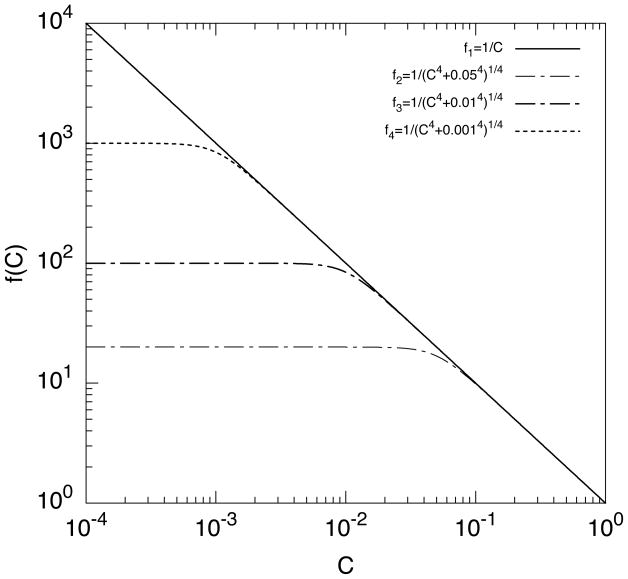
The effect of the regularizing of 1/C is shown in Fig. 2 by comparing the original equation f1 = 1/C with the regularized equations with different εr: f2, f3, and f4. For example, the function with εr = 0.01 yields virtually the same value as 1/C for C ≳ 0.01. Note that the fourth power in the regularized equation is chosen such that it leads to a sharp “cut-off” of large value near C ~ εr.
Figure 2.
Effect of regularization of 1/C with respect to the parameter εr. f1, f2, f3 and f4 have εr = 0, 0.05, 0.01 and 0.001, respectively.
For successful solution of both unregularized and regularized S2 formulations, the choice of κ2 is important. The computed C values must be reasonably far away from C = 0 in order to avoid numerical singularity. At the same time, the values need to small enough to avoid the loss of accuracy due to high sensitivity near large C. Note that fHb ∝ C2. With a proper κ2, we found that εr ≤ 0.01 is a reasonable choice.
3.2. Space-time least-squares finite element method
We choose a least-squares finite element method to solve the governing equation. The method can be used in a straightforward manner for any of the formulations presented: NF, S1, and S2. To handle the transient problem, the space-time formulation is deployed; the finite element basis functions for space are continuous, but the basis functions for time are discontinuous across a space-time slab interfaces [18]. The resulting method is called the space-time least-squares finite element method (ST/LSFEM).
There have been several studies on this method, for example Jiang and Carey [19] and Pontaza and Reddy [20]. Here, we introduce a “jump” term in the least-squares functional that weakly imposes continuity of variables across the space-time slab interface. For a homogeneous scalar equation with linear-in-time approximation, the method is known to have third order accuracy [21].
In the space-time formulation, we partition the time interval [0, T] into subintervals In = [tn, tn+1]. Letting the space domain at time tn be denoted Ωn = Ωtn and its boundary Γn = Γtn, one can define a space-time slab Qn as the domain enclosed by the surfaces, Ωn and Ωn+1, and Pn, where Pn is the surface described by the boundary Γn as t traverses In. Here, we specify the variable (fHb or C) at the inlet boundary of the space-time domain (Pn)g. For each space-time slab interface, we define finite element basis function space for the variable:
| (18) |
The least-squares statement for a space-time slab Qn can be written as:
| (19) |
where the variable a depends on the formulation: a = fHb for M = NF, and a = C for both M = S1 and M = S2. In the above equation, the following notations are applied:
The approximated solution by finite element basis functions is obtained by minimizing the weighted residuals:
| (20) |
where . Here, φi is a continuous linear basis function and ai is its coefficient. Tables 1 and 2 respectively summarize the equations for the raw residuals RM, and the sensitivities of the residuals with respect to variables ∂RM/∂ai. Note that the jump term in Eq (20) only appears when node i belongs to Ωn. Hence, the overall effect of the jump term is minimizing the discontinuity of variable a across Ωn.
Table 1.
Raw residuals for least-squares formulation with Eq. (6)
| Raw residuals | Expressions | |
|---|---|---|
| RNF(fHb) |
|
|
| RS1(C) |
|
|
| RS1(C) |
|
|
Table 2.
Sensitivity of raw residuals with respect to or Ci with Eq. (6).
| Sensitivity | Expressions | ||
|---|---|---|---|
|
|
|
||
|
|
|
||
|
|
|
We used Newton’s method for the NF and S1 formulations. However, during Newton’s method for S2 formulation, a sudden surge in the norm of residual vector was observed due to the 1/C term; the norm does not decrease below a certain value. A relaxed Newton’s method based on an adaptive relaxation parameter can alleviate this problem.
In the relaxed Newton’s method, N non-linear algebraic equations for ai (c.f. Eq. (20)) are solved iteratively using:
| (21) |
where
is the relaxation coefficient, and
 is the Jacobian components that have linear terms only, and is defined as:
| (22) |
Here, the superscripts m and m + 1 indicate the current and next iteration steps. Note that
corresponds to the standard Newton’s method (used for NF and S1 formulations). We applied the method until the
 norm of residual vector
or solution update vector δa(m) = [δa1,(m), δa2,(m), … δaN,(m)]T falls below a certain threshold εt, e.g., 10−8.
We use an update scheme for the m+1th step relaxation parameter based on
| (23) |
Update (A) occurs when a norm of current step’s residual vector is greater than a norm of previous step’s residual vector for mA consecutive steps. Update (B) occurs when a norm of current step’s residual vector is less than a norm of previous step’s residual vector for mB consecutive steps. Here, the minimum and maximum allowed during update are 0.1 and 1, respectively. We found that mA = 1 and mB = 5 worked successfully for many cases.
For the steady-state formulation, all jump terms in Eqs. (19) – (22) need to be neglected. Integrals over the space-time slab in those equations have to be re-written in terms of integral over the spatial domain only, i.e., substitute ∫Qn · dQ to ∫Ω · dΩ. Also, all derivatives with respect to time in Tables 1 and 2 need to be ignored.
4. Numerical experiments
A major problem in the numerical treatment of a convection-reaction system manifests itself as an unwanted numerical diffusion; it is almost impossible to exclude this diffusion completely. Even with the adaptive discontinuous Galerkin finite element method, some solutions were not free from such diffusion [5].
Another serious problem is caused by the numerical diffusion across separating streamlines. When one of the sides across the streamline has flow recirculation, a large concentration jump across the streamline is possible, and may lead to high artificial diffusion. Here, we test the effect of numerical diffusion across the streamline in the context of ST/LSFEM in a simplified flow system modified from Lacasse et al. [5].
4.1. Two-dimensional recirculating flow
The flow is based on the two-dimensional velocity profile u = iu + jv:
| (24) |
| (25) |
where
 is chosen as 0.133 to make the maximum Gf unity.
The velocity profile sets the separating streamline aligned to y axis as shown in Fig. 3. There are two different types of flow on either side of the separating streamline: the inlet/outlet flow in ΩIO and the recirculation flow in ΩR. Using this flow system, we will test the numerical diffusion across the streamline for different mesh configurations and formulations (NF, S1, and S2).
Figure 3.
Recirculating flow streamline plot
To test the effect of the magnitude of the reaction rate on the numerical diffusion, we use a convection-reaction equation in the following form:
| (26) |
model reaction:
| (27) |
where n is the normalized concentration, m is chosen as unity, A is the magnitude factor for the rate r, and d* is a modification factor defined as
| (28) |
which suppresses a spurious peak near the corner xc arising from treating the corner as the inlet boundary. Note that the corner xc belongs to both inlet and outlet boundaries. Without d*, either treating xc as a part of inlet or outlet leads to a spurious peak near xc. We designed and tested d* such that it does not affect solutions near the separating streamline. Here, we set n = 0 for the inlet boundary.
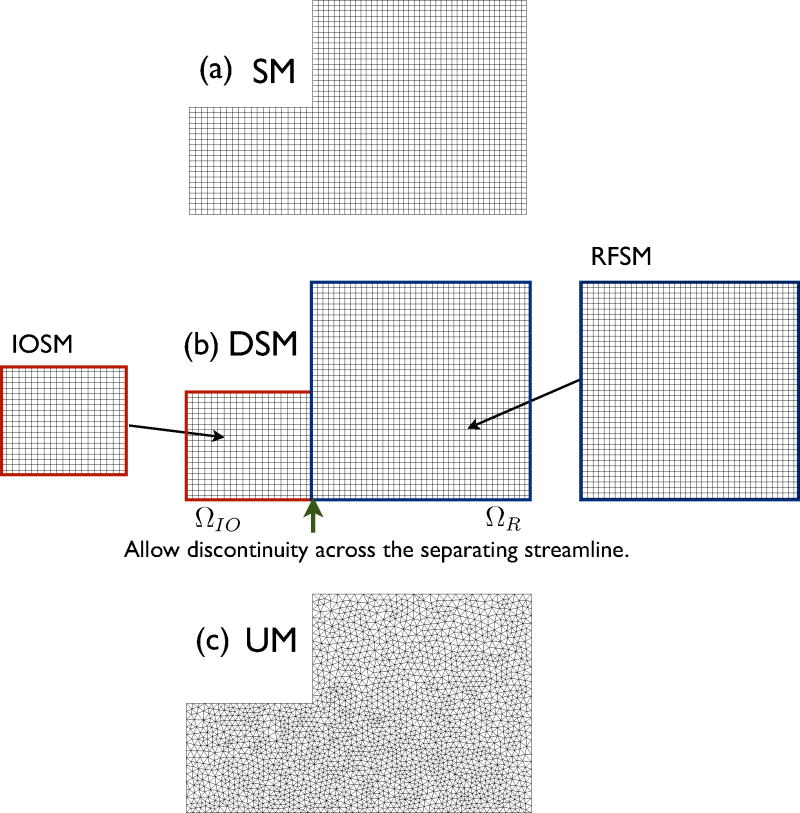
To test the numerical diffusion across the separating streamline, we prepared three different meshes as shown in Fig. 4. The structured mesh SM has the relevant mesh boundaries aligned to the separating streamline, but the unstructured mesh UM does not. A solution free of the diffusion across the streamline was obtained by the special mesh DSM. The mesh DSM is constructed from two distinct structured meshes for ΩIO and ΩR, which hereafter are respectively called IOSM and RFSM. The solution is obtained by combining results from both meshes after solving on them separately. The effect is the same as using discontinuous basis functions across the streamline in order to capture a discontinuous concentration profile. Note that there are two different concentration variables per node along the separating streamline.
Figure 4.
The three different meshes for the recirculating flow. SM, DSM and UM stand for structured mesh, discontinuous structured mesh and unstructured mesh. DSM consists of two separate structured meshes for inlet/outlet flow domain ΩIO IOSM and recirculating flow domain ΩR RFSM. SM consists of 2000 quadrilateral elements and 4202 nodes. UM consists of 4138 triangular elements and 4298 nodes. DSM is similar to SM, but it allows discontinuity in variable across the separating streamline.
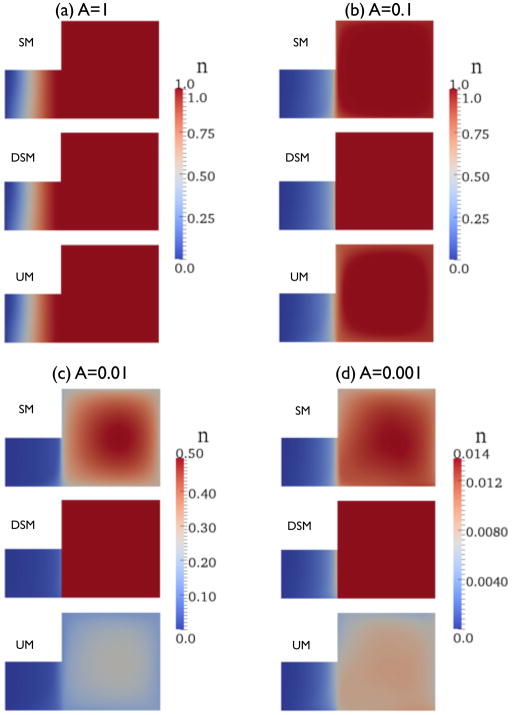
As discussed in Sec. 2.2, the “true” concentration profile is discontinuous across the separating streamline, especially for small A. On the streamline, n is always unity in RFSM for any A, but is different from unity in IOSM for small A (Fig. 5).
Figure 5.
Normalized concentration n plot for different A. Color of contour plot is based on minimum and maximum values of SM for each A and n = 1 for ΩR (RFSM part) of DSM. Note that results from SM and UM for A = 0.001 has negative concentration near the upper right part.
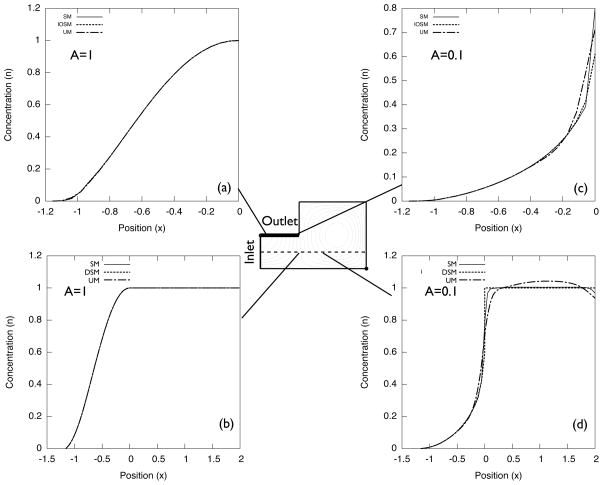
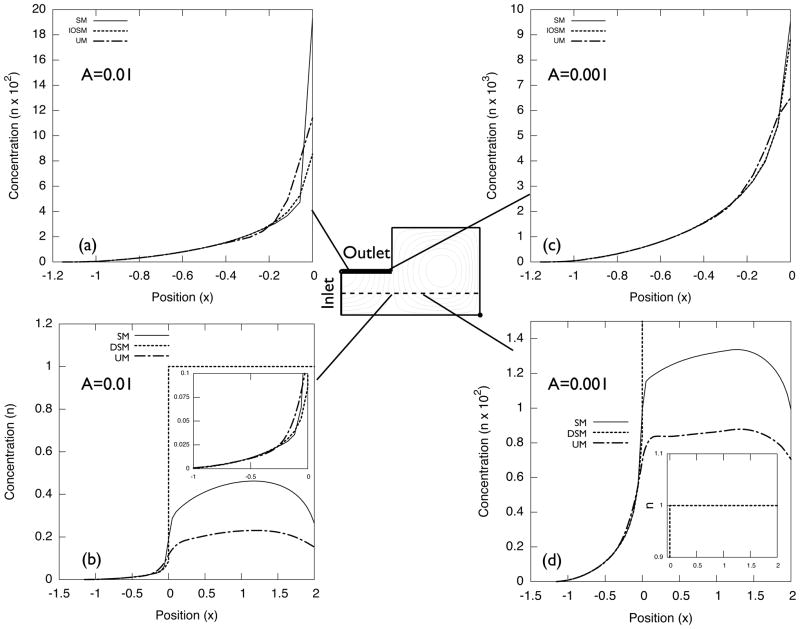
Solutions always suffer from numerical diffusion, when the discontinuous concentration profile is not treated by a special method. The degree of this diffusion increases as A decreases because the jump of n across the streamline increases. When mesh boundaries are not aligned to the streamline, the solution has more diffused concentration profile near the streamline (i.e., UM yields more diffusive results than SM). Figures 6 and 7 show the concentration profile along the outlet boundary (bold line) and y = 0.5 (dotted line). Solutions on both SM and UM for A = 1 capture accurate n profiles. For A = 0.1 and 0.01, n inside the vortex deviates from unity and the deviation increases as A decreases. For these A values, both the recirculation flow and the inlet/outlet flow suffered from numerical diffusion.
Figure 6.
Normalized concentration n profile for A = 1 and A = 0.1.
Figure 7.
Normalized concentration n profile for A = 0.01 and A = 0.001.
When A is decreased further, e.g., A = 0.001, n inside the vortex becomes order of 10−2. Unlike for moderately small A (A = 0.1 and A = 0.01), the concentration profiles within ΩIO on SM and UM become close to the profile in IOSM, as shown in Fig. 7(c) and (d).
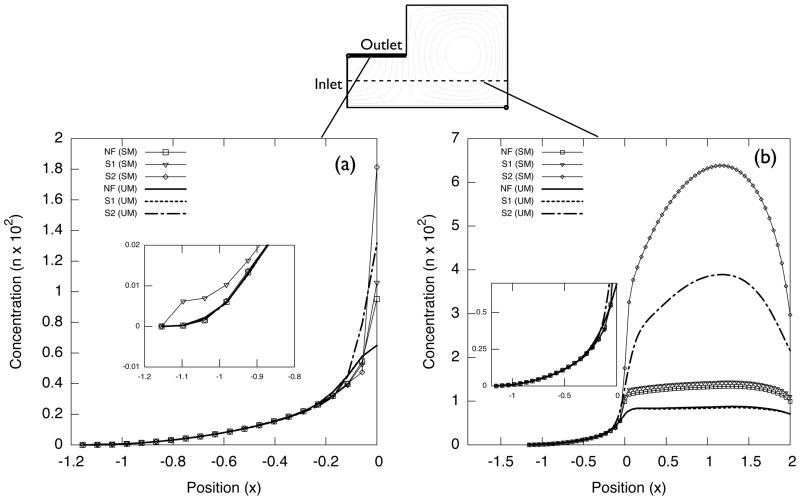
We checked the effect of the quadratic variable transformation on the numerical diffusion issue. For the transformed governing equations, we used the scaling factor κ2 = 102. Figure 8 shows a comparison in the solutions of the original equation (NF) and the transformed ones (S1 and S2). In general, the S2 formulation yields larger n than that of the other formulations inside a flow recirculation zone.
Figure 8.
Normalized concentration n profile for different NF, S1, and S2 formulation.
We also checked the effect of mesh type by comparing results from SM and UM. Usually, n values inside the vortex in SM have larger values than those from the other meshes. In ΩIO, n values are virtually the same except near the separating streamlines, regardless of formulation or mesh choice.
There is a small deviation in n profile near the corner xc for S1 formulation as shown in the inset of Fig. 8(a): streamlines turn sharply toward the outlet, and their lengths are short. In other words, inaccuracies in concentration do not propagate over a long distance. They may, however, lead to problems in other flows that have long streamlines across regions of low concentration. Based on the above analyses, we decided to use the S2 formulation.
We conclude that ST/LSFEM with transformed governing equations can capture reasonably accurate concentration profiles of the PF hemoglobin, except in the recirculating flow region(s). For hemolysis estimation, A is extremely small (6.2306 × 10⁻⁹, c.f. Eq. (5)). Therefore, in steady-state computations, the method cannot predict accurate concentrations inside regions of flow recirculation, where the concentration is already known without computation. However, the computed field outside flow recirculation are reasonably accurate and so is the outlet hemoglobin flux.
5. Examples
In this study, we consider two examples: a modified circular Couette flow and an arterial graft flow.
5.1. Circular Couette flow with blade configuration
Circular Couette devices have typically been used in blood damage experiments [22], because they offer a simple way to impose a uniform shear rate on the RBCs. A typical device consists of two concentric cylinders, where the outer cylinder rotates at a constant angular speed (setting the shear rate). In the absence of Taylor-Couette vortices, the governing equation (4) can be easily reduced to an ordinary differential equation.
However, when a blade is introduced, the streamlines lose concentricity so that fHb needs to be computed by solving Eq. (4) directly. The blade imposes a periodic high-shear impulse that is akin to a flow in an axial blood pump.
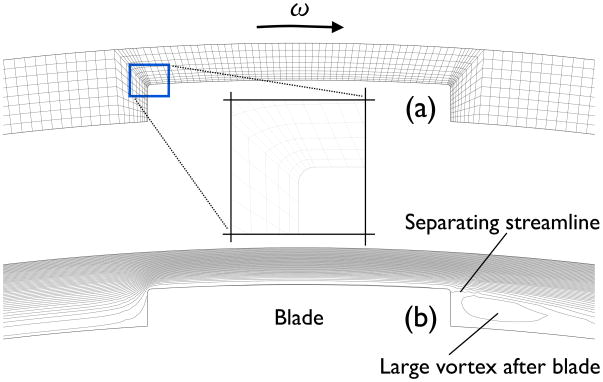
Here, we consider the two-dimensional flow with following configuration. The inner and outer cylinder radii are Ri = 34 mm and Ro = 35 mm. The outer cylinder is rotating with a prescribed angular speed ω(t) = 10 × min(t, 0.5) rad/s. The blade is 0.5 mm tall and 4 mm wide, and is attached to the inner cylinder. The corners are rounded with the radius 50 μm to reduce the stress singularity, as shown in Fig. 9(a).
Figure 9.
Mesh (a) and streamline plot (b) near the blade of the circular Couette system with blade configuration. Radius of curvature of the rounded corner is Rr = 50 μm. 5805 linear quadrilateral finite elements are used to descretize the flow system.
The velocity field of the blood flow (assumed to be Newtonian) was computed by Galerkin/least-squares (GLS) finite element method with bilinear basis functions for both velocity and pressure (for a review of governing equations for the blood flow and the GLS method, see Behbahani et al. [23]).
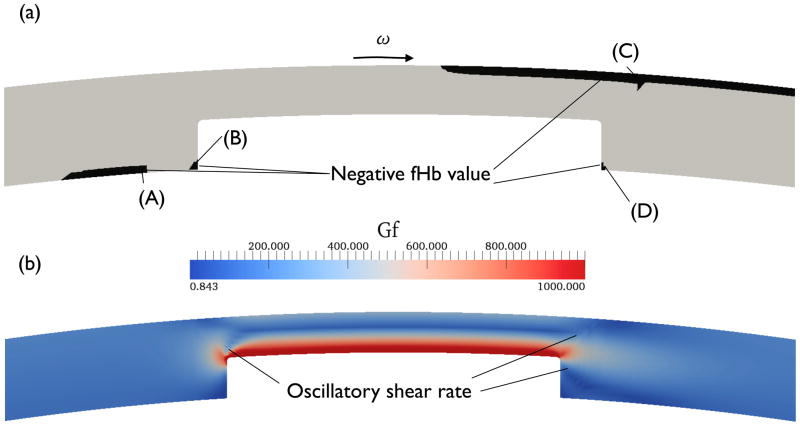
To illustrate the negative concentration problem, the fHb field was computed from the NF formulation. The time step size is Δt = 0.01 s, and the linearized reaction rate with the saturation effect, Eq. (6), is used (the scaling factor κ2 = 107). Even with a non-zero initial condition (e.g. fHb,i = 10−13), there are regions with negative fHb values, as shown in Fig. 10(a), where the magnitude of the minimum negative value (−5.1 × 10⁻⁹) is comparable to that of the maximum positive value (2.1 × 10⁻⁷). Some of the negative fHb values were spread along the flow direction, as shown in regions (A) and (C) of Fig. 10(a), whereas some of the negative values appear near region (C) where the shear rate GF is changing abruptly with showing an oscillatory behavior (see Fig. 10(b) for the shear rate contour plot). However, it is difficult to find a direct correlation between a negative value and an oscillatory shear rate region. For example, non-oscillatory Gf regions (A), (B), and (D) also show negative fHb.
Figure 10.
Negative fHb (a) and projected shear rate Gf (b) plots near the blade of the circular Couette system at t = 1 sec from NF formulation at t = 1 s. Other then red color regions of (a) represent negative fHb. In order to contrast oscillatory behaviors of Gf, the maximum value of Gf in (b) is limited to 1000 1/s.
To prevent negative concentrations, we use the S2 formulation to compute fHb. The initial condition was the same as for the NF formulation (C = 0.001 with κ2 = 107). Because fHb and C in this specific flow system always increase with time, there is no point to use the regularized formulation.
The computed fHb is converted to a normalized index of hemolysis (NIH), which is widely used in reporting blood damage. The value is directly converted from fHb according to [17]:
| (29) |
where Hct is the blood hematocrit (45% for a healthy person) and κc is the hemoglobin content of blood (150 g/L for a healthy person). Note that is used in evaluating NIH because we use the linearized reaction rate [12, 14].
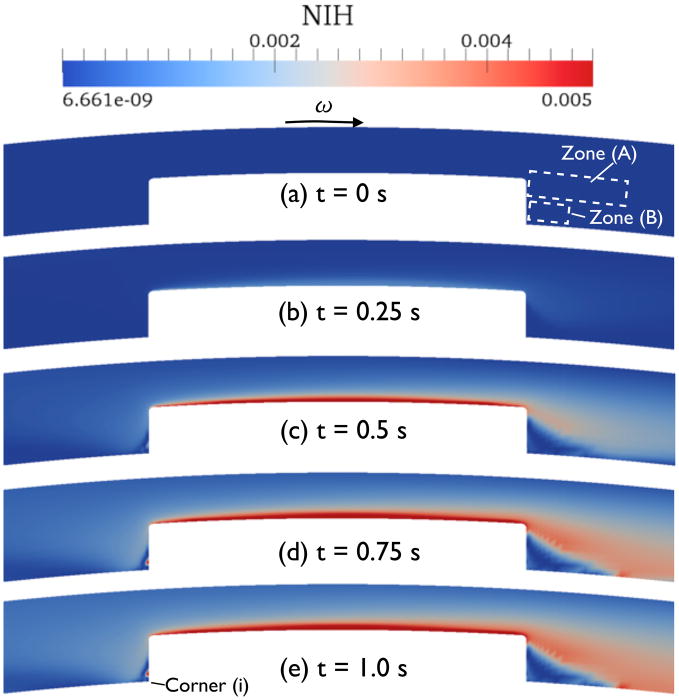
Figure 11 shows the time evolution of NIH values near the blade (the scale in the plots is set to emphasize the high-NIH regions). The maximum NIH value during the transient computation (t < 1.0 s) was NIH = 0.0638 on the blade surface close to the downstream corner. The NIH was found to oscillate slightly inside zone (A) as indicated in Fig. 11, especially for t > 0.5 sec. This zone coincides with the downstream region of oscillatory Gf in Fig. 10(b). One can reduce this spurious oscillation by increasing node density near the blade corner or adjusting the mesh to align it with the streamline.
Figure 11.
Evolution of NIH value in the circular Couette flow with blade configuration as time progresses.
A large vortex is observed downstream of the blade as shown in Fig. 9(b). NIH values inside the vortex increase over time, as shown in Fig. 11(c) to (e). Note that the vortex not only hemolyzes RBC but also traps the PF hemoglobin near the blade. However, the low shear zone (B) slightly below the vortex exhibits low NIH values. This is a clear evidence that there is another separating streamline below the large vortex that prevents an influx of the hemoglobin. Because we did not round bottom corners of the blade near the inner cylinder, there must be a cascading vortex structure near these corners (often called corner vortices) as predicted by Moffatt [24]. However, the mesh is not designed sufficiently to capture such a small flow feature. The lack of precision in the flow solution may lead to an inaccuracy in the NIH prediction in the corners, but the important features of the solution should not be affected, because the effect is locally-confined by separating streamlines. Moreover, the scale of such vortex structures can be comparable to or smaller than the size of RBC. In short, it may not be suitable to consider the effect of this small flow feature in hemolysis estimation.
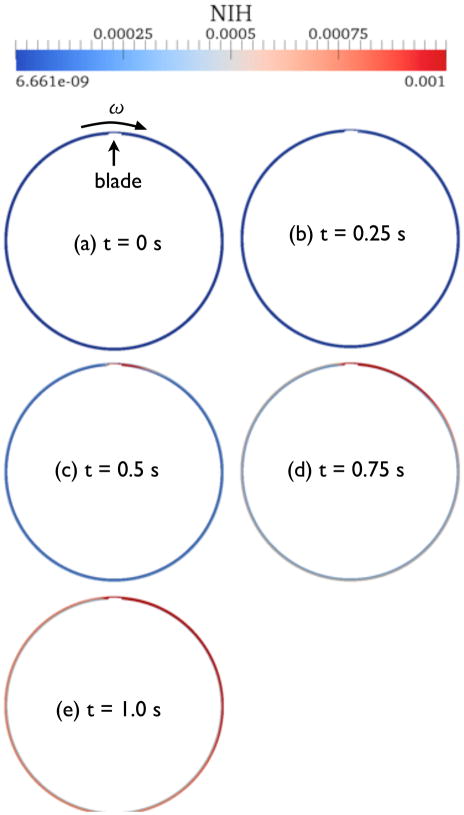
The hemoglobin concentration near the blade changes slowly for t > 0.5 s, but the generated PF hemoglobin contaminates the entire flow domain by convection. Figure 12 shows the evolution of NIH values for the whole flow system over time. Here the maximum NIH value for the plots was set to 0.001. Clearly, the region of high concentration grows along the rotation direction, as shown from (c) to (e) of Fig. 12.
Figure 12.
Evolution of NIH value in the circular Couette flow with blade configuration as time progresses.
5.2. Flow in a curved pipe
We also examined a flow in a curved pipe grafted to a straight channel. The flow can be considered as an idealized bypass graft which is used as an alternative conduit around critically stenosed arteries. This particular flow problem was previously subject to the shape optimization of the bypass passage as discussed by Abraham et al. [25], who optimized the shape of the bypass graft based on a dissipation function computed from the scalar shear rate Gf. For simplicity, our idealized graft flow assumes that the shape is an arc of circle.
For computing the velocity field, the GLS method is used for both steady-state and transient computations (see Abraham et al. [25] for details). We review a dimensionless number and some boundary conditions here.
We define the Reynolds number as
| (30) |
where ρ = 1, 056 kg/m3, μ = 3.5 cP, H = 0.8 cm, and Umax is the maximum x-velocity at the inlet boundary. We considered NRe = 300 (corresponding to a physiological condition) for both steady-state and transient flows.
At steady-state, the flow at the inlet boundary is prescribed to have a parabolic velocity profile u(y) = i U(y). For transient flow, the inlet velocity profile is modulated by m(t):
| (31) |
where m(t) is defined as
| (32) |
with ω = 2π corresponding to 60 beats per minute (BPM). The outlet flow is assumed to be fully developed: no · ∇u = 0, where no is the normal vector pointing outward from the outlet boundary.
Figure 13 shows the geometry of the idealized graft flow. Among the geometric parameters, the length of downstream blood vessel l4 has to be chosen carefully for two reasons: (a) for the velocity field computation, it must be long enough to ensure a fully developed flow at the outlet especially for the steady-state computation; (b) for the hemolysis estimation, the vortex needs to be generated far away from the outlet boundary, otherwise the outlet NIH flux will be overestimated for the steady-state computation and will show noise-like temporal fluctuations for the transient computation. We found that l4 = 2 × l1 = 6 satisfies both requirements.
Figure 13.
Geometry parameter for artery graft flow.
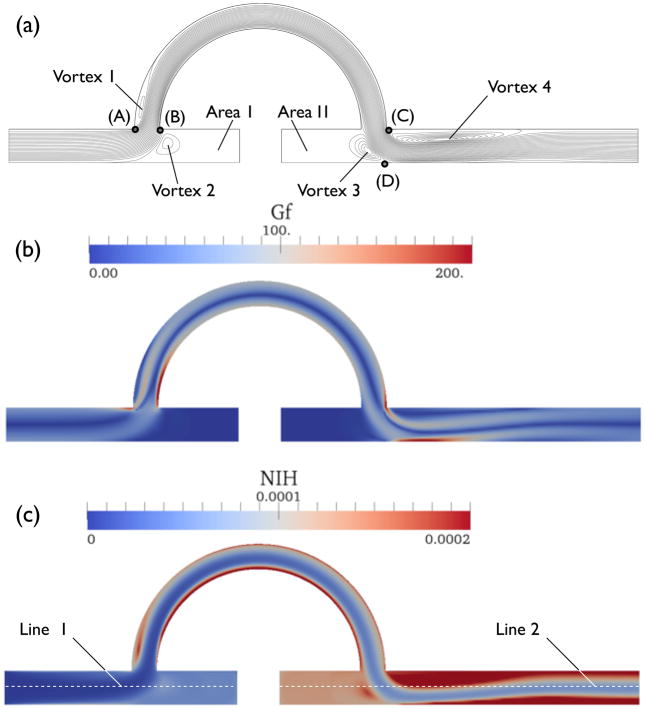
Figure 14(a) shows the streamline plots for the steady-state computation. Large recirculations are found near the blocked passage, Area I and Area II. Some recirculations are located downstream of the high shear zones, Vortex 1 and Vortex 4. Note that corners (A) and (C) provide high shear rates as shown in Fig. 14(b).
Figure 14.
Streamline, NIH and Gf contour plots.
For both steady-state and transient computations, we set the inlet fHb = 0. To prevent negative concentrations, we use the S2 formulation with κ2 = 109.
5.2.1. Steady-state results
For the steady-state hemolysis estimation, we tested both the original S2 formulation and the regularized formulation with εr = 0.05, 0.01, and 0.001. The adaptive relaxed Newton’s method was used with mA = 1 and mB = 5 for both formulations. Without the help of relaxation, the
 norm of residual vector cannot decrease below 10−8.
Figures 14(b) and (c) show Gf and NIH value contour plots from the original S2 formulation. The maximum NIH value was 2.7 × 10⁻³ located at the bottom of the blood vessel near the downstream impact point (D), where Gf has the highest value. The maximum value in the NIH plot was set to 2 × 10⁻⁴ for emphasizing high NIH regions. A trail of high NIH appears downstream of the impact point, as shown in Fig. 14(c). The streamline starting from the upstream high shear point (B) passes through the impact point (D) as well. This result suggest that it is important to adjust the entry and exit angles of the graft for decreasing the shear rate at both (B) and (D).
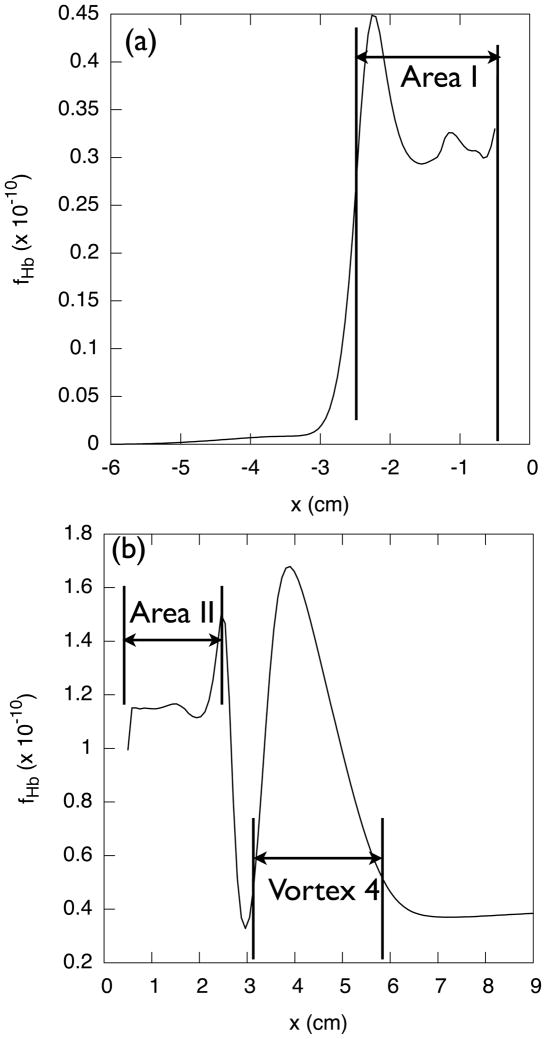
As discussed in Sec. 2.2, the steady-state solution cannot capture fHb = 1 inside flow recirculation regions. Plots (a) and (b) in Fig. 15 present fHb along the mid plane of the blood vessel (line 1 and line 2 in Fig. 14(b)).
Figure 15.
fHb values along line 1, plot (a), and along line 2, plot (b).
As predicted in Sec. 4.1, The fHb values in the flow recirculations deviate significantly from unity. This is a major drawback of LSFEM method for the steady-state hemolysis estimation. Nevertheless, the concentration profile outside the vortices does not suffer from numerical diffusion significantly, as already shown in the examples of Sec. 4.
One can neglect fHb inside the recirculation regions (where fHb = 1) and compute the outlet NIH flux for estimating the blood damage. Here the average outlet NIH flux is defined as
| (33) |
For the graft, NIHavg = 1.43 × 10⁻⁵ g/100L blood.
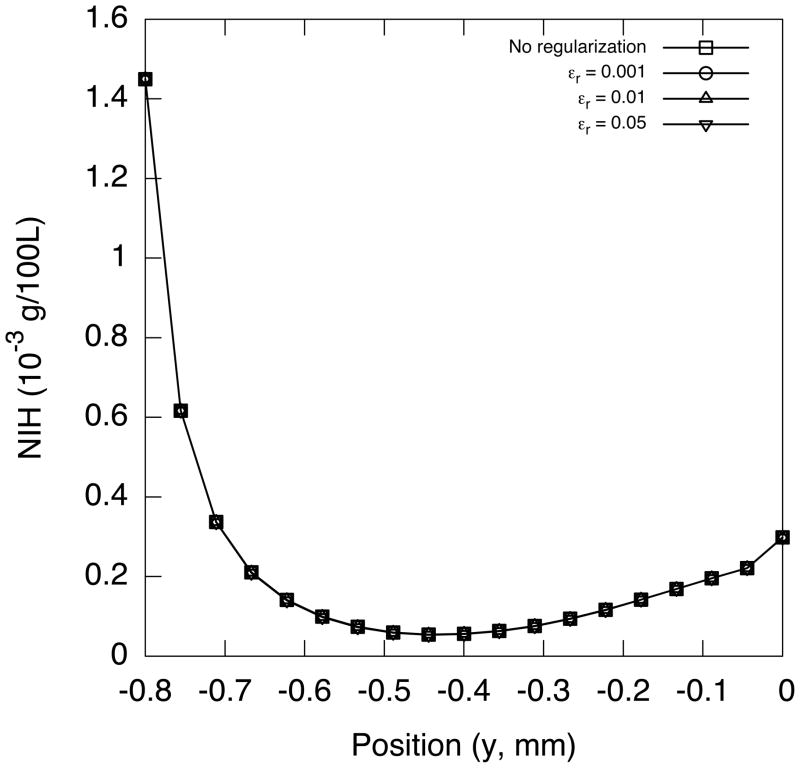
Figure 16 shows the comparison between the NIH profiles along the outlet boundary computed from the original S2 formulation and the regularized one. The plots confirmed that the regularization has virtually no effect on the hemolysis estimation.
Figure 16.
NIH value profile at the outlet for different εr.
5.2.2. Transient results
For transient computations, the time domain [0, 20 s] was discretized into 800 elements (Δt = 0.025 s). For the original S2 formulation, we set the initial concentration to CI = 0.001 (which corresponds to fHb = 10−15) to avoid the singularity at C = 0. For the regularized formulation, we use CI = 0, and, in order to test the effect of εr on the transient hemolysis estimation, we tried εr = 0.01 and εr = 0.001. In general, the solution for the formulation with εr = 0.01 converges faster than with εr = 0.001 by taking 2 or 3 fewer Newton steps per time step.
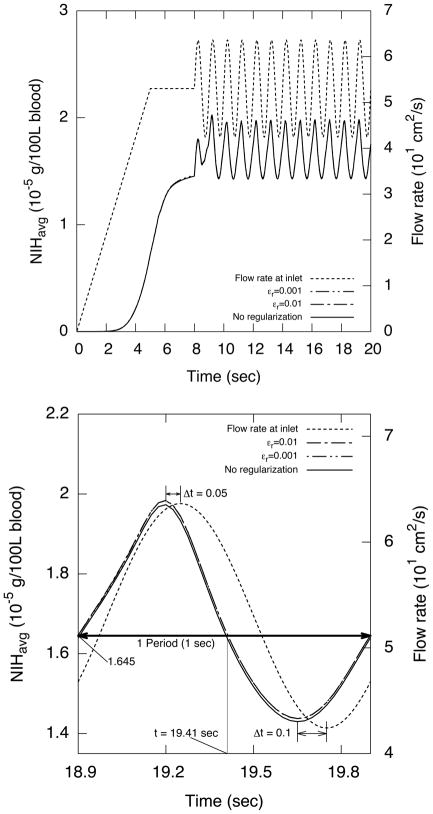
Figure 17(a) shows the inlet flow rate and the average outlet NIH flux over time. The NIH flux approaches the steady-state value at about t = 6 s. The NIH flux shows periodic behavior about one second after the onset of the flow pulsation. Moreover, the lowest NIH value is about the same as the steady-state value indicating that the pulsatile flow leads to higher blood damage.
Figure 17.
NIH flux across the outlet boundary and pulsatile flow rate at the inlet in the transient artery graft flow for NRe = 300. Plot (b) shows one period of NIH flux across the outlet between t = 18.9 sec and t = 19.9 sec. Note that both NIH flux values were computed using S2 formulation with different regularization parameter values εr.
A single cycle of the NIH flux curve in the periodic state is shown in Fig. 17(b). Note that the results are indistinguishable for different formulations and εr values.
Unexpectedly, the peak of the NIH curve appears before that of the flow rate curve. Furthermore, the shape of the NIH curve is distorted; the time difference between the highest peaks Δt = 0.05 s is shorter than the difference between the lowest peaks Δt = 0.1 s. Moreover, the mean NIHavg = 1.645 × 10⁻⁵ g/100L blood over time is higher than the steady-state value, even though the maximum Gf = 326 s−1 during the transient computation is almost the same as that of steady flow. This is due to traveling vortices in the downstream blood vessel containing high NIH value.
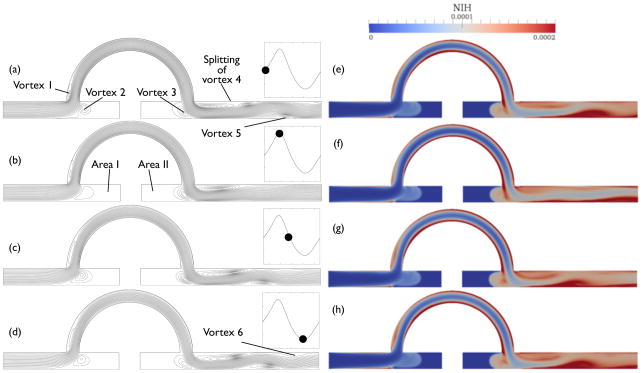
For a single cycle, the NIH contour plot is similar to the streamline plot, as shown in Fig. 18; the regions of high NIH coincide with the regions of flow recirculation. The streamline plot for the highest NIH value, Fig. 18(b), has fewer regions of flow recirculation inside the downstream blood vessel than in Fig. 18(d) for the lowest NIH value. This result strongly suggests that the high outlet NIH flux comes from ejection of the traveling vortices. For example, the damaged blood from the lower surface of the bypass graft flows into Vortex 3 and gets trapped, as shown in Fig. 18(g) and (h). The highly damaged blood can arrive at Vortex 5 through the downstream impact point (D) of Fig. 14. Therefore, Vortex 5 contains the highest NIH value during the cycle, and the maximum NIH flux at the outlet depends on ejection of that vortex.
Figure 18.
Evolution of the scalar shear rate, from (a) to (d), and the NIH values, from (e) to (h), in one cycle.
Furthermore, NIH values inside Area I and II are lower than that of the steady-state result, because of the extremely low shear rate inside these areas. Moreover, the given computation time 20 s is not enough to hemolyze RBC completely. Except for Vortex 2 and 3, which have NIH influxes due to the pulsatile flow, the rest of Area I and II contains virtually no PF hemoglobin during the entire computation.
6. Conclusion
We present a method of solving a convection-reaction system using the space-time least-squares finite element method (ST/LSFEM). To prevent the negative concentration problem, we transform the concentration variable into a squared quantity. Even though the proposed method does not yield a completely diffusion-free solution, it can be easily applied to complex flows while providing enough accuracy for predicting hemolysis in medical devices.
However, there is a room for improvement in the proposed method. For example, eliminating oscillation in the concentration profile can be an important extension of the method. A good candidate is the discontinuity-capturing method developed for the GLS method [27]. Handling discontinuity across the separating streamline can be another area of improvement, especially for the steady-state computation. One may find a way to align mesh boundaries and use discontinuous basis functions to capture the discontinuity. Another potential candidate is an extended finite element approach based on locally enriching basis function space near the discontinuity, as discussed in Chessa and Belytschko [28].
The proposed method is used for blood damage estimation in two examples: the circular Couette system with a blade and the arterial graft flow. Shear rate and NIH plots provide rich information about the locations of “dangerous” regions, and blood damage distributions inside a given flow. This information can be useful in improving medical devices. Results from the examples we showed warn of the danger of flow recirculations in such devices. Even though some recirculations provide relative low shear rates, they can completely hemolyze RBC given sufficient time, as predicted by analysis of the steady-state hemolysis. In other words, they can trap and hold damaged blood as shown in transient computation. Under pulsatile flow conditions, these recirculations can also travel inside the flow, and can even be split and discharged into the regions of non-recirculating flow. This behavior increases the average NIH flux at the outlet of medical devices.
Acknowledgments
We thank Dr. J. Alex Lee for helpful discussions and suggestions to our work. This work was supported by Grant Number R01HL085054 awarded to Texas Heart Institute (THI) by the National Heart, Lung, and Blood Institute (NHLBI) and by the National Science Foundation of the USA under grant DMS-0811160. The content is solely the responsibility of the authors and does not necessarily represent the official views of NHLBI or the National Institutes of Health. Computational resources were provided partly by the Rice University Shared Compute Clusters funded by NSF grants EIA-0216467, CNS-0421109, CNS-0821727, by IBM (SUR award), Sun, Sigma Solutions, AMD, Cray, CISCO, Qlogic, and Adaptive Computing.
Footnotes
Publisher's Disclaimer: This is a PDF file of an unedited manuscript that has been accepted for publication. As a service to our customers we are providing this early version of the manuscript. The manuscript will undergo copyediting, typesetting, and review of the resulting proof before it is published in its final citable form. Please note that during the production process errors may be discovered which could affect the content, and all legal disclaimers that apply to the journal pertain.
Contributor Information
Jaewook Nam, Email: jaewook.nam@rice.edu, Department of Chemical & Biomolecular Engineering and Ken Kennedy Institute for Information Technology Rice University, Houston, Texas 77005, USA.
Marek Behr, Email: behr@cats.rwth-aachen.de, Chair for Computational Analysis of Technical Systems (CATS), Center for Computational Engineering Science (CCES), RWTH Aachen University, 52056 Aachen, Germany.
Matteo Pasquali, Email: mp@rice.edu, Department of Chemical & Biomolecular Engineering and Chemistry, and Ken Kennedy Institute for Information Technology, Rice University, Houston, Texas 77005, USA.
References
- 1.Arora D, Behr M, Pasquali M. A tensor-based measure for estimating blood damage. Artificial Organs. 2004;28:1002–1015. doi: 10.1111/j.1525-1594.2004.00072.x. [DOI] [PubMed] [Google Scholar]
- 2.Ewing RE, Liu J, Wang H. Adaptive biorthogonal spline schemes for advection-reaction equations. Journal of Computational Physics. 2003;193:21–39. [Google Scholar]
- 3.Ha Y, Kim YJ. Explicit solutions to a convection-reaction equation and defects of numerical schemes. Journal of Computational Physics. 2006;220:511–531. [Google Scholar]
- 4.Johnson C. Numerical solutions of partial differential equations by the finite element method, Finite Element Methods for Flow Problems. Studentlitteratur Sweden 1987 [Google Scholar]
- 5.Lacasse D, Garon A, Pelletier D. Development of an adaptive Discontinuous-Galerkin finite element method for advection-reaction equations. Computer Methods in Applied Mechanics and Engineering. 2007;196:2071–2083. [Google Scholar]
- 6.Boris JP, Book DL. Flux-Corrected Transport. I. SHASTA, A Fluid Transport Algorithm That Works. Journal of Computational Physics. 1973;11:38–69. [Google Scholar]
- 7.Harten A. High Resolution Schemes for Hyperbolic Conservation Laws. Journal of Computational Physics. 1997;135:260–278. [Google Scholar]
- 8.Löhner R, Morgan K, Peraire J, Vahdati M. Finite Element Flux-Corrected Transport (FEM-FCT) For The Euler And Navier–Stokes Equations. International Journal for Numerical Methods in Fluids. 1987;7:1093–1109. [Google Scholar]
- 9.Kuzmin D, Turek S. Flux Correction Tools for Finite Elements. Journal of Computational Physics. 2002;175:525–558. [Google Scholar]
- 10.Kuzmin D, Turek S. High-resolution FEM-TVD schemes based on a fully multidimensional flux limiter. Journal of Computational Physics. 2004;198:131–158. [Google Scholar]
- 11.Kuzmin D. On the design of general-purpose flux limiters for finite element schemes. I. Scalar convection. Journal of Computational Physics. 2006;219:513–531. [Google Scholar]
- 12.Garon A, Farinas M-I. Fast Three-dimensional Numerical Hemolysis Approximation. Artificial Organs. 2004;28:1016–1025. doi: 10.1111/j.1525-1594.2004.00026.x. [DOI] [PubMed] [Google Scholar]
- 13.Riveros-Moreno V, Wittenberg JB. The self-diffusion coefficients of Myoglobin and Hemoglobin in Concentrated Solutions. Journal of Biological Chemistry. 1972;10:895–901. [PubMed] [Google Scholar]
- 14.Farinas M-I, Garon A, Lacasse D, N’dri D. Asymptotically Consistent Numerical Approximation of Hemolysis. Journal of Biomechanical Engineering. 2006;128:688–696. doi: 10.1115/1.2241663. [DOI] [PubMed] [Google Scholar]
- 15.Giersiepen M, Wurzinger LJ, Opitz R, Reul H. Estimation of Shear Stress-Related Blood Damage in Heart Valve Prostheses—in vitro Comparison of 25 Aortic Valves. International Journal of Artificial Organs. 1990;5:300–306. [PubMed] [Google Scholar]
- 16.Jansen KE, Collis SS, Whiting C, Shakib F. A better consistency for low-order stabilized finite element methods. Computer Methods in Applied Mechanics and Engineering. 1999;174:153–170. [Google Scholar]
- 17.Arora D, Behr M, Pasquali M. Hemolysis estimation in a centrifugal blood pump using a tensor-based measure. Artificial Organs. 2006;30:539–547. doi: 10.1111/j.1525-1594.2006.00256.x. [DOI] [PubMed] [Google Scholar]
- 18.Shakib F, Hughes TJR. A new finite element formulation for computational fluid dynamics: IX. Fourier analysis of space-time Galerkin/Least-Squares Algorithms. Computer Methods in Applied Mechanics and Engineering. 1991;87:35–58. [Google Scholar]
- 19.Jiang BN, Carey GF. A stable least-squares finite element method for non-linear hyperbolic problems. International Journal for Numerical Methods in Fluids. 1988;8:933–942. [Google Scholar]
- 20.Pontaza JP, Reddy JN. Space-time coupled spectral/hp least-squares finite element formulations for the incompressible Navier–Stokes equations. Journal of Computational Physics. 2004;197:418–459. [Google Scholar]
- 21.Donea J, Huerta A. Finite Element Methods for Flow Problems. John Wiley & Sons; New York: 2003. [Google Scholar]
- 22.Paul R, Apel J, Klaus S, Schügner F, Schwindke R, Reul H. Shear stress related blood damage in laminar Couette flow. Artificial Organs. 2003;27:517–529. doi: 10.1046/j.1525-1594.2003.07103.x. [DOI] [PubMed] [Google Scholar]
- 23.Behbahani M, Behr M, Hormes M, Steinseifer U, Arora D, Coronado O, Pasquali M. A Review of Computational Fluid Dynamics Analysis of Blood Pumps. European Journal of Applied Mathematics. 2009;20:363–397. [Google Scholar]
- 24.Moffatt HK. Viscous and resistive eddies near a sharp corner. Journal of Fluid Mechanics. 1963;18:1–18. [Google Scholar]
- 25.Abraham F, Behr M, Heinkenschloss M. Shape Optimization in Unsteady Blood Flow: A Numerical Study of Non-Newtonian Effects. Computer Methods in Biomechanics and Biomedical Engineering. 2005;8:201–212. doi: 10.1080/10255840500309562. [DOI] [PubMed] [Google Scholar]
- 26.ASTM F1841-97. Standard practice for assessment of hemolysis in continuous flow blood pumps. ASTM International West Conshohocken; PA: 2005. [Google Scholar]
- 27.Tezduyar TE, Park YJ. Discontinuity Capturing Finite Element Formulations for Nonlinear Convection-Diffusion-Reaction Problems. Computer Methods in Applied Mechanics and Engineering. 1986;59:307–325. [Google Scholar]
- 28.Chessa J, Belytschko T. A local space-time discontinuous finite element method. Computer Methods in Applied Mechanics and Engineering. 2006;195:1325–1343. [Google Scholar]


