

Summary
Genomics centers discover increasingly many protein sequences and structures, but not necessarily their full biological functions. Thus, currently, fewer than one percent of proteins have experimentally verified biochemical activities. To fill this gap, function prediction algorithms apply metrics of similarity between proteins on the premise that those sufficiently alike in sequence, or structure, will perform identical functions. Although high sensitivity is elusive, network analyses that integrate these metrics together hold the promise of rapid gains in function prediction specificity.
Keywords: Protein function prediction, Structural Genomics, evolution, network diffusion, structure-function, templates, graphs
Introduction
There is a large gap between the number of known proteins and those that are characterized functionally. Out of a few thousands ongoing high-throughput genome projects, the nine hundred or so that are complete [1] collectively yield over 13 million protein sequences. A sliver of these, or 1%, has experimental annotations [2]. Most others carry inferred annotations (64%), and fully a third remain cryptic, being labeled “putative”, “uncharacterized”, “hypothetical” or “unknown function” (35%) in the UniProt database [3]. The same is true for protein structures solved by Structural Genomics (SG), a world-wide effort that aims to inform function through structural knowledge. In keeping with a selection bias against homologs of known structures, 40 % of the nearly 10,000 SG structures solved thus far have unknown function in the Protein Data Bank, and even after putative automated annotations nearly 3000 structures remain listed as unannotated in the Structural Genomics Knowledgebase [4].
These numbers likely underestimate the magnitude of the problem since existing annotations are not necessarily accurate. Most rely on homology, assuming that evolutionarily proximity implies shared function. But even with sequence identity of 70%, or greater, careful studies showed that 10% of any pair of enzymes had different substrates; and differences in the actual enzymatic reactions are not uncommon near 50% sequence identity [5,6]. Thus databases may carry misannotations that could then propagate, and be amplified, via otherwise accurate annotation methods [7]. Indeed, an analysis of 37 well-characterized enzyme families suggests that electronically curated databases carry misannotations whereas, reassuringly, the manually curated SwissProt database is nearly free of them and is thus closer to a gold standard [8].
The reason for this discrepancy between human computer-generated functional knowledge is that many aspects of protein evolution naturally confound both the sensitivity and specificity of automated efforts to pinpoint function. First, individual proteins are multifunctional. This is clear when a protein carries multiple binding or catalytic sites, or promiscuous ones (meaning they are non-specific). But folding, cellular targeting, post-translational modifications, allosteric regulation and degradation are functions in their own right; and their interplay with context is seen in metalloproteins that bind distinct metal ions depending on cellular location [9]. Second, evolutionary relatedness, or the lack of it, can be deceiving. After gene duplication, paralogs may develop entirely unrelated functions, such as eye lens crystallins that originate from enzymes [10]. Conversely, there are over a hundred examples of enzymatic convergence in which unrelated proteins converged to perform similar reactions [11]. Functional convergence is difficult to discern even at the molecular level: a study of nine types of ligand (AMP, ATP, FAD, FMN, glucose, heme, NAD, phosphate and steroid molecules) illustrates that each one can binds into a variety of binding pockets with a wide range of electrostatic or hydrophobic properties [12]. And third, the functional response to even single residue perturbations may range from dramatic fold changes [13], to switches in functional specificity [14] or catalytic function [15], and on to no changes in function despite variations in the side chain character or positions of catalytic residues [16].
This complexity suggests that protein should be viewed as evolving in a functional landscape with a non-trivial topology. Specifically, the relationship between changes in proteins and changes in their functions has many forms (Figure 1): it can be smooth and predictable (Figure 1, red line), but it can also be abrupt (green line) or absent (blue line). Thus in response to changes in context or in sequence the function can sometimes jump to distant parts of the functional landscape rather than stay close by. In that light, the problem of function annotation is twofold: to describe the functional landscape that is available to proteins, and to correctly determine which parts of this landscape a protein occupies given the pitfalls illustrated in Figure 1. We briefly address the first point next, and then focus the balance of the review on the second point.
Figure 1. Alternative relationships between protein similarity and protein function.
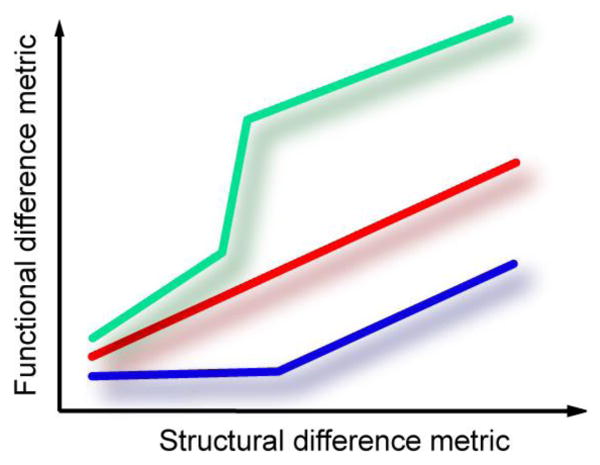
The x-axis represents the distance between two proteins, here in term of structure—but a metric based on sequence or on some other observable feature would have similar features. The y-axis is the distance between the same proteins in terms of their biological functions. Typically, annotations methods assume that the more similar the proteins the more alike their function. This is shown as a simple (linear) correlation in the red line. But these changes need not to be smooth: the green line illustrates small protein variations that lead to substantial change in molecular function, such as between paralogs. The blue line illustrates an opposite example when distant proteins perform closely related biochemical functions.
Computer Readable Descriptions of Protein Function
Nomenclatures that tally, classify and compare individual protein functions have begun to describe part of this functional landscape. The Enzyme Commission (EC) functional classification is a hierarchy of four numbers that describe catalytic reactions in successively finer detail. Enzymes that have more EC numbers in common, starting from level 1, that describes broad enzymatic classes, to level 4, that describes specific substrates, should ideally be increasingly related mechanistically. But detailed comparisons show enzymes with identical first-three digit EC numbers may have significant differences in catalytic process [17]. EC numbers must therefore be interpreted with care.
The Gene Ontology is a more general alternative (GO) [18]. It has distinct terms for Molecular Function, such as growth factor receptor binding; Biological Process, such as cell proliferation, and Cellular Component, such as nuclear membrane. Moreover, eighteen different evidence codes specify the basis for each annotation, and hence their reliability. For example, EXP, IEP, ISS, IC, IEA mean, respectively, inferred from experiment, expression pattern, sequence or structural similarity, or by the curator, or via electronic annotation. This GO framework creates child-parent hierarchical relationships described by directed acyclic graph.
Many other classification schemes exist. For example, the Transporter Classification describes transport proteins [19], and others apply to cellular pathways and processes such as KEGG [20] and EcoCyc [21]. The latter classifies Escherichia coli genes based on their association with metabolic pathways, while MetaCyc is its most generalized version for bacteria [22].
Sequence-Based Functional Annotation
Given such classifications to codify the functional landscape, annotation methods then rely on a correlation between functional and structural similarity metrics of the type shown in Figure 1, red line. Many choices of protein similarity metrics are possible, however, to assess likeness.
The simplest protein similarity metrics exploit homology of whole sequences. BLAST/PSI-BLAST [23] are routinely used, and the top hit with a known function provides the annotation. A better strategy is to gather GO terms among all hits, and transfer those that recur with statistically significant frequency. Using a “Function Association Matrix” to apply this strategy, PFP reached ∼100% coverage and 60% accuracy in a benchmark set of non-redundant 2000 sequences [24], with some improvements with an iterative use of PSI-BLAST [25]. Specificity can be raised by distinguishing between orthologs and paralogs. A recent comparative phylogenetic analysis of yeast Saccharomyces cerevisiae genes showed significant differences in functional inheritance between them [26]. SIFTER, exploits these differences to transfer GO terms based on bayesian statistics of duplication and speciation events [27]. This phylogenomic approach is slower, but more accurate. Yet, as already mentioned, small sequence changes can profoundly impact function: melamine deaminase and atrizine chlorohydrolase share 98% sequence identity but differ in function [28].
Therefore a second type of similarity metric focuses on local sequence motifs rather than on whole sequence comparisons. These motifs consist of residues that directly mediate function, and which therefore should be the most specific for annotation. As a basis for these searches, InterPro [29] assembles functional signatures of proteins gleaned from eleven databases. As motifs become smaller, the chance of random similarities and false positives rises. To recover specificity, EficaZ identifies functionally discriminating residues. These are derived from Hidden Markov Models of alignments of enzymes, PROSITE patterns and family specific sequence identity threshold [30]. Fourth-level EC annotations reach 92% specificity and 82% sensitivity in non-trivial controls with mutual sequence identity that is below 40%. Similarly, ConFunc has 24% greater prediction specificity than BLAST, also in sequences with low sequence identity [31]. It uses position specific scoring matrices derived from discriminating residue profiles in GO term-specific sub-alignments of PSI-BLAST hits.
Structure-Based Function Annotation
A third type of protein similarity metric exploits three-dimensional (3D) protein structures. One may either directly align structures to each other [32], or more generally find how they fit into broad classifications of structures, such as SCOP and CATH [33,34], or specialized ones, such as The Structure Function Linkage Database [35]. The fact that 70% of CATH fold types are associated with just one function [36], or that GO terms are more identical in the SCOP superfamilies than different superfamilies with the same fold [37] justify these methods. Structural alignments are now faster with little accuracy loss [38], and those methods that do not explicitly construct the alignments can be especially fast [39,40].
A further similarity metric focuses on local structural features. The local geometry of clefts and pockets, or their surface electrostatics, inform on comparisons of active sites and ligand-binding sites at the molecular level. For example, pevoSOAR [41] annotates enzymes based on matching cavities and pockets with known functional sites collected in the CASTp database [42]. SURFNET [43], and Consurf-HSSP database [44] also focus on cleft comparison, while EF-site [45] and MultiBind/MAPPIS check electrostatic properties and physico-chemical properties of binding sites respectively [46]. Model structures can be used as well: FINDSITE threads query sequences to find their putative binding sites and to suggest potential ligands [47]. Its accuracy was 67% in controls with less than 35% sequence similarity to any target protein.
Template-Based Methods
A closely related fifth type of similarity metric is based on 3D templates, which narrow local structural searches even further. These templates are composed of a few residues that are directly associated with function and positioned with respect to each other in a defined spatial geometry. The Ser-His-Asp catalytic triad of serine proteases is a case in point [48]. Its residues are not necessarily sequential and may therefore be very difficult to detect from sequence analysis. Yet their 3D-templates could be geometrically matched to other protein structures so as to identify other proteases better than sequence homology methods could [49]. The Catalytic Site Atlas is a resource that provides 3D templates for over 53,000 protein chains, each one based on experimentally verified small functional motifs [50]. However, these sites often have three residues or fewer, and hence do not include surrounding residues that may also modulate catalysis. Moreover, many proteins are not enzymes.
To follow this strategy, it is therefore important to also derive the templates themselves. The Reverse Templates (RT) method [51] breaks down a query protein structure into the tri-peptide segments and searches them against the non-redundant protein structures. GASPS generates templates based on their ability to distinguish related structures from others [52]. A recent state-of-the-art template-based method, FLORA constructs templates from the residues specific to functional sub-groups in the functionally diverse CATH superfamilies and it outperforms other similar methods in three-digit EC annotation in an unbiased set of control enzymes [53].
Evolutionary Trace Annotation
In a complementary approach, 3D templates may also be defined and then compared objectively by relying on evolution. This requires no prior assumptions on functional mechanisms and amino acids. Rather, in a series of steps, key functional residues are extracted from phylogenomic comparisons of aligned sequences, and they are mapped onto the protein structure. Next, templates are then picked from the functional residues that cluster at the surface. Their geometric matches to other structures then define template “hits”. Finally, various computational filters select among those hits the ones that are least likely to arise by chance. In practice the Evolutionary Trace Annotation (ETA) server [54], depicted in Figure 2A, uses the ranked lists of evolutionarily important residues produced by Evolutionary Trace (ET) [55,56]. Top-ranked ET residues are good candidates for 3D templates because they are known to generally overlap functional sites and identify their determinants [57], such that their targeted mutations efficiently engineer proteins with selective separation of function or rewired functional specificity [58]. Evolution is also central to each of the three specificity filters. The first one is a Support Vector Machine trained to reject template hits that do not fall on residues that are themselves ranked as being evolutionarily important by ET [59]. The second imposes plurality, so that a function is passed to a protein only if that function recurs more often than any other in all of its hits [60]. And the third filter requires hit reciprocity, so that if the template of protein A has a hit on protein B, the reverse is also true: the template of protein B will hit protein A [61]. With all of these filters applied together, the positive predictive value up to the third digit of EC numbers rose to 92% in a large-scale control over more than 1200 SG proteins. Sensitivity, on the order of 40%, can be raised to 53% by using more accurate ET-based templates [62]. Similar results are obtained for GO annotations: 53% sensitivity and 94% PPV at the third GO depth over 2300 protein among, while 76% of the predictions were still correct at the deepest available GO level [63].
Figure 2. Evolutionary Trace Annotation (ETA) of protein function.

A. ETA is composed of three steps. 1) The Evolutionary Trace [55] aligns homologous sequences and ranks positions according to the correlation between evolutionary divergence and amino acid variations. 2) The protein structure is labeled with these evolutionary importance rankings. 3) A heuristic selects clustered, surface exposed and evolutionarily important amino acids to form a structural template (red spheres). 4) A library of proteins with known function is searched for matches (called hits) to this template. An SVM filters discards the hits if they do not fall on top ranked ET residues (not depicted). 5-8) A reciprocal match is searched for and here shown to be found by repeating steps 1-4 in the opposite direction. B. ETA matches define a graph. Each protein chains is a node, and structural and evolutionary similarities are the edges. Some nodes are known to carry a given function (blue), other nodes are known to not carry that function (white), and the functional status of remaining nodes is unknown (?). The labels are then transferred among all nodes in the network based on the number of edges and their strength, in a process analogous to diffusion. The result is a score for every enzymatic function at every node. Finally, these scores are normalized and compared (not depicted). The predicted functional label is the one with the highest normalized weight (called z-score) that is also significant. C. Performance comparison of ETA network diffusion versus BLAST on a test set of structural genomics proteins. Diffusion of enzymatic function annotations showed a consistent accuracy advantage of approximately 9% over BLAST across many coverage levels [80]. D. UV absorbance (y-axis) confirms the predicted carboxylesterase activity of a previously unannotated protein from the medically relevant organism Staphylococcus aureus (3h04 in the Protein Data Bank). ETA network diffusion predicted this enzymatic function which was tested and confirmed in vitro. Specific activity was similar to that of a known carboxylesterase; the negative control, Bovine serum albumin (BSA), had no activity.
Metaservers
Since these different metrics focus on different protein features, an expectation is that they would yield better predictions when combined. For example, ProFunc is a meta-server that combines fourteen different types computational annotations (5 sequence-based, 5 structure-based, 4 template-based), and which reaches 60% coverage with 70% accuracy, in a controls over 92 protein structures of known function [49,64]. ProKnow [65] is another meta-server that is knowledge-based and which combines similarity metrics from fold and sequence comparisons, from motifs and from interaction relationships among proteins. In 1500 distinctly folded protein controls, its coverage and accuracy were 93% and 89%, respectively, at the first level of the GO classification, decreasing to 44% accuracy at the ninth, deepest available level.
Networks
An alternate to meta-servers is to pool annotations into network structures. Genes or gene products define the nodes of such networks, and the associations between them that suggest functional similarities are indicated by edges. A key advantage is that any number of similarity metrics can be represented at once simply by adding new edges between the protein nodes, or strengthening existing edges, regardless of whether they arise from sequence, structure, or evolutionary data over the whole or part of the protein. Moreover, these edges can also describe functional associations from yeast-two-hybrid; co-expression; conserved genomic neighborhood; phylogenetic co-occurrence and literature co-occurrence; for example, the STRING database [66] now covers nearly 30% of all protein sequences in UniProt with such data. To benchmark prediction quality or to make novel predictions on protein function, biological process or gene phenotype, one can then apply the concepts of connectivity, centrality, modularity, clustering or graph cuts and maximum flows on graphs [67]. Network methods can be broadly ordered into local and global approaches depending on whether their calculated predictions require some or all nodes and edges in the graph, respectively.
Local network methods consider nearest neighbors and the functions of a node are predicted from its annotated direct neighbors. This heuristic approach remains the standard to measure prediction accuracy and coverage since it predictive power is not easily surpassed and it scales at most linearly with the total number of nodes in the network [68]. For example, given reliable underlying network information, local methods have been shown to predict a spectrum of effects ranging from gene essentiality to tissue-specific loss-of-function phenotypes in the nematode Caenorhabditis elegans [69]. However, local network generally require additional considerations to yield statistical confidence values [70], and non-local alternatives are more accurate.
Some non-local methods can gather information from larger neighborhoods. They apply the concept of network modules, or motifs, which are groups of genes or proteins with the same molecular function or taking part in the same biological process. The detection of modules involves clustering and statistical testing of significance against random networks [67]. In yeast, where detailed and reliable genome-wide interaction data are available, module detection identified both novel molecular complexes and specific biological roles [71], such as highly significant gene promoter motifs that regulate transcription [72]. However, not all functionally coherent groups of proteins can be represented through modules. For example, transmembrane receptors bind to many extra- and intra-cellular molecular partners but they much less frequently form complexes with other membrane proteins [73]. Hence, it is unlikely that protein interaction networks can be completely decomposed into functional modules.
Fully global methods seek to optimize annotations by finding the minimum of a quadratic polynomial, H, over all nodes and edges. Here, H is a positive cost function the minimum of which reflects the topology of the graph and yields a distribution of numerical labels (discrete or continuous, positive and negative) indicating functional memberships. In the input, only the nodes with known functions carry labels. In the output, after optimization, most nodes carry some labels including those initially unknown. Minimization of H is an optimization problem equivalent to maximum a posteriori (MAP) estimates in Bayesian networks [74], to stationary states in Markovian random fields [75], or to minimum cost solutions in graph-based semi-supervised learning [76]. This last method, also referred to as network diffusion, is notable for its improved accuracy and coverage over local methods [77]. Also, when the network edges are positive, it produces a solution that grows linearly with network size [78], enabling global analysis of very large networks—potentially millions of protein nodes. Finally, it allows the integration of heterogeneous data by optimizing the relative weights of individual networks; for example, those built from local evolutionary, global geometrical, topological and sequence relationships lead, after weighted integration, to an increase in sensitivity of 17% over the best single network [79].
Most recently, in the context of Structural Genomics, this machine learning technique improved the specificity and coverage of function annotations. A network of protein structures was generated from reciprocal 3D template hits derived from the ETA method [80] (Fig. 2A). At the start, labels indicated the enzymatic activity of known proteins in the Protein Data Bank. Graph-based semi-supervised learning was then applied to transfer known functional labels of enzymatic activity to proteins whose function was unknown and to assign a statistical confidence score to all predictions (Fig. 2B). By comparison to the ETA method [54], this global analysis raised accuracy by 6% at 65% coverage (from 90% to 96% accuracy) at the substrate-specific fourth EC level. It also increased accuracy and coverage over standard BLAST annotation by 10% (from 85% to 95% accuracy also at 65% coverage, see Fig. 2C). In other controls, it improved over other structure-based methods, such as FLORA, reducing false positives to raise accuracy rose from 60% to 90% (measured at 97% sensitivity). Finally, as a direct additional control, a new annotation of a carboxylesterase (EC 3.1.1.1), in a vancomycin resistant strain of Staphylococcus aureus, was tested experimentally and confirmed (Fig. 2D).
Concluding Remarks
The pace of discovery of protein sequences and structures is accelerating, and with it the need to interpret their biological meaning efficiently. While diverse experimental techniques inform on biological processes [81] and phenotype [69], direct and high-throughput experimental screen to simultaneously measure a wide array of different biochemical activities remain unusual [82]. Any assay is best when tuned to specific substrate and reaction, optimal conditions will be different for different proteins, and protein promiscuity and functional multiplicity can lead to false positives and false negatives. For these reasons, continued progress in automated annotation is imperative. This means increasing the specificity and sensitivity of function predictions.
Network-based inferences of function are likely to be well-suited for both tasks. Specificity should rise because any type of functionally relevant associations between proteins can be integrated together in a unified computational framework [66]. Global network analyses also efficiently apply all of the network's information to each node [67], and statistical significance can point to the most reliable annotations [67,77,80]. Indeed, specificity does rises as a result of these integrative [79] and global features of networks [80].
One key hurdle for further increases in specificity are the errors that may be contained in the primary data used to encode the networks. Both individual link and the functional labels they propagate may be inaccurate. It is therefore critical to systematically control reference gold standards [8], and to objectively and systematically control predictions through systematic experiments [83]. A second hurdle is computational. The sheer of number of intrinsic relationships between gene and protein sequences poses a computational barrier even to today's most scalable network analysis methods. For example, there are more than a hundred billion orthology relationships between protein sequences in the current STRING database, which covers around 2.5 million proteins across 630 organisms. Global network optimization on such a scale remains a steep challenge. Finally, more involved description of protein dissimilarities or functional anti-correlations should eventually be taken into account. This, however, leads to incompatibilities between functional labels, network frustration, and multiple minima for which efficient optimizations also remain a challenge.
Ultimately, the problem of raising sensitivity may prove harder. There are clearly diverse evolutionary and molecular solutions to carrying out a given functions [11,12]. Whenever we come across such a new solution, it is unlikely that existing metric of similarity will discern the conserved features that mediate the common function. One approach to increase sensitivity, for example in the context of 3D templates, is to reduce the number of residues in the templates and so increase their number of hits. Another approach is to enlarge the repertoire of functional markers, for example by generating multiple 3D templates for each protein, which also leads to more hits. As these and other more sensitive strategies are integrated into one network, the hope would be that they complement each other sufficiently that the network recovers specificity and still preserves the gains in sensitivity.
Acknowledgments
We gratefully acknowledge grant support from the National Institute of Health, NIH GM079656 and GM066099, and from the National Science Foundation, NSF, CCF 0905536.
Abbreviations
- ET
Evolutionary Trace
- ETA
Evolutionary Trace Annotation
- SG
Structural Genomics
Footnotes
Publisher's Disclaimer: This is a PDF file of an unedited manuscript that has been accepted for publication. As a service to our customers we are providing this early version of the manuscript. The manuscript will undergo copyediting, typesetting, and review of the resulting proof before it is published in its final citable form. Please note that during the production process errors may be discovered which could affect the content, and all legal disclaimers that apply to the journal pertain.
References
- 1.Sayers EW, Barrett T, Benson DA, Bolton E, Bryant SH, Canese K, Chetvernin V, Church DM, DiCuccio M, Federhen S, et al. Database resources of the National Center for Biotechnology Information. Nucleic Acids Res. 2011;39:D38–51. doi: 10.1093/nar/gkq1172. [DOI] [PMC free article] [PubMed] [Google Scholar]
- 2.Barrell D, Dimmer E, Huntley RP, Binns D, O'Donovan C, Apweiler R. The GOA database in 2009--an integrated Gene Ontology Annotation resource. Nucleic Acids Res. 2009;37:D396–403. doi: 10.1093/nar/gkn803. [DOI] [PMC free article] [PubMed] [Google Scholar]
- 3.The Universal Protein Resource (UniProt) in 2010. Nucleic Acids Res. 2010;38:D142–148. doi: 10.1093/nar/gkp846. [DOI] [PMC free article] [PubMed] [Google Scholar]
- 4.Berman HM, Westbrook JD, Gabanyi MJ, Tao W, Shah R, Kouranov A, Schwede T, Arnold K, Kiefer F, Bordoli L, et al. The protein structure initiative structural genomics knowledgebase. Nucleic Acids Res. 2009;37:D365–368. doi: 10.1093/nar/gkn790. [DOI] [PMC free article] [PubMed] [Google Scholar]
- 5.Rost B. Enzyme function less conserved than anticipated. J Mol Biol. 2002;318:595–608. doi: 10.1016/S0022-2836(02)00016-5. [DOI] [PubMed] [Google Scholar]
- 6.Tian W, Skolnick J. How well is enzyme function conserved as a function of pairwise sequence identity? J Mol Biol. 2003;333:863–882. doi: 10.1016/j.jmb.2003.08.057. [DOI] [PubMed] [Google Scholar]
- 7.Jones CE, Brown AL, Baumann U. Estimating the annotation error rate of curated GO database sequence annotations. BMC Bioinformatics. 2007;8:170. doi: 10.1186/1471-2105-8-170. [DOI] [PMC free article] [PubMed] [Google Scholar]
- 8 **.Schnoes AM, Brown SD, Dodevski I, Babbitt PC. Annotation error in public databases: misannotation of molecular function in enzyme superfamilies. PLoS Comput Biol. 2009;5:e1000605. doi: 10.1371/journal.pcbi.1000605. A careful study showing that manually curated databases are much more reliable. [DOI] [PMC free article] [PubMed] [Google Scholar]
- 9.Tottey S, Waldron KJ, Firbank SJ, Reale B, Bessant C, Sato K, Cheek TR, Gray J, Banfield MJ, Dennison C, et al. Protein-folding location can regulate manganese-binding versus copper- or zinc-binding. Nature. 2008;455:1138–1142. doi: 10.1038/nature07340. [DOI] [PubMed] [Google Scholar]
- 10.Piatigorsky J. Multifunctional lens crystallins and corneal enzymes. More than meets the eye. Ann N Y Acad Sci. 1998;842:7–15. doi: 10.1111/j.1749-6632.1998.tb09626.x. [DOI] [PubMed] [Google Scholar]
- 11.Omelchenko MV, Galperin MY, Wolf YI, Koonin EV. Non-homologous isofunctional enzymes: a systematic analysis of alternative solutions in enzyme evolution. Biol Direct. 2010;5:31. doi: 10.1186/1745-6150-5-31. [DOI] [PMC free article] [PubMed] [Google Scholar]
- 12 *.Kahraman A, Morris RJ, Laskowski RA, Favia AD, Thornton JM. On the diversity of physicochemical environments experienced by identical ligands in binding pockets of unrelated proteins. Proteins. 2010;78:1120–1136. doi: 10.1002/prot.22633. One ligand can bind into protein cavities pockets with a wide spectrum of features. [DOI] [PubMed] [Google Scholar]
- 13.Grishin NV. Fold change in evolution of protein structures. J Struct Biol. 2001;134:167–185. doi: 10.1006/jsbi.2001.4335. [DOI] [PubMed] [Google Scholar]
- 14.Rodriguez GJ, Yao R, Lichtarge O, Wensel TG. Evolution-guided discovery and recoding of allosteric pathway specificity determinants in psychoactive bioamine receptors. Proc Natl Acad Sci U S A. 2010;107:7787–7792. doi: 10.1073/pnas.0914877107. [DOI] [PMC free article] [PubMed] [Google Scholar]
- 15.Schmidt DM, Mundorff EC, Dojka M, Bermudez E, Ness JE, Govindarajan S, Babbitt PC, Minshull J, Gerlt JA. Evolutionary potential of (beta/alpha)8-barrels: functional promiscuity produced by single substitutions in the enolase superfamily. Biochemistry. 2003;42:8387–8393. doi: 10.1021/bi034769a. [DOI] [PubMed] [Google Scholar]
- 16.Todd AE, Orengo CA, Thornton JM. Plasticity of enzyme active sites. Trends Biochem Sci. 2002;27:419–426. doi: 10.1016/s0968-0004(02)02158-8. [DOI] [PubMed] [Google Scholar]
- 17.Almonacid DE, Yera ER, Mitchell JB, Babbitt PC. Quantitative comparison of catalytic mechanisms and overall reactions in convergently evolved enzymes: implications for classification of enzyme function. PLoS Comput Biol. 2010;6:e1000700. doi: 10.1371/journal.pcbi.1000700. [DOI] [PMC free article] [PubMed] [Google Scholar]
- 18.Ashburner M, Ball CA, Blake JA, Botstein D, Butler H, Cherry JM, Davis AP, Dolinski K, Dwight SS, Eppig JT, et al. Gene ontology: tool for the unification of biology. The Gene Ontology Consortium. Nat Genet. 2000;25:25–29. doi: 10.1038/75556. [DOI] [PMC free article] [PubMed] [Google Scholar]
- 19.Saier MH, Jr, Yen MR, Noto K, Tamang DG, Elkan C. The Transporter Classification Database: recent advances. Nucleic Acids Res. 2009;37:D274–278. doi: 10.1093/nar/gkn862. [DOI] [PMC free article] [PubMed] [Google Scholar]
- 20.Kanehisa M. The KEGG database. Novartis Found Symp. 2002;247:91–101. discussion 101-103, 119-128, 244-152. [PubMed] [Google Scholar]
- 21.Keseler IM, Bonavides-Martinez C, Collado-Vides J, Gama-Castro S, Gunsalus RP, Johnson DA, Krummenacker M, Nolan LM, Paley S, Paulsen IT, et al. EcoCyc: a comprehensive view of Escherichia coli biology. Nucleic Acids Res. 2009;37:D464–470. doi: 10.1093/nar/gkn751. [DOI] [PMC free article] [PubMed] [Google Scholar]
- 22.Caspi R, Altman T, Dale JM, Dreher K, Fulcher CA, Gilham F, Kaipa P, Karthikeyan AS, Kothari A, Krummenacker M, et al. The MetaCyc database of metabolic pathways and enzymes and the BioCyc collection of pathway/genome databases. Nucleic Acids Res. 2010;38:D473–479. doi: 10.1093/nar/gkp875. [DOI] [PMC free article] [PubMed] [Google Scholar]
- 23.Altschul SF, Madden TL, Schaffer AA, Zhang J, Zhang Z, Miller W, Lipman DJ. Gapped BLAST and PSI-BLAST: a new generation of protein database search programs. Nucleic Acids Res. 1997;25:3389–3402. doi: 10.1093/nar/25.17.3389. [DOI] [PMC free article] [PubMed] [Google Scholar]
- 24.Hawkins T, Luban S, Kihara D. Enhanced automated function prediction using distantly related sequences and contextual association by PFP. Protein Sci. 2006;15:1550–1556. doi: 10.1110/ps.062153506. [DOI] [PMC free article] [PubMed] [Google Scholar]
- 25.Chitale M, Hawkins T, Park C, Kihara D. ESG: extended similarity group method for automated protein function prediction. Bioinformatics. 2009;25:1739–1745. doi: 10.1093/bioinformatics/btp309. [DOI] [PMC free article] [PubMed] [Google Scholar]
- 26.Capra JA, Pollard KS, Singh M. Novel genes exhibit distinct patterns of function acquisition and network integration. Genome Biol. 2010;11:R127. doi: 10.1186/gb-2010-11-12-r127. [DOI] [PMC free article] [PubMed] [Google Scholar]
- 27.Engelhardt BE, Jordan MI, Muratore KE, Brenner SE. Protein molecular function prediction by Bayesian phylogenomics. PLoS Comput Biol. 2005;1:e45. doi: 10.1371/journal.pcbi.0010045. [DOI] [PMC free article] [PubMed] [Google Scholar]
- 28.Furnham N, Garavelli JS, Apweiler R, Thornton JM. Missing in action: enzyme functional annotations in biological databases. Nat Chem Biol. 2009;5:521–525. doi: 10.1038/nchembio0809-521. [DOI] [PubMed] [Google Scholar]
- 29.Hunter S, Apweiler R, Attwood TK, Bairoch A, Bateman A, Binns D, Bork P, Das U, Daugherty L, Duquenne L, et al. InterPro: the integrative protein signature database. Nucleic Acids Res. 2009;37:D211–215. doi: 10.1093/nar/gkn785. [DOI] [PMC free article] [PubMed] [Google Scholar]
- 30.Tian W, Arakaki AK, Skolnick J. EFICAz: a comprehensive approach for accurate genome-scale enzyme function inference. Nucleic Acids Res. 2004;32:6226–6239. doi: 10.1093/nar/gkh956. [DOI] [PMC free article] [PubMed] [Google Scholar]
- 31.Wass MN, Sternberg MJ. ConFunc--functional annotation in the twilight zone. Bioinformatics. 2008;24:798–806. doi: 10.1093/bioinformatics/btn037. [DOI] [PubMed] [Google Scholar]
- 32.Holm L, Rosenstrom P. Dali server: conservation mapping in 3D. Nucleic Acids Res. 2010;38(Suppl):W545–549. doi: 10.1093/nar/gkq366. [DOI] [PMC free article] [PubMed] [Google Scholar]
- 33.Andreeva A, Howorth D, Chandonia JM, Brenner SE, Hubbard TJ, Chothia C, Murzin AG. Data growth and its impact on the SCOP database: new developments. Nucleic Acids Res. 2008;36:D419–425. doi: 10.1093/nar/gkm993. [DOI] [PMC free article] [PubMed] [Google Scholar]
- 34.Greene LH, Lewis TE, Addou S, Cuff A, Dallman T, Dibley M, Redfern O, Pearl F, Nambudiry R, Reid A, et al. The CATH domain structure database: new protocols and classification levels give a more comprehensive resource for exploring evolution. Nucleic Acids Res. 2007;35:D291–297. doi: 10.1093/nar/gkl959. [DOI] [PMC free article] [PubMed] [Google Scholar]
- 35.Pegg SC, Brown SD, Ojha S, Seffernick J, Meng EC, Morris JH, Chang PJ, Huang CC, Ferrin TE, Babbitt PC. Leveraging enzyme structure-function relationships for functional inference and experimental design: the structure-function linkage database. Biochemistry. 2006;45:2545–2555. doi: 10.1021/bi052101l. [DOI] [PubMed] [Google Scholar]
- 36.Todd AE, Orengo CA, Thornton JM. Evolution of function in protein superfamilies, from a structural perspective. J Mol Biol. 2001;307:1113–1143. doi: 10.1006/jmbi.2001.4513. [DOI] [PubMed] [Google Scholar]
- 37.Friedberg I, Godzik A. Functional differentiation of proteins: implications for structural genomics. Structure. 2007;15:405–415. doi: 10.1016/j.str.2007.02.005. [DOI] [PubMed] [Google Scholar]
- 38.Veeramalai M, Ye Y, Godzik A. TOPS++FATCAT: fast flexible structural alignment using constraints derived from TOPS+ Strings Model. BMC Bioinformatics. 2008;9:358. doi: 10.1186/1471-2105-9-358. [DOI] [PMC free article] [PubMed] [Google Scholar]
- 39.Lisewski AM, Lichtarge O. Rapid detection of similarity in protein structure and function through contact metric distances. Nucleic Acids Res. 2006;34:e152. doi: 10.1093/nar/gkl788. [DOI] [PMC free article] [PubMed] [Google Scholar]
- 40.Brylinski M, Skolnick J. Comparison of structure-based and threading-based approaches to protein functional annotation. Proteins. 2010;78:118–134. doi: 10.1002/prot.22566. [DOI] [PMC free article] [PubMed] [Google Scholar]
- 41.Tseng YY, Dundas J, Liang J. Predicting protein function and binding profile via matching of local evolutionary and geometric surface patterns. J Mol Biol. 2009;387:451–464. doi: 10.1016/j.jmb.2008.12.072. [DOI] [PMC free article] [PubMed] [Google Scholar]
- 42.Dundas J, Ouyang Z, Tseng J, Binkowski A, Turpaz Y, Liang J. CASTp: computed atlas of surface topography of proteins with structural and topographical mapping of functionally annotated residues. Nucleic Acids Res. 2006;34:W116–118. doi: 10.1093/nar/gkl282. [DOI] [PMC free article] [PubMed] [Google Scholar]
- 43.Laskowski RA. SURFNET: a program for visualizing molecular surfaces, cavities, and intermolecular interactions. J Mol Graph. 1995;13:323–330. 307–328. doi: 10.1016/0263-7855(95)00073-9. [DOI] [PubMed] [Google Scholar]
- 44.Glaser F, Rosenberg Y, Kessel A, Pupko T, Ben-Tal N. The ConSurf-HSSP database: the mapping of evolutionary conservation among homologs onto PDB structures. Proteins. 2005;58:610–617. doi: 10.1002/prot.20305. [DOI] [PubMed] [Google Scholar]
- 45.Kinoshita K, Furui J, Nakamura H. Identification of protein functions from a molecular surface database, eF-site. J Struct Funct Genomics. 2002;2:9–22. doi: 10.1023/a:1011318527094. [DOI] [PubMed] [Google Scholar]
- 46.Shulman-Peleg A, Shatsky M, Nussinov R, Wolfson HJ. MultiBind and MAPPIS: webservers for multiple alignment of protein 3D-binding sites and their interactions. Nucleic Acids Res. 2008;36:W260–264. doi: 10.1093/nar/gkn185. [DOI] [PMC free article] [PubMed] [Google Scholar]
- 47.Brylinski M, Skolnick J. A threading-based method (FINDSITE) for ligand-binding site prediction and functional annotation. Proc Natl Acad Sci U S A. 2008;105:129–134. doi: 10.1073/pnas.0707684105. [DOI] [PMC free article] [PubMed] [Google Scholar]
- 48.Wallace AC, Laskowski RA, Thornton JM. Derivation of 3D coordinate templates for searching structural databases: application to Ser-His-Asp catalytic triads in the serine proteinases and lipases. Protein Sci. 1996;5:1001–1013. doi: 10.1002/pro.5560050603. [DOI] [PMC free article] [PubMed] [Google Scholar]
- 49.Watson JD, Sanderson S, Ezersky A, Savchenko A, Edwards A, Orengo C, Joachimiak A, Laskowski RA, Thornton JM. Towards fully automated structure-based function prediction in structural genomics: a case study. J Mol Biol. 2007;367:1511–1522. doi: 10.1016/j.jmb.2007.01.063. [DOI] [PMC free article] [PubMed] [Google Scholar]
- 50.Porter CT, Bartlett GJ, Thornton JM. The Catalytic Site Atlas: a resource of catalytic sites and residues identified in enzymes using structural data. Nucleic Acids Res. 2004;32:D129–133. doi: 10.1093/nar/gkh028. [DOI] [PMC free article] [PubMed] [Google Scholar]
- 51.Laskowski RA, Watson JD, Thornton JM. Protein function prediction using local 3D templates. J Mol Biol. 2005;351:614–626. doi: 10.1016/j.jmb.2005.05.067. [DOI] [PubMed] [Google Scholar]
- 52.Polacco BJ, Babbitt PC. Automated discovery of 3D motifs for protein function annotation. Bioinformatics. 2006;22:723–730. doi: 10.1093/bioinformatics/btk038. [DOI] [PubMed] [Google Scholar]
- 53.Redfern OC, Dessailly BH, Dallman TJ, Sillitoe I, Orengo CA. FLORA: a novel method to predict protein function from structure in diverse superfamilies. PLoS Comput Biol. 2009;5:e1000485. doi: 10.1371/journal.pcbi.1000485. [DOI] [PMC free article] [PubMed] [Google Scholar]
- 54.Ward RM, Venner E, Daines B, Murray S, Erdin S, Kristensen DM, Lichtarge O. Evolutionary Trace Annotation Server: automated enzyme function prediction in protein structures using 3D templates. Bioinformatics. 2009;25:1426–1427. doi: 10.1093/bioinformatics/btp160. [DOI] [PMC free article] [PubMed] [Google Scholar]
- 55.Lichtarge O, Bourne HR, Cohen FE. An evolutionary trace method defines binding surfaces common to protein families. J Mol Biol. 1996;257:342–358. doi: 10.1006/jmbi.1996.0167. [DOI] [PubMed] [Google Scholar]
- 56.Mihalek I, Res I, Lichtarge O. A family of evolution-entropy hybrid methods for ranking protein residues by importance. J Mol Biol. 2004;336:1265–1282. doi: 10.1016/j.jmb.2003.12.078. [DOI] [PubMed] [Google Scholar]
- 57.Yao H, Kristensen DM, Mihalek I, Sowa ME, Shaw C, Kimmel M, Kavraki L, Lichtarge O. A Sensitive, Accurate, and Scalable Method to Identify Functional Sites in Protein Structures. J Mol Bio. 2003 doi: 10.1016/s0022-2836(02)01336-0. In Press. [DOI] [PubMed] [Google Scholar]
- 58.Lichtarge O, Wilkins A. Evolution: a guide to perturb protein function and networks. Curr Opin Struct Biol. 2010;20:351–359. doi: 10.1016/j.sbi.2010.04.002. [DOI] [PMC free article] [PubMed] [Google Scholar]
- 59.Kristensen DM, Chen BY, Fofanov VY, Ward RM, Lisewski AM, Kimmel M, Kavraki LE, Lichtarge O. Recurrent use of evolutionary importance for functional annotation of proteins based on local structural similarity. Protein Sci. 2006;15:1530–1536. doi: 10.1110/ps.062152706. [DOI] [PMC free article] [PubMed] [Google Scholar]
- 60.Kristensen DM, Ward RM, Lisewski AM, Erdin S, Chen BY, Fofanov VY, Kimmel M, Kavraki LE, Lichtarge O. Prediction of enzyme function based on 3D templates of evolutionarily important amino acids. BMC Bioinformatics. 2008;9:17. doi: 10.1186/1471-2105-9-17. [DOI] [PMC free article] [PubMed] [Google Scholar]
- 61.Ward RM, Erdin S, Tran TA, Kristensen DM, Lisewski AM, Lichtarge O. De-orphaning the structural proteome through reciprocal comparison of evolutionarily important structural features. PLoS ONE. 2008;3:e2136. doi: 10.1371/journal.pone.0002136. [DOI] [PMC free article] [PubMed] [Google Scholar]
- 62.Wilkins AD, Lua R, Erdin S, Ward RM, Lichtarge O. Sequence and structure continuity of evolutionary importance improves protein functional site discovery and annotation. Protein Sci. 2010;19:1296–1311. doi: 10.1002/pro.406. [DOI] [PMC free article] [PubMed] [Google Scholar]
- 63 *.Erdin S, Ward RM, Venner E, Lichtarge O. Evolutionary trace annotation of protein function in the structural proteome. J Mol Biol. 2010;396:1451–1473. doi: 10.1016/j.jmb.2009.12.037. Motifs of evolutionarily important residues lead to reliable inferences of protein function. [DOI] [PMC free article] [PubMed] [Google Scholar]
- 64.Laskowski RA, Watson JD, Thornton JM. ProFunc: a server for predicting protein function from 3D structure. Nucleic Acids Res. 2005;33:W89–93. doi: 10.1093/nar/gki414. [DOI] [PMC free article] [PubMed] [Google Scholar]
- 65.Pal D, Eisenberg D. Inference of protein function from protein structure. Structure (Camb) 2005;13:121–130. doi: 10.1016/j.str.2004.10.015. [DOI] [PubMed] [Google Scholar]
- 66 **.von Mering C, Jensen LJ, Kuhn M, Chaffron S, Doerks T, Kruger B, Snel B, Bork P. STRING 7--recent developments in the integration and prediction of protein interactions. Nucleic Acids Res. 2007;35:D358–362. doi: 10.1093/nar/gkl825. A standard database for protein functional linkage networks across many organisms. [DOI] [PMC free article] [PubMed] [Google Scholar]
- 67.Sharan R, Ulitsky I, Shamir R. Network-based prediction of protein function. Mol Syst Biol. 2007;3:88. doi: 10.1038/msb4100129. [DOI] [PMC free article] [PubMed] [Google Scholar]
- 68.Song J, Singh M. How and when should interactome-derived clusters be used to predict functional modules and protein function? Bioinformatics. 2009;25:3143–3150. doi: 10.1093/bioinformatics/btp551. [DOI] [PMC free article] [PubMed] [Google Scholar]
- 69 *.Lee I, Lehner B, Crombie C, Wong W, Fraser AG, Marcotte EM. A single gene network accurately predicts phenotypic effects of gene perturbation in Caenorhabditis elegans. Nat Genet. 2008;40:181–188. doi: 10.1038/ng.2007.70. High-quality, whole genome network leads to experimentally verified associations with biological roles. [DOI] [PubMed] [Google Scholar]
- 70.Chua HN, Sung WK, Wong L. Exploiting indirect neighbours and topological weight to predict protein function from protein-protein interactions. Bioinformatics. 2006;22:1623–1630. doi: 10.1093/bioinformatics/btl145. [DOI] [PubMed] [Google Scholar]
- 71.Cagney G. Interaction networks: lessons from large-scale studies in yeast. Proteomics. 2009;9:4799–4811. doi: 10.1002/pmic.200900177. [DOI] [PubMed] [Google Scholar]
- 72.Lee TI, Rinaldi NJ, Robert F, Odom DT, Bar-Joseph Z, Gerber GK, Hannett NM, Harbison CT, Thompson CM, Simon I, et al. Transcriptional regulatory networks in Saccharomyces cerevisiae. Science. 2002;298:799–804. doi: 10.1126/science.1075090. [DOI] [PubMed] [Google Scholar]
- 73.Pinkert S, Schultz J, Reichardt J. Protein interaction networks--more than mere modules. PLoS Comput Biol. 2010;6:e1000659. doi: 10.1371/journal.pcbi.1000659. [DOI] [PMC free article] [PubMed] [Google Scholar]
- 74.Karaoz U, Murali TM, Letovsky S, Zheng Y, Ding C, Cantor CR, Kasif S. Whole-genome annotation by using evidence integration in functional-linkage networks. Proc Natl Acad Sci U S A. 2004;101:2888–2893. doi: 10.1073/pnas.0307326101. [DOI] [PMC free article] [PubMed] [Google Scholar]
- 75.Deng M, Chen T, Sun F. An integrated probabilistic model for functional prediction of proteins. J Comput Biol. 2004;11:463–475. doi: 10.1089/1066527041410346. [DOI] [PubMed] [Google Scholar]
- 76.Zhou D, Bousquet O, Lal TN, Weston J, Schölkopf B. Learning with local and global consistency. Advances in Neural Information Processing Systems. 2004;16:321–328. [Google Scholar]
- 77.Hu P, Jiang H, Emili A. Predicting protein functions by relaxation labelling protein interaction network. BMC Bioinformatics. 2010;11 1:S64. doi: 10.1186/1471-2105-11-S1-S64. [DOI] [PMC free article] [PubMed] [Google Scholar]
- 78.Tsuda K, Shin H, Scholkopf B. Fast protein classification with multiple networks. Bioinformatics. 2005;21 2:ii59–ii65. doi: 10.1093/bioinformatics/bti1110. [DOI] [PubMed] [Google Scholar]
- 79 *.Shin H, Lisewski AM, Lichtarge O. Graph sharpening plus graph integration: a synergy that improves protein functional classification. Bioinformatics. 2007;23:3217–3224. doi: 10.1093/bioinformatics/btm511. Network integration of diverse similarity metrics improves function prediction among protein structures. [DOI] [PubMed] [Google Scholar]
- 80 *.Venner E, Lisewski AM, Erdin S, Ward RM, Amin SR, Lichtarge O. Accurate protein structure annotation through competitive diffusion of enzymatic functions over a network of local evolutionary similarities. PLoS One. 2010;5:e14286. doi: 10.1371/journal.pone.0014286. Global network-based prediction and experimental confirmation of enzymatic function in structural genomics. [DOI] [PMC free article] [PubMed] [Google Scholar]
- 81 *.Hu P, Janga SC, Babu M, Diaz-Mejia JJ, Butland G, Yang W, Pogoutse O, Guo X, Phanse S, Wong P, et al. Global functional atlas of Escherichia coli encompassing previously uncharacterized proteins. PLoS Biol. 2009;7:e96. doi: 10.1371/journal.pbio.1000096. Large-scale function annotation based on computational and experimental tools. [DOI] [PMC free article] [PubMed] [Google Scholar]
- 82.Kuznetsova E, Proudfoot M, Sanders SA, Reinking J, Savchenko A, Arrowsmith CH, Edwards AM, Yakunin AF. Enzyme genomics: Application of general enzymatic screens to discover new enzymes. FEMS Microbiol Rev. 2005;29:263–279. doi: 10.1016/j.femsre.2004.12.006. [DOI] [PubMed] [Google Scholar]
- 83.Rodrigues AP, Grant BJ, Godzik A, Friedberg I. The 2006 automated function prediction meeting. BMC Bioinformatics. 2007;8 4:S1–4. doi: 10.1186/1471-2105-8-S4-S1. [DOI] [PMC free article] [PubMed] [Google Scholar]