

Abstract
A microfluidic electrochemical immunoassay system for multiplexed detection of protein cancer biomarkers was fabricated using a molded polydimethylsiloxane channel and routine machined parts interfaced with a pump and sample injector. Using off-line capture of analytes by heavily-enzyme-labeled 1 μm superparamagnetic particle (MP)-antibody bioconjugates and capture antibodies attached to an 8-electrode measuring chip, simultaneous detection of cancer biomarker proteins prostate specific antigen (PSA) and interleukin-6 (IL-6) in serum was achieved at sub-pg mL−1 levels. MPs were conjugated with ~90,000 antibodies and ~200,000 horseradish peroxidase (HRP) labels to provide efficient off-line capture and high sensitivity. Measuring electrodes feature a layer of 5 nm glutathione-decorated gold nanoparticles to attach antibodies that capture MP-analyte bioconjugates. Detection limits of 0.23 pg mL−1 for PSA and 0.30 pg mL−1 for IL-6 were obtained in diluted serum mixtures. PSA and IL-6 biomarkers were measured in serum of prostate cancer patients in total assay time 1.15 h and sensor array results gave excellent correlation with standard enzyme-linked immunosorbent assays (ELISA). These microfluidic immunosensors employing nanostructured surfaces and off-line analyte capture with heavily-labeled paramagnetic particles hold great promise for accurate, sensitive multiplexed detection of diagnostic cancer biomarkers.
Keywords: microfluidics, immunoarray, cancer biomarkers, off-line protein capture, gold nanoparticles, paramagnetic beads
1. Introduction
Detection of elevated levels of small collections of biomarker proteins in serum for a given cancer can provide highly reliable diagnostics compared to measuring a single biomarker (Kulasingam and Diamandis, 2008; Rusling et al., 2010; Wulfkuhle et al., 2003). While these biomarker panels hold enormous potential for early cancer detection and personalized therapy (Ferrari, 2005; Kingsmore, 2006; Ludwig and Weinstein, 2005), the necessary clinical measurements have yet to be broadly realized (Ferrari, 2005; Giljohann and Mirkin, 2009; Kingsmore, 2006; Ludwig and Weinstein, 2005; Rusling et al., 2010; Wang, 2006). Point-of-care analyses, in particular, could reduce costs, provide on-the-spot diagnosis, guide therapy, and alleviate patient stress. However, the measurements need to be done cheaply at high sensitivity and accuracy, and with minimal technical expertise and system maintenance.
Enzyme-linked immunosorbent assay (ELISA) has long served as a method-of-choice for clinical protein determinations (Findlay et al., 2000), but has limitations in analysis time, sample volume and measuring multiple proteins. LC-MS-based proteomics is a realistic tool for biomarker discovery, but currently much too expensive and technically complex for clinical diagnostics (Hawkridge and Muddiman, 2009; Hanash et al., 2008). Alternatively, antibody microarrays that capture multiple proteins can employ labeled antibodies in various detection formats. These technically simpler yet highly selective arrays hold significant promise, as yet undelivered, for future automated protein measurements (Rusling et al., 2010; Kingsmore, 2006; Giljohann and Mirkin, 2009; Wilson and Nock, 2003; Lee et al., 2008; Bensmail and Haoudi, et al., 2003; Rasooly and Jacobson et al., 2006).
Recently marketed automated or semi-automated analyzers for multiple protein determinations employ fluorescence (Luminex corp.; Rules Based Medicine Inc.) electrochemiluminescence (ECL) (Roche Diagnostics; Meso Scale Discovery), and surface plasmon resonance (Horiba Inc.; BIO-RAD) measurement technologies. Typically, assay kits are available for up to 10 proteins per sample and provide detection limits (DL) of 1–100 pg mL−1 in serum for selected target proteins (Rusling et al., 2010; Quansys Biosciences). Commercial instruments are relatively expensive, involve high cost per single-use sample well plates or chips, and require trained professionals for operation (Helay et al., 2007). These realities limit their applications to point-of-care clinical diagnostics.
Ultrasensitive single protein biomarker detection in serum or tissue lysates from prostate cancer patients has been reported (Rissin et al., 2010; Thaxton et al., 2009; Ghindilis et al., 1998, Lin and Ju, 2005; Yu et al., 2006; Mani et al., 2009; Malhotra et al., 2010; Munge et al., 2009). A recent study (Rissin et al., 2010) using optical fiber arrays featuring 50 fL wells reported a DL of 14 fg mL−1 for prostate specific antigen (PSA) in serum using magnetic beads coated with antibody that capture a target protein-fluorescent labeled antibody bioconjugate. A DNA-based bio-barcode assay for PSA was reported with DL 0.33 pg mL−1 for PSA in post surgical patient serum (Thaxton et al., 2009).
Magnetic beads have been used as labels for surface plasmon resonance (SPR) (Teramura et al., 2006; Sun et al., 2007). Off-line analyte capture using antibody-loaded magnetic nanoparticles has also been used in immunoassay protocols (Soelberg et al., 2009; Gao et al., 2007), and minimizes non-specific binding of interfering biomolecules before analyte reaches the detector. We recently combined off-line capture of analyte proteins from serum with aggregated magnetic particle labeling to detect PSA at DLs of 10 fg mL−1 by an SPR immunoassay (Krishnan et al., 2011). These examples document the lowest protein detection levels yet attained in real biomedical samples for single proteins, but such low DLs have not been reported for multiplexed determinations of proteins.
Electrochemical methods are well suited for the development of relatively simple, inexpensive devices for detection of small panels of proteins (Rusling et al., 2010; Wang, 2006). Wilson et al. (2006) pioneered immunoelectrochemical arrays for detection of up to seven proteins at ng mL−1 levels (Zheng et al., 2005; Wilson and Nie, 2006). Wei et al. (2009) reported a 16-sensor electrochemical chip with individual sensors coated with a DNA dendrimer/conducting polymer film and capture antibodies. They measured oral cancer protein biomarker interleukin (IL)-8 and IL-8 mRNA in saliva with DL of ~4 fM for IL-8 mRNA and 7 pg mL−1 for IL-8 (Wei et al., 2009).
We have developed nanostructured electrochemical immunosensors featuring single-wall nanotube (SWNT) forest and gold nanoparticle (AuNP) electrodes combined with multilabel enzyme-antibody detection particles to achieve low- and sub-pg mL−1 DLs for PSA (Yu et al., 2006; Mani et al., 2009) and interleukin-6 (IL-6) in serum (Malhotra et al., 2010; Munge et al., 2009). PSA was accurately detected in cancer patient serum and tissue lysates (Yu et al., 2006; Mani et al., 2009) using these sensors. We also simultaneously measured prostate cancer biomarkers PSA, prostate specific membrane antigen (PSMA), platelet factor-4 (PF-4) and IL-6 in serum employing an array of four single wall nanotube forest electrodes (Chikkaveeraiah et al., 2009).
Analytical assays and operations can be greatly facilitated using microfluidics (Auroux et al., 2002; Figeys, 2002; Lion et al., 2004; Ko et al., 2008; Berti et al., 2009; Herrmann et al., 2008; Tang et al., 2007; Malic et al., 2010; Pan et al., 2010; Wang, 2002; Wang et al., 2010; Whitesides, 2006). Microfluidic devices require small amounts of sample, and facilitate low DLs, high sensitivity, low cost per sample, and shorter assay times (Manz et al., 1992). Heinemann et al. were among the first to apply microfluidics in electrochemical immunoassays for proteins (Bange et al., 2005). We recently reported a microfluidic system to detect nanomolar hydrogen peroxide using a film of horseradish peroxidase on a AuNP sensor electrode (Chikkaveeraiah et al., 2009).
In this paper, we extend our earlier microfluidic design to include an 8-electrode AuNP immunoarray featuring capture antibodies attached to the sensors. The system involves a pump and a sample injector interfaced to a 1.5 mm wide, 63 μL volume, polydimethylsiloxane (PDMS) channel cured on a mold and press fitted into a plastic housing with inlets and outlets. This assembly houses a disposable 8-electrode microarray in the channel along with symmetrically placed long wire Ag/AgCl reference and Pt counter electrodes (Figure 1). Fabrication employs only conventional machining, and does not require lithography of any sort. The 1.5 mm channel width facilitates the use of 1 μm paramagnetic beads coated with 200,000 horseradish peroxidase labels and tens of thousands of detection antibodies. This approach enabled efficient off-line protein capture (Figure 2, path B) followed by injection of the protein-magnetic bead conjugates into the device for sub-pg mL−1 protein DLs. This differs from the conventional strategy in which capture antibodies on the sensor surface capture protein, followed by attachment of a labeled detection antibody (Figure 2, Path A). The microfluidic immunoarray provided accurate and sensitive detection of biomarker proteins PSA and IL-6 in prostate cancer patient serum and excellent correlation with single protein assays by standard ELISA.
Figure 1.
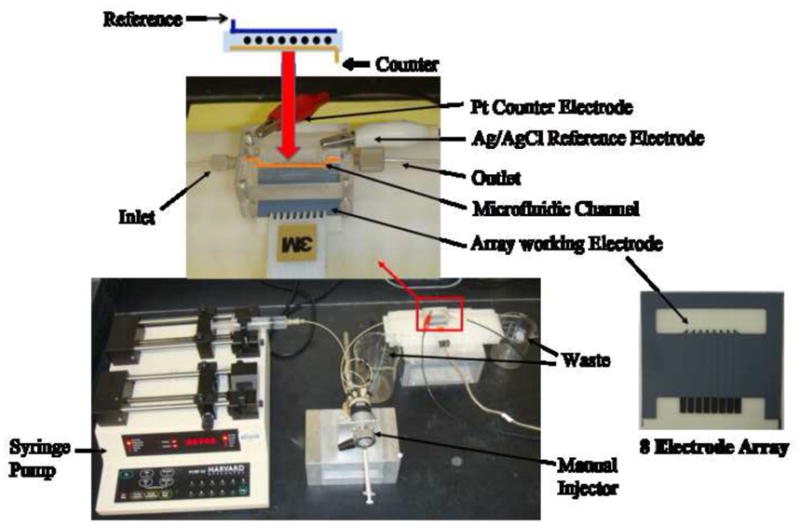
Microfluidic array device showing 8-electrode screen-printed carbon array (right). Electrodes in the array are coated with a dense layer of 5 nm glutathione-decorated gold nanoparticles, which are then derivatized with capture antibodies for the protein analytes. Target proteins in serum are captured off-line by a heavily HRP-labeled antibody-magnetic particle to form antigen-bead bioconjugate that are separated from the sample magnetically and washed to remove non-specifically bound interferences. Then, antigen-magnetic particle complexes are injected into the device, flow is stopped to capture the particles on the electrodes, and signals developed by resuming flow and injecting mediator and hydrogen peroxide (see Figure 2).
Figure 2.
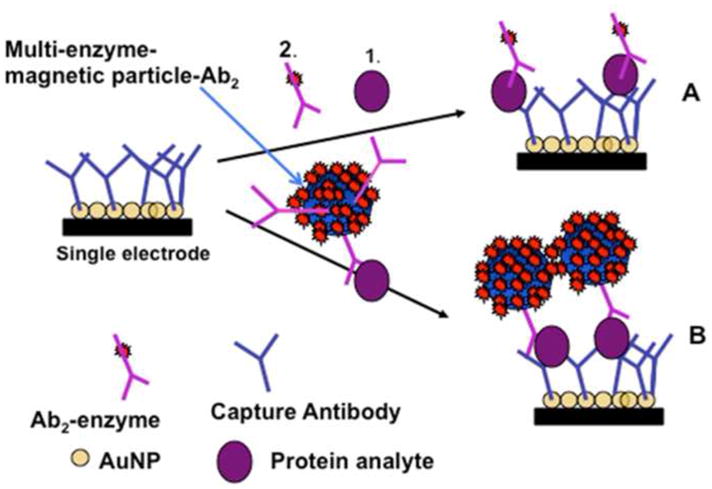
Alternative strategies for electrochemical detection by amperometric immunosensors featuring AuNP surfaces with capture antibodies attached: (A) Immunosensor after incubating with protein analyte (1) and flowing in a conventional single-enzyme (HRP) labeled antibody (2, Ab2); (B) Immunosensor as used in this work after analyte protein capture off-line with MP-Ab2-HRP having many thousands of HRP labels. MP-Ab2-HRP-analyte bioconjugates are trapped by antibodies on the electrodes, and amperometric signals are then developed by injecting a solution of mediator and hydrogen peroxide.
2. Experimental Section
2.1 Chemicals
Full experimental details are presented in the Supporting Information (SI) file. Horseradish peroxidase (HRP, MW 44000, 250–330 unit mg−1), L-Glutathione reduced (GSH, 99%), HAuCl4·3H2O (99.9%), sodium borohydride (99%) and poly(diallydimethylammonium chloride) (PDDA, MW 20%), bovine serum albumin (BSA) were from Sigma. 1-(3-(dimethylamino)propyl)-3-ethylcarbodiimide hydrochloride (EDC), and N-hydroxysulfosuccinimide (Sulfo-NHS) from Sigma were dissolved in water (400 mM EDC; 100 mM sulfo-NHS) immediately before use. Hydrogen peroxide (H2O2, 30%) was from Fisher. The poly(dimethoxy)silane (PDMS) kit was from Dow Corning. Tosyl-activated magnetic microparticles (MP, Dynabeads®, 1 μm diameter) were from Invitrogen. Tween-20 was from Sigma-Aldrich. Monoclonal (Mouse) primary anti-human prostate specific antigen (PSA) antibody (Ab1, clone no. CHYH1), tracer secondary anti-PSA antibody (Ab2, clone no. CHYH2) were obtained from Anogen/Yes Biotech Lab, Ltd. Prostate Specific Antigen (PSA) standard was from Sigma-Aldrich. Monoclonal anti-human Interleukin-6 (IL-6) antibody (clone no. 6708), recombinant human IL-6 (carrier-free) and human IL-6 polyclonal antibody (goat IgG) were from R&D systems. Human serum samples were obtained from Capital Biosciences (Rockville, MD). Protein standards were prepared in calf serum (Yu et al., 2006).
2.2 Instrumentation
An eight-electrode CHI 1030 electrochemical workstation connected to the microfluidic array system (Figure 1) was used for amperometry at ambient temperature (22±2 °C), to provide the ability to detect more than one protein in replicate measurements. Electrode arrays were from Kanichi Research Ltd. (UK). Full details are in Supporting Information (SI). The microfluidic system featured a molded soft PDMS slab with a 1.5 mm wide rectangular channel placed on top of an electrode array featuring 8 carbon screen printed electrodes (dia. 700 microns). This assembly was supported by 2 hard flat poly(methylmethacrylate) (PMMA) plates machined to fit on either side of the PDMS slab, and bolted together tightly to provide a sealed microfluidic channel (Figure 1, and Figure S1, SI) 1.5 mm wide, 2.8 cm long, with 63 μL in volume. The top PMMA plate was equipped with 4 mm ports for attaching 0.2 mm i.d. polyether ether ketone (PEEK) connecting tubing for an inlet and an outlet. The top PMMA substrate is also equipped with two holes, 0.6 mm for Ag/AgCl and 0.2 mm diameter for Pt wire electrode, directly above the microfluidic channel for inserting long Ag/AgCl reference and Pt counter electrode wires. A syringe pump was connected via 0.2 mm i.d. tubing to the inlet via an injector valve.
Glutathione-decorated gold nanoparticles (AuNPs) with diameter 5.0±1.4 nm were prepared as reported previously (Mani et al., 2009). Deposition of AuNPs was done on each electrode on an underlayer of polycation (Supporting Information) (Mani et al., 2009). The electrochemical surface area after coating with AuNPs was 2.53±0.26 × 10⁻³ cm2, estimated using cyclic voltammetry of 1 mM ferrocyanide and the Randles-Sevcik equation. AuNPs greatly improved electrochemical reversibility of array electrodes and resulted in 102% increase in surface area when compared to bare electrodes (Figure S2, SI).
2.3 Preparation of magnetic particle-Ab2-HRP conjugates
Secondary antibodies (Ab2) and HRP labels were conjugated onto 1 μm diameter tosylated superparamagnetic MPs following a protocol supplied by Invitrogen. The MP-Ab2-HRP bioconjugates were used for 2–3 weeks without noticeable degradation in performance. Using a BCA protein assay kit (Thermo Scientific, IL, USA), we estimated the number of Ab2 molecules per MP as ~9(±3) × 104. The number of horseradish peroxidase labels per magnetic particles was measured at 2.4 × 10⁵ from enzyme activity using 2,2′-Azino-bis(3-Ethylbenzthiazoline-6-Sulfonic Acid) assay (ABTS) as reactant (Putter, 1983).
2.4 Off-line protein analyte capture
For analyte capture, 20 μL of MP-Ab2-HRP for each analyte was added to 320 μL of buffer, pH 7.4. For standard calibrations, 20 μL of pure PSA and IL-6 in 5000-fold serially diluted calf serum was added to the mixture and incubated with the MP conjugates at 37°C for 30 min. Dilutions were necessary to bring patient serum PSA and IL-6 levels into the linear range of the assay. Patient serum (5 μl) was also serially diluted 5000 times, and 40 μL was incubated with mixtures of MP-Ab2-HRP, one for each analyte. Resulting MP-Ab2-HRP-antigen conjugates were magnetically separated and washed with 400 μL of 0.5% BSA in 20 mM buffer (pH 7.4), made up to 125 μL, and used immediately for immunoassay.
2.5 Fabrication and use of immunoarray electrodes
We attached capture antibodies (Ab1) for PSA and IL-6 onto individual carboxylated AuNPs electrodes in the array (Mani et al., 2009) by EDC/S-NHS amidization (see SI). Before each assay, a solution of 2% BSA in PBS containing 0.05% Tween-20 (PBS-T20) was passed into the microfluidic channel with reference and counter electrodes in place to block non-specific binding. Flow was stopped and incubation was allowed for 10 min., followed by washing with PBS-T20. MP-Ab2-HRP with captured PSA and IL-6 were injected to fill the 100 μL sample loop, and injected into the microfluidic channel at 100 μL min−1. When the sample plug was in the clear microfluidic channel, as evidenced by the red-brown color of the particles, flow was stopped for at least 15 min to capture the particles. After resuming flow, washing with detergent and buffer solutions was done. Amperometric detection was done at an optimized potential of −0.2 V vs. Ag/AgCl (Mani et al., 2009) by filling the washed sample loop with a mixture of 1 mM hydroquinone mediator and 100 μM hydrogen peroxide, then injecting at 100 μL min−1. H2O2 activates HRP to the ferryloxy form which gets reduced by the electrode utilizing hydroquinone to shuttle electrons between the electrode surface and the activated enzyme labels (Chikkaveeraiah et al., 2009).
3. Results
3.1 Device properties and characterization
The arrangement of counter and reference electrode wires along the entire length of the 8-electrode channel (Figure 1, top) virtually eliminated electrical crosstalk between electrodes, which was observed initially in less symmetric cell configurations. In addition, coating the 8-electrodes in the arrays with 5 nm glutathione-decorated AuNPs provided a surface area ~100% larger than the underlying screen-printed carbon (Supporting Information, SI), thus providing the chemistry and surface area to attach a large surface concentration of capture antibodies. To characterize reproducibility in the absence of immunosensing, amperometric signals were measured on all the neighboring AuNP electrodes after injecting 100 μM [Ru(NH3)6]-Cl3. All 8 electrodes of the array gave similar peak responses, with average peak current of 10.9 ± 0.4 nA demonstrating minimum cross talk between neighboring electrodes of the array (Figure S3). The electrode-to-electrode standard deviation of <4% is less than that of the voltammetrically determined surface area 2.53±0.26 × 10⁻³ cm2.
3.2 Immunoassay development
We chose mixtures of IL-6 and PSA to provide a challenging initial test for our microfluidic immunoarray. PSA levels are elevated in serum of prostate cancer patients and in benign prostate disease (Lilja et al., 2008; Lim and Zhang, 2007). Serum PSA of 4 to 10 ng mL−1 suggests the possibility of early stage prostate cancer (Lilja et al., 2008; Lim and Zhang, 2007), while normal levels are typically 0.5 to 3 ng mL−1. IL-6 is over-expressed in oral, lung, colorectal and prostate cancers (Riedel et al., 2005). Serum IL-6 levels of cancer patients can elevate to several thousands of pg mL−1 compared to normal levels <6 pg mL−1. Thus, concentrations of IL-6 that need to be measured in serum may be up to 1000-fold smaller than those of PSA or they may be nearly the same.
For assay development, optimal conditions were first identified to attach single primary antibodies for IL-6 or PSA to all electrodes in the microfluidic array for single-protein assays. Prior to sample introduction, 2% BSA was used to fill the microfluidic chamber to block non-specific binding of bioconjugates on all surfaces, presumably by adsorbed BSA, followed by washing with 0.05% Tween 20 and PBS. Analyte proteins were captured off-line by the heavily labeled, antibody-equipped magnetic particle conjugates. Then, a dispersion of magnetic particles with captured analytes was used to fill the sample loop, after which the dispersion in the loop was injected into the microfluidic chamber. When the plume of magnetic particles filled the electrode chamber, as evidenced by their red-brown color, flow was stopped and 15–30 min incubation was allowed to capture particles by antibodies on the electrodes. Times in this range worked equally well.
After final sequential washes with 0.05% Tween 20 in PBS and PBS, a mixture of 1 mM hydroquinone mediator and 0.1 mM hydrogen peroxide was injected into the microfluidic device via the sample loop to develop amperometric responses. All assay parameters including concentrations and incubation times were optimized to obtain high sensitivity and low signal to noise. Control experiments employed the full immunoassay procedure without antigens (PSA and IL-6), and the response reflects the sum of residual NSB and direct reduction of hydrogen peroxide.
Using the above procedures, peak currents increased linearly from 0.10 to 10 pg mL−1 for IL-6 (Figure 3) and 0.25 to 15 pg mL−1 PSA (Figure S5, SI) when these proteins were analyzed alone. Peaks without target analyte are caused by a combination of direct peroxide reduction and non-specific adsorption of labeled magnetic particles on the electrode surface. The immunoarrays were tested for the cross reactivity of the protein with their non-specific antibodies before doing detection in mixtures (Figure S6, SI). Cross reactivity between PSA with IL-6 capture antibody was 7±2% whereas the cross reactivity between IL6 with PSA capture antibody was 4±1%. Such levels were considered negligible and not corrected for in the assays.
Figure 3.
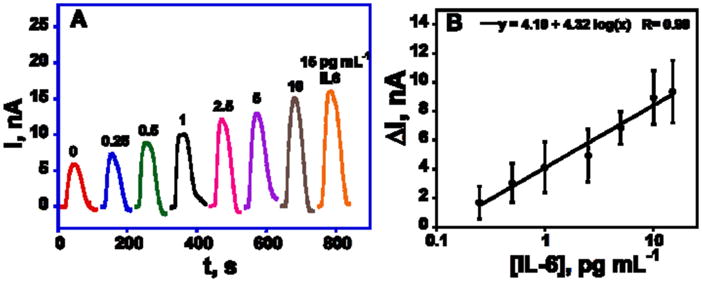
Amperometric responses for IL-6 alone at −0.2 V developed by injecting 1 mM hydroquinone and 0.1 mM H2O2 after capturing analyte protein-MP-Ab2-HRP bioconjugates on the electrodes in the microfluidic device. Standard deviation corresponds to 8 spots of the array (n=8) on three separate arrays.
For simultaneous detection of IL-6 and PSA, capture antibodies for each protein analyte were attached to each of 4 spots of the array. After treatment with blocking solutions, arrays were incubated as above with a mixture of individual MP-HRP-Ab2 bioconjugates, one for each analyte, that had been used to capture PSA and IL-6 off-line from 5000-fold diluted serum. We diluted the calf serum standards to the same degree to mimic the matrix effect in the immunoassay of diluted patient serum samples. For the detection of the two proteins, peak currents increased linearly from 0.225 to 5 pg mL−1 for PSA and 0.30 to 20 pg mL−1 for IL-6 (Figure 4AB), with the lower concentrations representing detection limits of the PSA/IL-6 assay.
Figure 4.
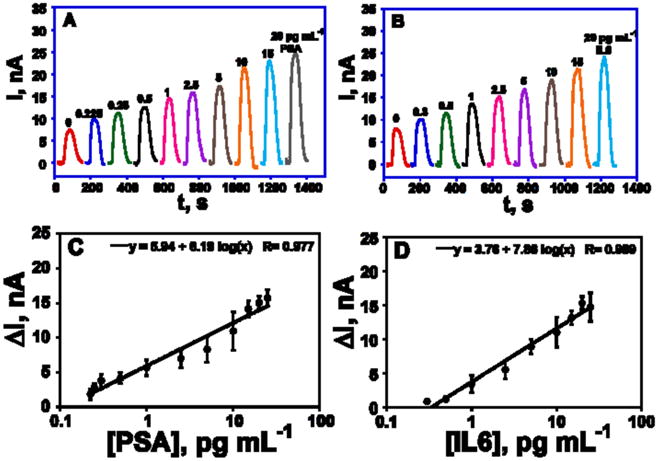
Amperometric responses for PSA/IL-6 mixtures at −0.2 V vs Ag/AgCl developed by injecting 1 mM hydroquinone and 0.1 mM H2O2 after capturing analyte protein-MP-Ab2-HRP bioconjugates on the electrodes in the microfluidic device, for (A) PSA, and (B) IL-6. Immunoarray calibration plots of standards in diluted serum for (C) PSA and (D) IL6. For C and D, n=4.
In all calibrations, a single 8-electrode chip was used for one standard concentration of each protein, then a fresh chip was inserted into the device for assessing additional standards. Good chip-to-chip reproducibility is illustrated by the small error bars (Figure 4CD). Detection limits (DL) were measured as 3 times the average SD above the zero protein control. DLs of 0.1 pg mL−1 for PSA and 0.25 pg mL−1 for IL-6 was obtained when individual proteins were captured off-line by the MP-Ab2-HRP conjugates. When the mixture of 2 analytes was used, DLs degrades slightly to 0.23 pg mL−1 for PSA and 0.30 pg mL−1 for IL6. The sensitivity of the immunoarray to PSA was 2.5 μA mL [fg protein] −1 cm−2 and for IL-6 was 3.1 μA mL [fg protein] −1 cm−2 in mixtures.
To test the reproducibility of the microfluidic immunoassay, 3 concentrations of the analytes were randomly selected and run under the same conditions on different days. Figure S7 (SI) demonstrates the reproducibility of the amperometric response in the low pg mL−1 range. Average standard deviations were 22% at 0.5 pg mL−1, 11% at 1 pg mL−1 and 14% at 5 pg mL−1 for PSA and 19% at 1 pg mL−1, 18% at 2.5 pg mL−1, and 15% at 5 pg mL−1 for IL-6.
3.4 Assay validation with human serum samples
Five human serum samples, 4 from male prostate cancer patients and 1 from a cancer-free female, were analyzed by the microfluidic immunoarray and by standard single-protein ELISA methods. Immunoarray results showed good correlation with ELISA for all the serum samples (Figure 5). PSA levels were below 1 ng mL−1 for the control sample and the cancer patient samples 1–4 showed much higher levels, as expected. IL-6 levels measured by the two methods were also well correlated for all samples. Correlations were also conformed by linear correlation plots of arrays vs. ELISA results that gave slopes of 1.0 and intercepts of zero, within experimental error (Figure S8, Table S1, SI).
Figure 5.
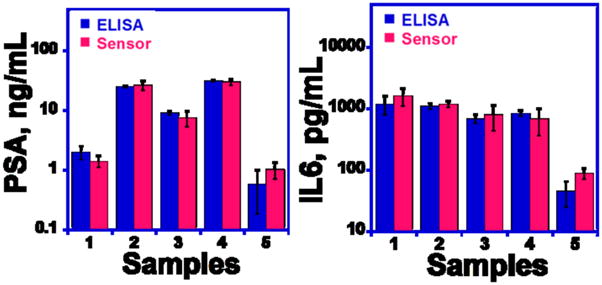
Comparison of microfluidic immunoarray assay results with standard ELISA assays for PSA and IL-6 in human serum (for both assays, n=4).
4. Discussion
Results above show that a simple microfluidic array featuring nanostructured electrodes combined with off-line analyte capture by heavily labeled magnetic particles can be used to detect two proteins in serum with high sensitivity and accuracy. Fabrication of the PDMS-based microfluidic system requires only routine machining combined with an inexpensive 8-electrode chip, pump and injector, and can be adapted to rapid protein detection of any small collection of proteins for which good antibodies are available.
Off-line capture minimizes interferences from non-specific binding. When combined with nanostructured AuNP electrodes and antibody loaded magnetic particle-Ab2 bioconjugates labeled with 200,000 HRPs, the approach provided excellent sensitivity, several decades of linear dynamic range, and sub-pg mL−1 detection limits for PSA and IL-6 in mixtures (Figure 4). Performance showed only a small degradation in going from single protein assays (Figures 3 and S5) to PSA/IL-6 mixtures in serum. DLs were 5–100 fold below those of existing commercial multi-protein assays (Rusling et al., 2010; Quansys Biosciences).
Assay results on prostate cancer patient serum confirmed good accuracy of the microfluidic array by showing excellent correlations with individual standard ELISA assays (Figure 5). These results also demonstrate the high selectivity of the two-protein immunoarray protocol, which was able to provide accurate results at clinically relevant concentrations in the presence of hundreds of additional proteins at much higher concentrations in human serum (Hanash et al., 2008). The high sensitivity of the assay extending to sub-pg mL−1 levels may help facilitate selectivity by allowing high dilution of the serum, although even in the heavily diluted serum there will be hundreds of proteins at higher concentrations than the analytes.
Good device-to-device standard deviations are shown by small error bars (Figure 4CD), demonstrating that the immunoarray chips are quite reproducible in “throwaway” mode. This feature may facilitate future clinical or point-of-care applications in which an inexpensive antibody loaded chip could be discarded and destroyed after each run. In addition, by coupling the immunoarrays with microfluidics, total assay time was only 1.15 h, significantly less than non-microfluidic single sensors immunoassays (~2.5 hr) and much less than ELISA (Findlay et al., 2000). This assay time approaches the range needed for point of care diagnostics, although ideally it should be shorter.
The detection limit of sandwich immunoassays is often controlled by non-specific binding (NSB) (Wilson and Nock, 2003). Off-line capture of proteins on MP bioconjugates was used previously by Soelberg et al. (2009) to detect 100 pg mL−1 staphylococcal enterotoxin B in serum and stool samples by SPR. Nam et al. (2003) reported a bio-bar code assay employing magnetic beads conjugated with antibodies and DNA labels and gold nanoparticles functionalized with oligonucleotides and polyclonal detection antibodies to detect 30 aM PSA. In our case, each MP contains tens of thousands of Ab2 (i.e., 90,000/particle, see experimental section) to drive the binding equilibria toward very high efficiency for capture of analyte proteins. As an added benefit, the heavily labeled MPs provide large signal amplification. Off-line protein capture virtually eliminates NSB of non-analyte proteins and other biomolecules in biomedical samples before the analyte proteins are ever introduced into the measuring device. The measuring electrodes are never exposed to unprocessed sample, but only to the washed MPs that have captured the analytes. Only residual NSB from the MPs with no captured analyte can contribute to the NSB background.
Thus, the microfluidic system coupled with off-line capture by heavily labeled MP-Ab2-HRP particles provided low DLs of 0.23 pg mL−1 for PSA and 0.30 pg mL−1 of IL-6 in serum mixtures. ELISA is usually limited to one protein at a time, and best DLs are ~3 pg mL−1 (Lilja et al., 2008; Williams et al., 2007; Ward et al., 2001). Newer commercial multi-protein detection systems, which often rely on microbead-based assays, typically achieve best protein DLs of 1–10 pg mL−1, while a significant fraction of protein biomarkers can have serum levels <1 pg mL−1 (Srinivas et al., 2001). Typical automated multi-protein detection systems cost well in excess of $100K and utilize relatively costly single-use assay kits (Quansys Biosciences). Our prototype microfluidic arrays can detect sub-pg mL−1 protein levels in serum mixtures, with DLs in general 5 to 30-fold better than automated commercial multiprotein systems. The microfluidic immunoarrays combine simple machined components with commercial pumps and injectors costing ~$7000, and disposable 8-electrode chips currently cost ~$10 each. In its present form, the microfluidic array can easily be adapted to simultaneous detection of 4 or more proteins. The assay requires 5 μL of patient serum, much less than ELISA and other commercial assays (Quansys Biosciences; Vessella et al., 1992; Butch et al., 2002).
5. Conclusions
In summary, we demonstrated sensitive, reproducible and accurate electrochemical detection of two protein cancer biomarkers in serum using microfluidic immunoarrays. Both proteins were accurately detected in a limited set of serum samples from cancer patients. These studies suggest the excellent potential of these simple microfluidic immunoarrays coupled with off-line capture by heavily labeled magnetic particles for multiplexed cancer biomarker detection in diagnostic assays. Protocols should be easily adaptable for more than two proteins.
Supplementary Material
Acknowledgments
This work was supported by PHS grant ES013557 from NIEHS/NIH, and by a Walton Research Fellowship awarded by Science Foundation Ireland to JFR. We thank Debra Rood and Lawrence K. Silbart for assistance with ELISA measurements.
Footnotes
Publisher's Disclaimer: This is a PDF file of an unedited manuscript that has been accepted for publication. As a service to our customers we are providing this early version of the manuscript. The manuscript will undergo copyediting, typesetting, and review of the resulting proof before it is published in its final citable form. Please note that during the production process errors may be discovered which could affect the content, and all legal disclaimers that apply to the journal pertain.
References
- Auroux PA, Iossifidis D, Reyes DR, Manz A. Anal Chem. 2002;74:2637–2652. doi: 10.1021/ac020239t. [DOI] [PubMed] [Google Scholar]
- Bange A, Halsall HB, Heinemann WR. Biosens Bioelectron. 2005;20:2488–2503. doi: 10.1016/j.bios.2004.10.016. [DOI] [PubMed] [Google Scholar]
- Bensmail H, Haoudi A. Biomed Biotechnol. 2003;4:217–230. doi: 10.1155/S1110724303209207. [DOI] [PMC free article] [PubMed] [Google Scholar]
- Berti F, Laschi S, Palchetti I, Rossier JS, Reymond F, Mascini M, Marrazza G. Talanta. 2009;77:971–978. doi: 10.1016/j.talanta.2008.07.064. [DOI] [PubMed] [Google Scholar]
- BIO-RAD. Website http://www.bio-rad.com.
- Butch AW, Crary D, Yee M. Clin BioChem. 2002;35:143–145. doi: 10.1016/s0009-9120(02)00280-1. [DOI] [PubMed] [Google Scholar]
- Chikkaveeraiah BV, Bhirde A, Malhotra R, Patel V, Gutkind JS, Rusling JF. Anal Chem. 2009;81:9129–9134. doi: 10.1021/ac9018022. [DOI] [PMC free article] [PubMed] [Google Scholar]
- Chikkaveeraiah BV, Liu H, Mani V, Papadimitakapoulos F, Rusling JF. Electrochem Commun. 2009;11:819–822. doi: 10.1016/j.elecom.2009.02.002. [DOI] [PMC free article] [PubMed] [Google Scholar]
- Ferrari M. Nat Rev Cancer. 2005;5:161–171. doi: 10.1038/nrc1566. [DOI] [PubMed] [Google Scholar]
- Figeys D. Proteomics. 2002;2:373–382. doi: 10.1002/1615-9861(200204)2:4<373::AID-PROT373>3.0.CO;2-I. [DOI] [PubMed] [Google Scholar]
- Findlay JWA, Smith WC, Lee JW, Nordblom GD, Das I, DeSilva BS, Khan MN, Bowsher RR. J pharm biomed Anal. 2000;21:1249–1273. doi: 10.1016/s0731-7085(99)00244-7. [DOI] [PubMed] [Google Scholar]
- Gao L, Zhuang J, Nie L, Zhang J, Zhang Y, Gu N, Wang T, Feng J, Yang D, Perrett S, Yan X. Nat Nanotech. 2007;2:577–583. doi: 10.1038/nnano.2007.260. [DOI] [PubMed] [Google Scholar]
- Ghindilis AL, Atanasov P, Wilkins M, Wilkins E. Biosens Bioelectron. 1998;13:113–131. doi: 10.1016/s0956-5663(97)00031-6. [DOI] [PubMed] [Google Scholar]
- Giljohann DA, Mirkin CA. Nature. 2009;426:461–464. doi: 10.1038/nature08605. [DOI] [PMC free article] [PubMed] [Google Scholar]
- Hanash SM, Pitteri SJ, Faca VM. Nature. 2008;452:571–579. doi: 10.1038/nature06916. [DOI] [PubMed] [Google Scholar]
- Hawkridge AM, Muddiman DC. Ann Rev Anal Chem. 2009;2:265–277. doi: 10.1146/annurev.anchem.1.031207.112942. [DOI] [PMC free article] [PubMed] [Google Scholar]
- Healy DA, Hayes CJ, Leonard P, McKenna L, O’Kennedy R. Trends Biotechnol. 2007;25:125–131. doi: 10.1016/j.tibtech.2007.01.004. [DOI] [PubMed] [Google Scholar]
- Herrmann M, Veres T, Tabrizian M. Anal Chem. 2008;80:5160–5167. doi: 10.1021/ac800427z. [DOI] [PubMed] [Google Scholar]
- Horiba Inc. Website: http://www.horiba.com/scientific/products/surface-plasmon-resonance-imaging-spri/
- Kingsmore SF. Nat Rev Drug Discov. 2006;5:310–320. doi: 10.1038/nrd2006. [DOI] [PMC free article] [PubMed] [Google Scholar]
- Krishnan S, Mani V, Kumar CV, Rusling JF. Angew Chem Int Ed. 2011;50:1175–1178. doi: 10.1002/anie.201005607. [DOI] [PMC free article] [PubMed] [Google Scholar]
- Ko YJ, Maeng JH, Ahn Y, Hwang SY, Cho NG, Lee SH. Electrophoresis. 2008;29:3466–3476. doi: 10.1002/elps.200800139. [DOI] [PubMed] [Google Scholar]
- Kulasingam V, Diamandis EP. Nat Clin Prac Oncol. 2008;5:588–599. doi: 10.1038/ncponc1187. [DOI] [PubMed] [Google Scholar]
- Lee HJ, Wark AW, Corn RM. Analyst. 2008;133:975–983. doi: 10.1039/b717527b. [DOI] [PMC free article] [PubMed] [Google Scholar]
- Lilja H, Ulmert D, Vickers AJ. Nat Rev Cancer. 2008;8:268–278. doi: 10.1038/nrc2351. [DOI] [PubMed] [Google Scholar]
- Lim CT, Zhang Y. Biosens Bioelectron. 2007;22:1197–1204. doi: 10.1016/j.bios.2006.06.005. [DOI] [PubMed] [Google Scholar]
- Lin J, Ju H. Biosens Bioelectron. 2005;20:1461–1470. doi: 10.1016/j.bios.2004.05.008. [DOI] [PubMed] [Google Scholar]
- Lion N, Reymond F, Girault HH, Rossier JS. Curr Opin Biotechnol. 2004;15:31–37. doi: 10.1016/j.copbio.2004.01.001. [DOI] [PubMed] [Google Scholar]
- Ludwig JA, Weinstein JN. Nat Rev Cancer. 2005;5:845–856. doi: 10.1038/nrc1739. [DOI] [PubMed] [Google Scholar]
- Luminex corp. Website: http://www.luminexcorp.com/technology/index.html.
- Malhotra R, Patel V, Vaque JP, Gutkind JS, Rusling JF. Anal Chem. 2010;82:3118–3123. doi: 10.1021/ac902802b. [DOI] [PMC free article] [PubMed] [Google Scholar]
- Malic L, Brassard D, Veres T, Tabrizian M. Lab on a Chip. 2010;10:418–431. doi: 10.1039/b917668c. [DOI] [PubMed] [Google Scholar]
- Mani V, Chikkaveeraiah BV, Patel V, Gutkind JS, Rusling JF. ACS Nano. 2009;3:585–594. doi: 10.1021/nn800863w. [DOI] [PMC free article] [PubMed] [Google Scholar]
- Manz A, Harrison DJ, Verpoorte EMJ, Fettinger JC, Paulus A, Ludi H, Widmer HM. J Chromatogr. 1992;593:253–258. [Google Scholar]
- Meso Scale Discovery. website: http://www.mesoscale.com/CatalogSystemWeb/WebRoot/
- Munge BS, Krause CE, Malhotra R, Patel V, Gutkind JS, Rusling JF. Electrochem Comm. 2009;11:1009–1012. doi: 10.1016/j.elecom.2009.02.044. [DOI] [PMC free article] [PubMed] [Google Scholar]
- Nam JM, Thaxton CS, Mirkin CA. Science. 2003;301:1884–1886. doi: 10.1126/science.1088755. [DOI] [PubMed] [Google Scholar]
- Pan Y, Sonn GA, Sin MLY, Mach KE, Shih MC, Gau V, Wong PK, Liao JC. Biosens Bioelectron. 2010;26:649–654. doi: 10.1016/j.bios.2010.07.002. [DOI] [PMC free article] [PubMed] [Google Scholar]
- Pütter J. In: Methods of Enzymatic Analysis. Becker R, Bergmeyer HU, editors. Vol. 3. Verlug Chemie; Deerfield Beach, FL: 1983. pp. 286–293. [Google Scholar]
- Quansys Biosciences. Website: http://www.quansysbio.com/multiplex-elisa/compare-multiplex-elisas.
- Rasooly A, Jacobson J. Biosens Bioelectron. 2006;21:1851–1858. doi: 10.1016/j.bios.2006.01.003. [DOI] [PubMed] [Google Scholar]
- Riedel F, Zaiss I, Herzog D, Götte K, Naim R, Hörman K. Anticancer Res. 2005;25:2761–2765. [PubMed] [Google Scholar]
- Rissin DM, Kan CW, Campbell TG, Howes SC, Fournier DR, Song L, Piech T, Patel PP, Chang L, Rivnak AJ, Ferrell EP, Randall JD, Provuncher GK, Walt DR, Duffy DC. Nat Biotechnol. 2010;28:595–600. doi: 10.1038/nbt.1641. [DOI] [PMC free article] [PubMed] [Google Scholar]
- Roche Diagnostics. website: http://rochediagnostics.ca/lab/solutions/e2010.php.
- Rules Based Medicine Inc. Website: http://www.rulesbasedmedicine.com/
- Rusling JF, Kumar CV, Patel V, Gutkind JS. Analyst. 2010;135:2496–2511. doi: 10.1039/c0an00204f. [DOI] [PMC free article] [PubMed] [Google Scholar]
- Soelberg SD, Stevens RC, Limaye AP, Furlong CE. Anal Chem. 2009;81:2357–2363. doi: 10.1021/ac900007c. [DOI] [PMC free article] [PubMed] [Google Scholar]
- Srinivas PR, Kramer BS, Srivastava S. Lancet Oncol. 2001;2:698–704. doi: 10.1016/S1470-2045(01)00560-5. [DOI] [PubMed] [Google Scholar]
- Sun Y, Bai Y, Song D, Li X, Wang L, Zhang H. Biosens Bioelectron. 2007;23:473–478. doi: 10.1016/j.bios.2007.06.016. [DOI] [PubMed] [Google Scholar]
- Tang D, Yuan R, Chai Y. Clin Chem. 2007;53:1323–1329. doi: 10.1373/clinchem.2006.085126. [DOI] [PubMed] [Google Scholar]
- Teramura Y, Arima Y, Iwata H. Anal Biochem. 2006;357:208–215. doi: 10.1016/j.ab.2006.07.032. [DOI] [PubMed] [Google Scholar]
- Thaxton CS, Elghanian R, Thomas AD, Stoeva SI, Lee JS, Smith ND, Schaeffer AJ, Klocker H, Horninger W, Bartsch G, Mirkin CA. Proc Natl Acad Sci USA. 2009;106:18347–18442. doi: 10.1073/pnas.0904719106. [DOI] [PMC free article] [PubMed] [Google Scholar]
- Vessella R, Noteboom J, Lange PH. Clin Chem. 1992;38:2044–2054. [PubMed] [Google Scholar]
- Wang J. Electrophoresis. 2002;23:713–718. doi: 10.1002/1522-2683(200203)23:5<713::AID-ELPS713>3.0.CO;2-7. [DOI] [PubMed] [Google Scholar]
- Wang J. Biosens Bioelectron. 2006;21:1887–1892. doi: 10.1016/j.bios.2005.10.027. [DOI] [PubMed] [Google Scholar]
- Wang J, Ahmad H, Ma C, Shi Q, Vermesh O, Vermesh U, Heath J. Lab on a Chip. 2010;10:3157–3162. doi: 10.1039/c0lc00132e. [DOI] [PMC free article] [PubMed] [Google Scholar]
- Ward AM, Catto JWF, Hamdy FC. Annu Clin Biochem. 2001;38:633–651. doi: 10.1258/0004563011901055. [DOI] [PubMed] [Google Scholar]
- Wei F, Liao W, Xu Z, Yang Y, Wong DT, Ho CM. Small. 2009;5:1784–1790. doi: 10.1002/smll.200900369. [DOI] [PMC free article] [PubMed] [Google Scholar]
- Wei F, Patel P, Liao W, Chaudhry K, Zhang L, Arellano-Garcia M, Hu S, Elashoff D, Zhou H, Shukla S, Shah F, Ho CM, Wong DT. Clin Cancer Res. 2009;15:4446–4452. doi: 10.1158/1078-0432.CCR-09-0050. [DOI] [PMC free article] [PubMed] [Google Scholar]
- Whitesides GM. Nature. 2006;442:368–373. doi: 10.1038/nature05058. [DOI] [PubMed] [Google Scholar]
- Williams TI, Toups KL, Saggese DA, Kalli KR, Cliby WA, Muddiman DC. J Proteome Res. 2007;6:2936–2962. doi: 10.1021/pr070041v. [DOI] [PubMed] [Google Scholar]
- Wilson DS, Nock S. Angew Chem Int Ed. 2003;42:494–500. doi: 10.1002/anie.200390150. [DOI] [PubMed] [Google Scholar]
- Wilson MS, Nie WY. Anal Chem. 2006;78:2507–2513. doi: 10.1021/ac0518452. [DOI] [PubMed] [Google Scholar]
- Wulfkuhle JD, Liotta LA, Petricoin EF. Nat Rev Cancer. 2003;3:267–275. doi: 10.1038/nrc1043. [DOI] [PubMed] [Google Scholar]
- Yu X, Munge B, Patel V, Jensen G, Bhirde A, Gong JD, Kim SN, Gillespie J, Gutkind JS, Papadimitrakopoulos F, Rusling JF. J Am Chem Soc. 2006;128:11199–11205. doi: 10.1021/ja062117e. [DOI] [PMC free article] [PubMed] [Google Scholar]
- Zheng G, Patolsky F, Cui Y, Wang WU, Lieber CM. Nat Biotech. 2005;23:1294–1301. doi: 10.1038/nbt1138. [DOI] [PubMed] [Google Scholar]
Associated Data
This section collects any data citations, data availability statements, or supplementary materials included in this article.