

Abstract
Objectives
To investigate the feasibility of converting a computer–aided detection (CAD) scheme for digitised screen–film mammograms to full-field digital mammograms (FFDMs) and assessing CAD performance on a large database.
Methods
The database included 6478 FFDM images acquired on 1120 females, with 525 cancer cases and 595 negative cases. The database was divided into five case groups: (1) cancer detected during screening, (2) interval cancers, (3) “high-risk” recommended for surgical excision, (4) recalled but negative and (5) negative (not recalled). A previously developed CAD scheme for masses depicted on digitised images was converted and re-optimised for FFDM images while keeping the same image-processing structure. CAD performance was analysed on the entire database.
Results
The case-based sensitivity was 75.6% (397/525) for the current mammograms and 40.8% (42/103) for the prior mammograms deemed negative during clinical interpretation but “visible” during retrospective review. The region-based sensitivity was 58.1% (618/1064) for the current mammograms and 28.4% (57/201) for the prior mammograms. The CAD scheme marked 55.7% (221/397) and 35.7% (15/42) of the masses on both views of the current and the prior examinations, respectively. The overall CAD-cued false-positive rate was 0.32 per image, ranging from 0.29 to 0.51 for the five case groups.
Conclusion
This study indicated that (1) digitised image-based CAD can be converted for FFDMs while performing at a comparable, or better, level; (2) CAD detects a substantial fraction of cancers depicted on prior examinations, albeit most having been marked only on one view; and (3) CAD tends to mark more false-positive results on “difficult” negative cases that are more visually difficult for radiologists to interpret.
During the last decade, commercialised computer-aided detection (CAD) systems were widely tested and used clinically as a “second reader” to assist radiologists in interpreting mammograms. These CAD systems process digitised or digital images and cue (mark) suspicious regions that may depict specific abnormalities (i.e. masses and/or microcalcification clusters). The second reader approach emphasises that radiologists should first read and interpret mammograms without CAD followed by the viewing of the CAD results to help highlight the regions that were missed and/or underestimated in their importance prior to making a final recommendation. A number of studies have assessed the impact of using CAD on radiologists' performances when interpreting mammograms [1-6]. Some studies have shown that radiologists detected more cancers associated with microcalcifications when using CAD for both screen–film mammograms (SFMs) [1] and full-field digital mammograms (FFDMs) [6], while other studies have shown that the use of CAD had little impact on both cancer detection and recall rates of the radiologists [2], or even reduced radiologists' performances as measured by the areas under the receiver operating characteristic (ROC) curves [5]. Although there is no universal agreement of the actual benefit, if any, when using CAD, in terms of performance improvement [7], the objective assessment of CAD performance alone is important and has scientific merit. Our own previous study demonstrated an improvement in radiologists' performances when using “highly performing” CAD, whereas radiologists' performances actually reduced when using “poorly performing” CAD with high false-positive cueing rates [8].
A number of previous studies have assessed the performances of commercialised CAD systems alone using different image databases [9-15]. Among these, several studies assessed the performances of CAD systems for FFDM images. One study reported an 89% (32/36) case-based sensitivity at 0.29 false-positive mass cues per image using the ImageChecker M1000-DM system (v.3.1; Hologic Inc., Bedford, MA) [13], and another study reported a 92% (57/62) case-based sensitivity at an overall false-positive rate of 0.58 per image (including both false-positive mass and microcalcification cluster cues) using the SecondLook system (v.7.2; iCAD Inc., Nashua, NH) [14]. Recently, Sadaf et al [15] reported the largest retrospective study to evaluate CAD performance using FFDM images to date. The database included 127 verified cancer cases associated with 5 different types of abnormalities. The CAD scheme (SecondLook v.7.2) achieved overall a 91% (115/127) cancer detection sensitivity, or an 88% (44/51) sensitivity on malignant masses.
As the majority of previously reported CAD schemes in mammography were developed for digitised SFM images, researchers have also investigated the feasibility of converting the CAD schemes developed for digitised SFM images to new CAD schemes for FFDM images and comparing the performance difference between the CAD schemes for these two types of images [16,17]. For example, one study reported that two CAD schemes with similar architecture achieved comparable performance levels for the FFDM and SFM images (e.g. 70% sensitivity at 0.9 and 1.0 false-positive marks per image) by using a database of 229 SFM and FFDM examinations depicting 27 malignant and 104 benign masses [16]. Another study investigated the feasibility of converting an SFM-based CAD scheme to classify between malignant and benign masses depicted on FFDM images without changing the structure of the CAD scheme. Using a data set depicting 148 malignant and 139 benign masses, the study reported that there was no significant difference from the result of a previous study using SFM images (with an area under the ROC curve of 0.81 and p=0.83) [17].
Despite these research efforts and the reported high performances, the databases used in the previous studies [13-17] were limited. In the assessment of CAD performance using digitised SFM images, studies have shown that the higher sensitivity reported in a study using a limited database (i.e. 89% [9]) was often not achievable in large-scale assessment studies [1,11,12]. Therefore, owing to the large variation of breast abnormalities and normal tissue structures, assembling a large database that can relatively sufficiently represent the general screening population is important to effectively assess or predict CAD performance in clinical practice. In this study, we assembled a large and unique FFDM image database that included a series of mammographic examinations on the same females belonging to one of five categories (groups) and converted our in-house developed CAD scheme for SFM images into a new scheme for FFDM images. An assessment of the CAD performance levels on the entire FFDM image database and each of the five case groups, at an operating level similar to that previously used to assess commercial CAD schemes for SFM images [12], is described herein.
Methods and materials
The FFDM image database
Under an institutional review board-approved protocol, we ascertained fully anonymised FFDM examinations from the clinical facilities of our medical centre and transferred the images to our research facility. A group of research staff ensured that the examinations were fully anonymised and generated an outcome “truth file” for each of the examinations included in the database. All examinations were acquired using Hologic Selenia (Hologic Inc) FFDM systems between 2006 and 2008. The honest brokers specifically selected cases that met one of the five groups of interest. The assembled database included: (1) 477 verified cancer cases depicting masses that were detected during mammographic screening examination and confirmed by the followed diagnostic work-up (Group 1); (2) 48 “interval” cancer cases depicting masses that were detected in the interval between 2 screening examinations (Group 2); (3) 19 patients who had been recalled during screening for diagnostic work-up of masses that were determined to be “high-risk” pre-cancer cases (e.g. lobular carcinoma in situ) with surgical excision of lesions recommended (Group 3); (4) 222 patients recalled for diagnostic work-up of masses that were ultimately determined to be benign (Group 4); and (5) 354 screening cases rated as “negative” (no recall during screening) and later verified by follow-up as negative examinations (Group 5). For each selected case, the FFDM images from the examination in question, as well as prior FFDM examinations (if available), were ascertained. After an automated de-identification processing to remove all personal information, the images with a new assigned ID code were saved on our computer network server for access by the investigators. All related diagnostic information [e.g. breast density Breast Imaging Reporting and Data System (BI-RADS) ratings, diagnostic reports, pathology-verified abnormality types, location, staging, age, family history etc.] was also ascertained and recorded in a separate code-protected database.
In summary, the FFDM database included a total of 6478 FFDM images acquired from 1120 females (cases). Among these, 525 females were positive for cancer (associated with malignant masses) and 595 were benign or negative. In addition, 669 females had only 1 FFDM examination (namely the current examination), whereas 371 had 2 (1 current and 1 prior) and 80 had 3 (1 current and 2 prior) FFDM examinations during the period in question (2006–2008). In 525 verified cancer cases, 136 had 2 examinations and 38 had 3 examinations. Thus, a total of 1651 FFDM examinations were available to this study. Among these examinations, 737 had been performed on females with detected cancer. Among the 595 negative (or benign) cases, suspicious masses had been detected in 159 cases and the diagnostic work-up resulted in 19 recommended operations for lesion excision. The distribution of the cases in this study is summarised in Table 1.
Table 1. Case distribution of the full-field digital mammogram (FFDM) image database that included 1120 cases with a total of 6478 FFDM images, by case group and number of available examinations per person.
| Number of cases | Cases with only a current examination | Cases with 2 examinations (<18 months) | Cases with 2 examinations (≥18 months) | Cases with 3 examinations (<3 years) | |
| All selected cases | 1120 | 669 | 326 | 45 | 80 |
| Cancer cases | 477 | 341 | 80 | 27 | 29 |
| Interval cancer cases | 48 | 10 | 29 | 0 | 9 |
| Screening-negative cases | 354 | 199 | 138 | 1 | 16 |
| Recalled but negative cases | 222 | 113 | 68 | 16 | 25 |
| High-risk cases (with surgical excision) | 19 | 6 | 11 | 1 | 1 |
After assembling the FFDM image database, a three-step process, namely a review, a verification and a final confirmation, of identifying and marking the centre of the mass, as well as circular margins encapsulating the mass in question, was performed by experienced scientists and radiologists with the aid of information from de-identified source documents provided by the honest brokers. The final confirmation was performed by an experienced radiologist. This information was saved as the truth file for performance testing. Table 2 summarises the distribution of the marked mass regions in three different categories of cases. In this database, a total of 1673 mass regions of interest were marked (including 1265 regions associated with cancer and 408 associated with benign masses). In the retrospective review, 201 mass regions associated with 103 cancer cases were marked on the images acquired from the prior examinations of these cases that had been either missed or interpreted as negative during the original screening.
Table 2. Distribution of 1673 marked mass regions on different types of examinations included in the full-field digital mammogram database.
| Total number of marked mass regions | Mass regions marked on the current examination | Mass regions marked on the first prior examination | Mass regions marked on the second prior examination | |
| Malignant masses on cancer cases | 1121 | 968 | 117 | 36 |
| Malignant masses representing interval cases | 144 | 96 | 46 | 2 |
| Benign masses | 408 | 321 | 67 | 20 |
The computer-aided detection scheme
A detailed description of our CAD scheme for digitised SFM images has been reported elsewhere [12,18]. The performance of this CAD scheme has been tested and compared with two leading commercial CAD schemes using a large independent clinical database. Comparable performance levels were achieved for all three CAD schemes [12]. In this study, we first applied our SFM-based CAD scheme to the entire FFDM database. We found that the sensitivity was 8.8% (46/525) and the false-positive rate was 0.12 per image (776/6478). To understand the reasons for this performance degradation, we randomly selected a set of FFDM images depicting marked mass regions. We then visually examined the CAD-generated mass boundary contours and analysed the recorded image features. We found that (1) a large fraction of the CAD-defined mass regions depicted on the FFDM images were only partially segmented (smaller than the visually identified region) and (2) the pixel value-related features (i.e. contrast, pixel value standard deviation) were saturated (assigned to the maximum value). As the FFDM images had a substantially higher contrast resolution and a larger pixel value variation (in absolute terms) than the digitised SFM images, the previously optimised CAD scheme based on the SFM images was not appropriate for the FFDM images. We adopted the following steps to convert the CAD scheme while maintaining the same architecture and the three image-processing stages.
The first stage of the scheme uses a difference-of-Gaussian filtering method to identify suspicious regions. In this stage, we proportionally adjusted kernel sizes of the Gaussian filters and thresholds for region sizes in detecting the initial suspicious regions to compensate for the pixel size difference between the SFM and FFDM images. This stage typically identifies between 10 and 50 suspicious regions per image depending on breast tissue density and pattern distribution. The upper level of the scheme’s sensitivity is determined by this stage. The second stage of the scheme applies a multilayer topographic region growth algorithm to segment mass regions. In this stage, we adjusted the difference in region growth thresholds for each topographic layer to compensate for the increases in mass region contrast. Based on measurements of average contrast for all detected mass regions in our FFDM database and compared with the results of our previously recorded average contrast for all mass regions depicted in our digitised SFM database, we found that the average contrast of mass regions depicted on the FFDM images was approximately 80% higher. Thus, we increased region growth thresholds by 25% at each of the 3 layers to approximately compensate for the total differences (80% vs 3×25%=75%) of the contrast levels of the masses depicted on the two types of images. We also adjusted all size- and contrast-related classification rules implemented in the scheme to compensate for differences in pixel sizes and image contrast levels. This step typically reduces the number of suspicious mass regions to fewer than five per image.
After computing a set of image features for each segmented suspicious mass region, the third stage of the scheme applies a multifeature-based artificial neural network (ANN) to generate a detection score indicating the likelihood of the segmented region being positive. In this stage, we retrained the ANN using the FFDM images to account for the feature value changes. The ANN used exactly the same 14 input features and 4 hidden neurones as previously reported [19]. From CAD-segmented suspicious mass regions, we randomly selected 500 true-positive and 500 false-positive regions to generate a training data set. The ANN was retrained under the same training protocol as that previously implemented to train the ANN for the digitised SFM images [20]. To test the robustness of our training protocol, we randomly selected another testing data set with 500 true-positive and 500 false-positive regions. The performance levels on the two data sets (training and testing) were evaluated using the areas under the ROC curves (computed by the program of ROCKIT [21]). Finally, an operating threshold was applied to the detection scores and only the regions with detection scores greater than the threshold were cued as the mass regions while the other regions were discarded. Figure 1 shows an example of applying this CAD scheme to four FFDM images acquired from one examination of a 48-year-old female diagnosed with cancer.
Figure 1.

An example of applying our computer-aided detection (CAD) scheme to four full-field digital mammogram (FFDM) images acquired from a 48-year-old female diagnosed with cancer. The left two columns show original FFDM images and the right two columns highlight three CAD-segmented suspicious mass regions, of which two are associated with a spiculated mass (right breast) and one is false positive (left breast).
Performance assessment
After conversion, we applied our new CAD scheme to all 6478 FFDM images. For each detected and segmented suspicious mass region, CAD generated a detection score. First, all recorded CAD scores were analysed using a previously developed Free-response receiver operating characteristic (FROC)-type data analysis method [22]. Second, using an operating threshold at the same level as previously implemented for testing [12], we computed the actual CAD-cueing performance, including sensitivity, false-positive rate per image and fraction of images or examinations without false-positive cues. Performance levels were assessed for the entire image database and for each of the five case groups, as well as for the current and the prior examinations. As current CAD schemes detect a high fraction of masses only in one view [23] and clinical studies have shown that radiologists are more likely to discard masses cued by CAD only in one view as false positives [3,4], we reported both case-based and region-based performance levels. In the case-based analysis, a mass was counted as detected if it was cued by CAD on either one or both views of the same examination. In the region-based analysis, each mass region was independently counted.
As the CAD scheme is intended to be used as a second reader, the lower the correlation between CAD-cueing results and radiologists' true-positive detections, the higher the probability that CAD would help to improve radiologists' performances. Previous studies suggest that abnormalities with low contrast, small size [24] or low conspicuity [25] are more difficult to detect. Therefore, we also analysed the ability of CAD to detect subtle masses by computing correlations between CAD-generated detection scores and the values of two image-based features, namely region conspicuity [26] and integrated density that is equivalent to estimating the actual “physical mass” of a region by combining the size of the mass and difference in density levels, or pixel values, between pixels within the detected mass region and the average density of the surrounding region or background tissue [27]. High correlations suggest that CAD tends to detect “easy” masses that may also correlate with detection results by radiologists, whereas low correlations suggest that CAD can detect at least a fraction of “difficult” masses that are more likely to be missed by radiologists without CAD.
Results
Our FFDM database has the following characteristics that may relate to CAD performance. First, the majority of cases, namely 58.2% (652/1120) and 3.6% (40/1120), were rated as heterogeneously dense (BI-RAD 3) and extremely dense (BI-RAD 4), respectively. Figure 2 shows the distribution of breast tissue density as rated by the radiologists during the original interpretations. Second, the majority of detected mass margins were rated by radiologists as either irregular or spiculated. Among the 525 verified malignant masses, the boundary margins of 464 masses were actually rated by radiologists. Among these, 11 (2.4%) were described as smooth, 293 (63.1%) as irregular, 123 (26.5%) as spiculated and 37 (8.0%) as focal asymmetry. Third, for the 174 cancer patients who had 2 or 3 serial mammograms (Table 1), we found that 59.2% (103/174) of the masses were “visible” or actually depicted on prior examinations in the retrospective review.
Figure 2.
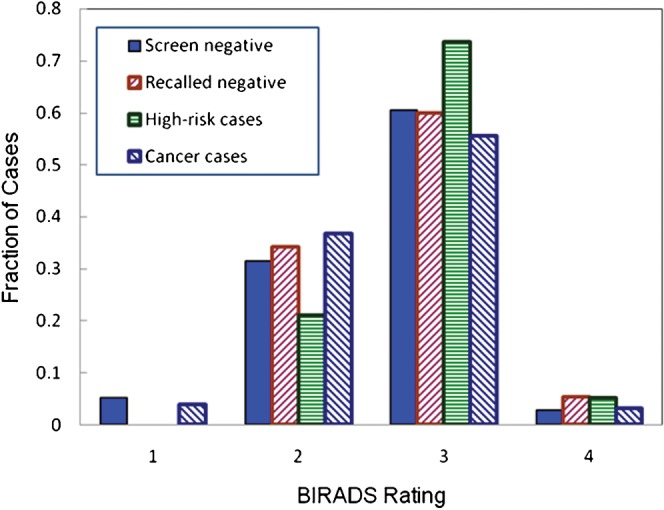
Fraction of cases with a specific breast tissue density [Breast Imaging Reporting and Data System (BI-RADS)] rating in each of four categories of cases.
Figure 3 displays three region-based normalised performance curves that show the results of the “training”, the initial testing of the re-optimised ANN and the overall performance when applying ANN to the entire data set. We note that the entire data set included all regions selected for training and testing plus 20 additional true-positive and 20 727 false-positive regions, making the total number of tested regions include 1020 true-positive and 21 727 false-positive regions. The “pooling” was deemed reasonable as the areas under the performance curves (AUCs) were 0.879±0.007 for the training data set, 0.871±0.007 for the testing data set and 0.865±0.005 for the entire data set. The maximum difference among the three AUC values was only 1.59%.
Figure 3.
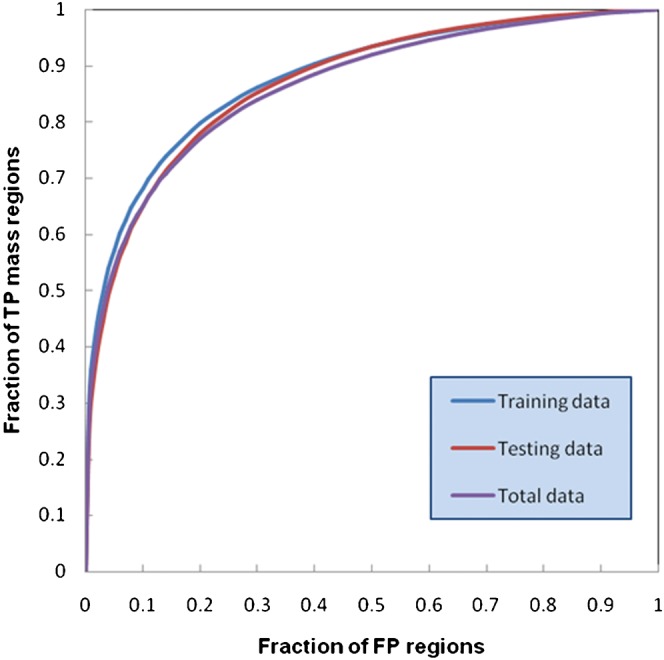
Three region-based normalised performance curves for the training set, testing set and the entire ensemble of suspected mass regions initially detected in the database.
The CAD scheme initially detected 1025 malignant mass regions distributed in 507 cases, which represented an upper limit of 96.6% (507/525) case-based sensitivity and 81.0% (1025/1265) region-based sensitivity. At this stage, 21 727 false-positive regions on 6478 images (3.35 per image) were also identified. The upper limits of sensitivity for the prior examinations were 81.6% (84/103) and 72.1% (145/201) for the case-based and region-based detections, respectively. Figure 4 shows two case-based FROC-type performance curves that included all initially detected suspicious mass regions depicted on the current and the prior examinations.
Figure 4.
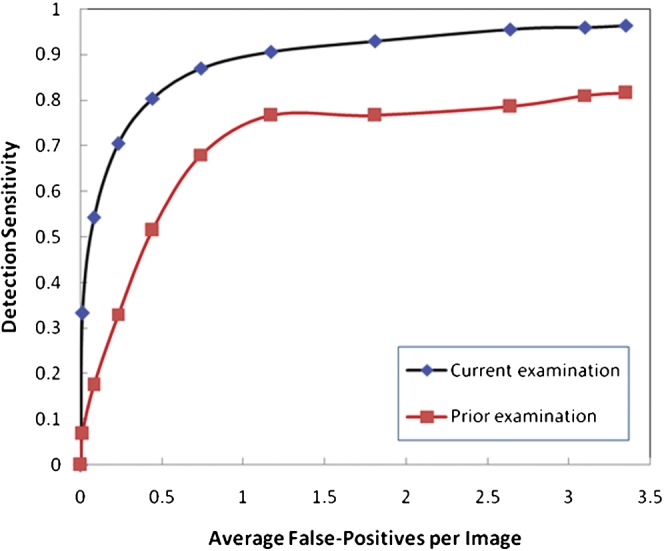
Two free-response receiver operating characteristic-type computer-aided detection case-based performance curves for all current and prior images in the database.
Table 3 summarises the actual CAD sensitivity levels on mass detection after applying the operating threshold to the five different case groups of our database. The overall case-based sensitivity levels of the CAD scheme were 75.6% (397/525) for the current examinations and 40.8% (42/103) for the prior examinations. The overall region-based sensitivity levels were 58.1% (618/1064) for the current examinations and 28.4% (57/201) for the prior examinations. In current examinations, the CAD scheme cued 55.7% (221/397) of masses on both views, while only 35.7% (15/42) of masses depicted on the prior examinations were cued by the CAD scheme on both views. Although the CAD scheme had slightly higher sensitivity in cancer cases (Group 1) than in interval cancer cases (Group 2) in the current examinations (75.9% vs 72.9%), the CAD scheme had substantially lower sensitivity levels in Group 1 than in Group 2 in the prior examinations (35.0% vs 60.9%), which is probably the result of shorter time intervals between sequential examinations in the interval cancer group (approximately 6 months on average rather than 12 months or longer). This makes the use of CAD potentially more beneficial in the interval cancer group.
Table 3. Summary of case-based and region-based computer-aided detection-cued sensitivity at an operating threshold resulting in an average false-positive identification rate of 0.32 per image.
| Type of examination | All cases with marked masses | Cued cancers (case-based sensitivity) | Number of marked mass regions | Cued mass regions (region-based sensitivity) |
| Current and interval cancer cases combined | 525 | 397 (75.6%) | 1064 | 618 (58.1%) |
| Current cancer cases only | 477 | 362 (75.9%) | 968 | 571 (59.0%) |
| Interval cancer cases only | 48 | 35 (72.9%) | 96 | 47 (49.0%) |
| Prior cancer and prior interval cancer cases combined | 103 | 42 (40.8%) | 201 | 57 (28.4%) |
| Prior cancer cases only | 80 | 28 (35.0%) | 153 | 37 (24.2%) |
| Prior interval cancer cases only | 23 | 14 (60.9%) | 48 | 20 (41.7%) |
The CAD-generated false-positive rate in the entire data set was 0.32 (2070/6478) per image, ranging from 0.29 to 0.51 marks per image in the 5 different case groups (Table 4). These false-positive cues were distributed on 26.1% (1692/6478) of the images or 58.1% (960/1651) of the examinations, resulting in a 73.9% image-based specificity and a 41.9% examination-based specificity. In general, the more difficult negative case groups (i.e. high-risk pre-cancer cases with surgery excision and recalled but negative cases) had higher false-positive cueing rates than the easy negative case group (i.e. not recalled screening negative cases).
Table 4. Computer-aided detection-cued false-positive rates in different groups of full-field digital mammogram cases and images.
| Image category | Number of images | Number of cued false-positive regions | False-positive cues per image |
| Cancer cases | 2480 | 715 | 0.29 |
| Interval cancer cases | 421 | 130 | 0.31 |
| High-risk cases | 118 | 60 | 0.51 |
| Recalled negative | 1348 | 552 | 0.41 |
| Screen negative | 2111 | 613 | 0.29 |
Two computed Pearson's correlation coefficients between the CAD-generated scores and the two image features for all initially detected 1025 mass regions were 0.558 (p<0.0001) for region conspicuity and 0.307 (p<0.0001) for integrated density. Figures 5 and 6 show histograms of all detected mass regions as related to these two image features, before and after applying the operating threshold to the CAD-generated detection scores. The large diversity of the mass regions depicted in this database is noted, as well as the diversity of the mass regions actually marked as positive by the CAD scheme. Namely, CAD was able to detect (cue) a fraction of the difficult mass regions exhibiting low conspicuity and/or small integrated density.
Figure 5.
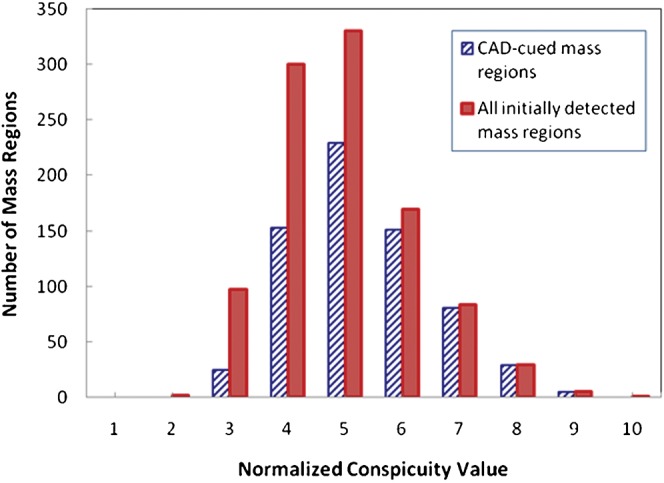
Distribution of initially detected and computer-aided detection (CAD)-cued mass regions as a function of computed mass conspicuity.
Figure 6.
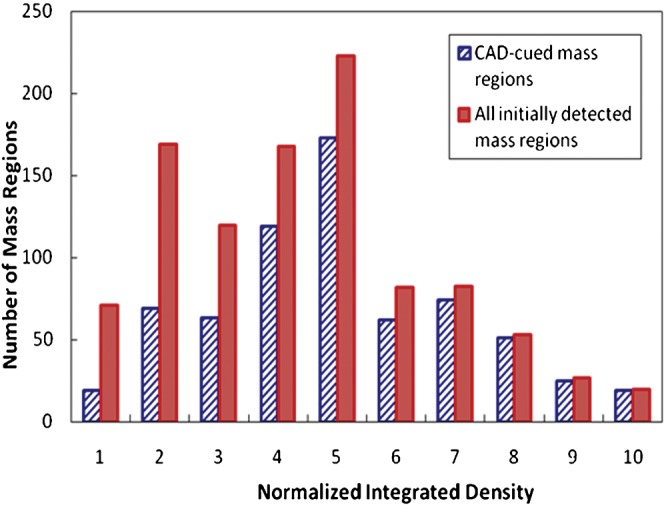
Distribution of initially detected and computer-aided detection (CAD)-cued mass regions as a function of computed integrated density.
Discussion
Although previous studies have investigated the feasibility of converting the CAD schemes developed for SFM images to new schemes for FFDM images [16,17] and assessed CAD performance using limited FFDM databases [13-15], this study is a more comprehensive assessment study that included a number of unique characteristics. First, we used a larger and more diverse FFDM database that included sequential FFDM examinations acquired from 1120 females. To the best of our knowledge, no such large-scale CAD assessment study using an FFDM database has been previously reported. The use of a large and diverse database increases the reliability in assessing CAD performance. Second, unlike previous studies that reported CAD performance levels on one testing (general) database, we compared and reported CAD performance levels on different categories (subdatabases) of cases, including the current and prior examinations. The results of our study indicate the large difference of the CAD performance levels in different case categories. Third, since CAD is used as a second reader, reducing the correlation between radiologists and CAD schemes in detecting breast cancer (i.e. malignant masses) is important in clinical practice. We also preliminarily assessed the correlations between the CAD-cued results and the two image features that are considered to be correlated with the difficulty of visual detection.
After demonstrating that direct application of an SFM image-based CAD scheme to the FFDM images resulted in the substantial degradation of performance, we used the same scheme structure (approach) to re-optimise the CAD scheme by changing only a limited number of variables/parameters. In our previous assessment study, using a subset of an SFM database that included a group of cancer cases with only current examinations, two commercial CAD schemes and our own CAD scheme achieved 72.4%, 70.7% and 67.2% case-based detection sensitivities at the corresponding 0.39, 0.27 and 0.27 false-positive detections per image, respectively [12]. In this study, the “converted” CAD scheme achieved a 75.6% case-based sensitivity at 0.32 false-positive detections per image for a comparable case group, albeit with a different data set by necessity. The result suggests that this simple approach can yield a CAD performance level that is as good as, or better than, a CAD performance level for SFM images [12]. This is largely due to better contrast resolution, detection quantum efficiency and system linearity.
Similar to the previously reported study in assessing performances of CAD schemes for SFM images [28], our CAD scheme for FFDM images was able to detect a substantial fraction of regions, namely 40.8% (42/103) of masses associated with cancer that were deemed “retrospectively visible” on prior examinations but that were either missed or interpreted as negative during the original clinical study were detected. In this study, 44.3% (176/397) of masses depicted on the current FFDM images were cued by CAD only on 1 view. As expected, owing to the increase in subtleness of masses depicted on the prior examinations, a larger fraction of these (64.3%) were cued by CAD only on 1 view. These results are consistent with our previous observations using SFM images [12,23]. The false-positive rate was higher in the high risk with surgery excision but benign group (0.51) and the recalled (with biopsy) but negative group (0.41) than the group of screening negative without recall (0.29). Although the previous study reported that CAD typically cued more false positives on the images depicting denser breast tissue [29], the increase of false-positive cues in the suspicious negative case groups in this study is not related to the difference in breast density because the breast density BI-RADS rating distributions are relatively similar across all case groups (Figure 2). The results seem to suggest that current CAD-cueing results on the false positives are correlated with the “ease” level of interpretation as performed by radiologists.
False-positive detection per image is the most popular index to report CAD performance (i.e. used for plotting FROC curves) in previous studies. However, since the CAD-cued false-positive cues are not uniformly distributed in the images of a database, some images can depict multiple false-positive cues. The fraction of images or examinations (cases) without CAD-cued false positives should be a more useful index in the screening environment. In this study, the false-positive rate of the CAD scheme was 0.32 per image, while the fractions of images and examinations depicting false-positive marks were 0.261 and 0.581, respectively. Hence, the image-based specificity was 73.9% and the examination-based specificity was 41.9%. As radiologists typically read four images per examination, the examination-based specificity should be a clinically relevant index of CAD performance. As a result, in order to detect 75.6% of the cancers, 58.1% examinations depicted at least 1 CAD-cued false-positive mass mark in our database. Thus, to increase radiologists' confidence in CAD results for mass detection, additional reduction in the false-positive cueing rates remains an important and highly warranted objective.
Although detection sensitivity of current CAD schemes may remain relatively low (i.e. <80%), CAD can be a valuable tool to be used as a second reader if there is a lower correlation between the radiologists' interpretations and the CAD cueing results. We recognised that assessing such a correlation was a very difficult task that had not been fully investigated in CAD assessment studies. In this study, we did a few preliminary and simple data analyses. By assuming that radiologists are more likely to miss the masses with lower conspicuity, or smaller integrated density values [24-27], we analysed and computed the correlation between CAD-generated detection scores and these two image features. The results (Figures 5 and 6) suggested that CAD was able to cue (or flag) some of the difficult masses with low conspicuity and small integrated density values. The results also support that CAD can be a useful tool to help radiologists detect more subtle cancers (in particular to further reduce its false-positive detection rate).
The study also has a number of limitations. First, our database included all available sequentially ascertained screening-detected cancer cases during the period of interest. However, the non-all-inclusive selection of negative cases may not be optimal for this purpose, as we selected only 595 negative cases from a very large pool of negative cases. Based on the limited assessments, the negative data set in this study seemed to represent, on average, relatively dense breasts. Second, in converting the CAD to be applicable to FFDM images, we indeed needed to retrain the scheme and, in particular, the ANN. This could affect somewhat the robustness and generalisability of our results; however, the very comparable performance levels achieved on the training, the testing and the entire data set suggested that the randomisation and training protocol we implemented, at least partially, reduced biases. Third, we tested the CAD performance in detecting masses and we cannot comment on the feasibility of a similar conversion process in the detection of microcalcification clusters. However, most CAD schemes achieve very high sensitivity of detecting microcalcification clusters (e.g. >98% [26]) when applied to digitised SFM images; hence, we do not believe that this is a major concern primarily because of the improved contrast sensitivity associated with the FFDM images (e.g. 100% [15]).
Acknowledgments
This work is supported in part by grants CA77850 and CA101733 to the University of Pittsburgh from the National Cancer Institute, National Institutes of Health, Bethesda, MD, USA.
References
- 1.Freer TM, Ulissey MJ. Screening mammography with computer-aided detection: prospective study of 12,860 patients in a community breast center. Radiology 2001;220:781–6 [DOI] [PubMed] [Google Scholar]
- 2.Gur D, Sumkin JH, Rockette HE, Ganott M, Hakim C, Hardesty L, et al. Changes in breast cancer detection and mammography recall rates after the introduction of a computer-aided detection system. J Natl Cancer Inst 2004;96:185–90 [DOI] [PubMed] [Google Scholar]
- 3.Khoo LA, Taylor P, Given-Wilson RM. Computer-aided detection in the United Kingdom National Breast Screening Programme: prospective study. Radiology 2005;237:444–9 [DOI] [PubMed] [Google Scholar]
- 4.Ko JM, Nicholas MJ, Mendel JB, Slanetz PJ. Prospective assessment of computer-aided detection in interpretation of screening mammograms. AJR Am J Roentgenol 2006;187:1483–91 [DOI] [PubMed] [Google Scholar]
- 5.Fenton JJ, Taplin SH, Carney PA, Abraham L, Sickles EA, D'Orsi C, et al. Influence of computer-aided detection on performance of screening mammography. N Engl J Med 2007;356:1399–409 [DOI] [PMC free article] [PubMed] [Google Scholar]
- 6.Karssemeijer N, Bluekens AM, Beijerinck D, Deurenberg JJ, Beeknan M, Visser R, et al. Breast cancer screening results 5 years after introduction of digital mammography in a population-based screening program. Radiology 2009;253:353–8 [DOI] [PubMed] [Google Scholar]
- 7.Nishikawa RM, Kallergi M. Computer-aided detection, in its present form, is not an effective aid for screening mammography (point/counterpoint). Med Phys 2006;33:811–14 [DOI] [PubMed] [Google Scholar]
- 8.Zheng B, Ganott MA, Britton CA, Hakim CM, Hardesty LA, Gur D. Soft-copy mammographic readings with different computer-assisted diagnosis cuing environments: preliminary findings. Radiology 2001;221:633–40 [DOI] [PubMed] [Google Scholar]
- 9.Malich A, Marx C, Facius M, Boehm T, Fleck M, Kaiser WA. Tumour detection rate of a new commercially available computer-aided detection system. Eur Radiol 2001;11:2454–9 [DOI] [PubMed] [Google Scholar]
- 10.Baum F, Fischer U, Obenauer S, Grabbe E. Computer-aided detection in direct digital full-field mammography: initial results. Eur Radiol 2002:3015–17 [DOI] [PubMed] [Google Scholar]
- 11.Brem RF, Baum J, Lechner M, Kaplan S, Souders S, Naul LG, et al. Improvement in sensitivity of screening mammography with computer-aided detection: a multiinstitutional trial. AJR Am J Roentgenol 2003;181:687–93 [DOI] [PubMed] [Google Scholar]
- 12.Gur D, Stalder JS, Hardesty LA, Zheng B, Sumkin JH, Chough D, et al. Computer-aided detection performance in mammographic examination of masses: assessment. Radiology 2004;223:418–23 [DOI] [PubMed] [Google Scholar]
- 13.The JS, Schilling KJ, Hoffmeister JW, Friedmann E, McGinnis R, Holcomb RG. Detection of breast cancer with full-field digital mammography and computer-aided detection. AJR Am J Roentgenol 2009;192:337–40 [DOI] [PubMed] [Google Scholar]
- 14.Yang SK, Moon WK, Cho N, Park JS, Cha JH, Kim SM, et al. Screening mammography – detected cancers: sensitivity of a computer-aided detection system applied to full-field digital mammograms. Radiology 2007;244:104–11 [DOI] [PubMed] [Google Scholar]
- 15.Sadaf A, Crystal P, Scaranelo A, Helbich T. Performance of computer-aided detection applied to full-field digital mammography in detection of breast cancers. Eur J Radiol 2011;77:457–61 [DOI] [PubMed] [Google Scholar]
- 16.Wei J, Hadjiiski LM, Sahiner B, Chan HP, Ge J, Roubidoux MA, et al. Computer-aided detection systems for breast masses: comparison of performance on full-field digital mammograms and digitized screen-film mammograms. Acad Radiol 2007;14:659–69 [DOI] [PMC free article] [PubMed] [Google Scholar]
- 17.Li H, Giger M, Yuan Y, Chen W, Horsch K, Lan L, et al. Evaluation of computer-aided diagnosis on large clinical full-field digital mammographic dataset. Acad Radiol 2008;15:1437–45 [DOI] [PMC free article] [PubMed] [Google Scholar]
- 18.Zheng B, Chang YH, Gur D. Computerized detection of masses in digitized mammograms using single-image segmentation and a multilayer topographic feature analysis. Acad Radiol 1995;2:959–66 [DOI] [PubMed] [Google Scholar]
- 19.Zheng B, Sumkin JH, Good WF, Gur D. Applying computer-assisted detection schemes to digitized mammograms after JPEG data compression: an assessment. Acad Radiol 2000;7:595–602 [DOI] [PubMed] [Google Scholar]
- 20.Zheng B, Chang YH, Good WF, Gur D. Adequacy testing of training set sample sizes in the development of a computer-assisted diagnosis scheme. Acad Radiol 1997;4:497–502 [DOI] [PubMed] [Google Scholar]
- 21.Metz CE.ROCKIT 0.9B beta version. Available from: http://www.radiology.uchicago.edu/krl/
- 22.Zheng B, Shah R, Wallace L, Hakim C, Ganott MA, Gur D. Computer-aided detection in mammography: an assessment of performance on current and prior images. Acad Radiol 2002;9:1245–50 [DOI] [PubMed] [Google Scholar]
- 23.Zheng B, Leader JK, Abrams GS, Sumkin JH, Hakim CM, Ganott MA, et al. Multiview-based computer-aided detection scheme for breast masses. Med Phys 2006;33:3135–43 [DOI] [PubMed] [Google Scholar]
- 24.Nishikawa RM, Giger ML, Doi K, Metz CE, Yin FF, Vyborny CJ, et al. Effect of case selection on the performance of computer-aided detection schemes. Med Phys 1994;21:265–9 [DOI] [PubMed] [Google Scholar]
- 25.Kundel HL, Revesz G. Lesion conspicuity, structure noise, and film reader error. AJR Am J Roentgenol 1976;126:1233–8 [DOI] [PubMed] [Google Scholar]
- 26.Zheng B, Chang YH, Good WF, Gur D. Performance gain in computer-assisted detection schemes by averaging scores generated from artificial neural networks with adaptive filtering. Med Phys 2001;28:2302–8 [DOI] [PubMed] [Google Scholar]
- 27.Chang YH, Good WF, Leader JK, Wang XH, Zheng B, Hardesty LA, et al. Integrated density of a lesion: a quantitative, mammographically derived, invariable measure. Med Phys 2003;30:1805–11 [DOI] [PubMed] [Google Scholar]
- 28.Warren Burhenne LJ, Wood SA, D'Orsi CJ, Feig SA, Kopans DB, O’Shaughnessy KF, et al. Potential contribution of computer-aided detection to the sensitivity of screening mammography. Radiology 2000;215:554–62 [DOI] [PubMed] [Google Scholar]
- 29.Ho WT, Lam PW. Clinical performance of computer-assisted detection (CAD) system in detecting carcinoma in breasts of different densities. Clin Radiol 2003;58:133–6 [DOI] [PubMed] [Google Scholar]