

Abstract
The talking face affords multiple types of information. To isolate cortical sites with responsibility for integrating linguistically relevant visual speech cues, speech and nonspeech face gestures were presented in natural video and point‐light displays during fMRI scanning at 3.0T. Participants with normal hearing viewed the stimuli and also viewed localizers for the fusiform face area (FFA), the lateral occipital complex (LOC), and the visual motion (V5/MT) regions of interest (ROIs). The FFA, the LOC, and V5/MT were significantly less activated for speech relative to nonspeech and control stimuli. Distinct activation of the posterior superior temporal sulcus and the adjacent middle temporal gyrus to speech, independent of media, was obtained in group analyses. Individual analyses showed that speech and nonspeech stimuli were associated with adjacent but different activations, with the speech activations more anterior. We suggest that the speech activation area is the temporal visual speech area (TVSA), and that it can be localized with the combination of stimuli used in this study. Hum Brain Mapp, 2010. © 2010 Wiley‐Liss, Inc.
Keywords: visual perception, speech perception, functional magnetic resonance imaging, lipreading, speechreading, phonetics, gestures, temporal lobe, frontal lobe, parietal lobe
INTRODUCTION
Speech biomechanics produce acoustic, optical, and bio‐mechanical physical phonetic speech signals, and each can suffice to support speech communication and language development [Andersson and Lidestam,2005; Auer et al.,2007; Bernstein et al.,2000; Chomsky,1986]. Of course, purely auditory speech stimuli are commonly thought to be normative for speech perception. Speech perception via the somatosensory system alone is unusual but has been demonstrated in some prelingually deaf and blind individuals [Chomsky,1986; Reed,1995]. Effective, purely visual speech perception (also known as lipreading or speechreading) is prevalent in individuals with prelingual deafness and reliance on spoken language [Andersson and Lidestam,2005; Auer and Bernstein,2007; Bernstein et al.,2000; Mohammed et al.,2005]. The existence of individuals whose speech perception relies on vision, or somatosensation, suggests that speech perception is not a specialization of the auditory system per se. Here, we focus on how visual phonetic information is processed in individuals with normal perceptual experience. How the brain processes visual‐only speech information is a fundamental question whose answer contributes to a general understanding of the neural mechanisms supporting human communication. To be clear, what is of interest here is how the linguistically relevant visual description of speech gestures is processed, not how higher‐level linguistic attributes of speech such as meaning or syntax are achieved.
On theoretical and empirical grounds, several alternative processing pathways have been proposed for visual phonetic cue integration, that is, for sites concerned with the description of visible speech cues. Under the classical view that several of the bottom‐up synaptic levels of the sensory cortices are unisensory [Jones and Powell,1970; Mesulam,1998], the bottom‐up phonetic integration of linguistically relevant visual speech cues would be carried out within the late vision system, likely in posterior temporal cortex [Bernstein et al.,2004; Ponton et al.,2009]. Indeed, the V5/MT motion processing area has been implicated in neuropsychological studies [Campbell et al.,1986; Campbell et al.,1997] and in imaging studies of lipreading [Calvert and Campbell,2003; Santi et al.,2003]. The visible configural aspects of speech might be processed by the lateral occipital complex (LOC) [Capek et al.,2008], an area known to be sensitive to image structure [Grill‐Spector et al.,2001]. The fusiform face area (FFA) [Kanwisher et al.,1997] of the posterior fusiform gyrus, particularly in the right hemisphere has been reported to be activated by speech [Calvert and Campbell,2003; Capek et al.,2008]. In the current study, in order to determine whether the FFA, the LOC, and the V5/MT areas contribute to visual phonetic cue processing, functional localizers were used to identify these areas independently from speech stimulus presentation. Activation in response to speech and nonspeech face gestures was then viewed within these regions‐of‐interests (ROIs). We also investigated the superior temporal sulcus (STS), which has been shown to be responsive during lipreading [Calvert and Campbell,2003; Capek et al.,2008; Paulesu et al.,2003; Skipper et al.,2005; Waters et al.,2007] and is also activated by nonspeech face motion [Peelen et al.,2006; Puce et al.,1998; Puce and Perrett,2003] and other types of biological motion [Beauchamp et al.,2003; Bonda et al.,1996; Grossman et al.,2000]. In monkeys, STS responds to visual body, hand, mouth, and eye movement [Oram and Perrett,1994; Perrett et al.,1988].
Alternatively, the linguistically relevant visual description of speech gestures might be generated within the mirror neuron system [Calvert and Campbell,2003; Skipper et al.,2005], a region comprising the inferior frontal cortex and areas in the parietal and temporal cortex [Rizzolatti and Craighero,2004]. Mirror neurons, identified in monkey area F5, discharge both for motor control and for perception of motor behaviors. The monkey area F5 has been identified as homologous to the human inferior frontal cortical area known also as Broca's, and the action‐recognition mechanisms associated with mirror neurons have been hypothesized to be the basis for language development [Rizzolatti and Arbib,1998]. Santi et al. [2003] obtained evidence for activation of Broca's area with visual speech, but Skipper et al. [2005] obtained extremely limited activation for visible speech within the right pars opercularis (po, BA 44), the right homologue to Broca's area.
Yet another possibility is that visual speech cues are not integrated into a visual phonetic description per se but are fed forward into the early bottom‐up auditory pathway, as early as primary auditory cortex (PAC) [e.g., Calvert et al.,1997; Calvert and Campbell,2003; Pekkola et al.,2005; Sams et al.,1991]. Thenceforward, the phonetic stimulus description could be generated as though the stimulus information had been transduced by the peripheral auditory system.
Some evidence from animal studies shows activation from visual stimuli in the region of the PAC (i.e., core, belt, and parabelt) [for reviews see, Driver and Noesselt,2008; Ghazanfar and Schroeder,2006]. But these activations are likely due to modulatory processes rather than stimulus feature integration [Schroeder and Foxe,2002]; and they might be initiated at the STS [Ghazanfar et al.,2005], which is relatively late in the visual processing pathway. Results to date are mixed concerning activation of the PAC in response to visible speech, with some studies reporting activations and other not [Bernstein et al.,2002; Calvert et al.,1997; Campbell et al.,2001; Hall et al.,2005; Pekkola et al.,2005]. But some activations in the belt and parabelt regions of the PAC might be due to auditory imagery [Bunzeck et al.,2005]. Visual speech activation of STG areas beyond the belt and parabelt areas has been more consistently reported [Bernstein et al.,2002; Calvert et al.,1997; Calvert and Campbell,2003; Hall et al.,2005; Paulesu et al.,2003]. However, the function of sites beyond the parabelt during auditory speech perception appears to be higher‐level linguistic structure processing, such as phoneme and word identification [e.g., Binder et al.,2000; Scott et al.,2000,2006]; and thus, those temporal cortex areas would be predicted to be activated by visual speech also, following integration of visual speech features into a phonetic description.
In summary, alternate pathways have been proposed for the bottom‐up processing of visual speech stimuli. This study was designed to localize the cortical site/s of visual phonetic cue integration, that is, sites concerned with the description of visible speech cues.
Methodological Issues
Methodological factors in neuroimaging studies on lipreading have heretofore compromised the ability to isolate activations specifically associated with visual phonetic cue integration. Presentation of linguistic stimulus materials comprising lexical, semantic, and/or syntactic content [Bernstein et al.,2002; Capek et al.,2008; Hall et al.,2005; MacSweeney et al.,2002; Paulesu et al.,2003] results in processing at higher psycholinguistic levels, in addition to phonetic cue processing, which is limited to processing the physical forms of speech. To guard against higher‐level linguistic processing, stimuli are needed comprising linguistically relevant physical stimulus attributes but without syntax, semantics, or lexical properties [Calvert and Campbell,2003; Pekkola et al.,2005; Sadato et al.,2005; Santi et al.,2003]. To fulfill that requirement in this study, the speech stimuli were consonant‐vowel nonsense syllables.
To isolate phonetic cue processing, the experimental design needs to account for irrelevant face and head motion in natural videos. For example, eye movements result in activations in the posterior STS (pSTS) [Puce et al.,1998] that might, for example, be related to gaze following. Natural nonsense syllable stimuli do not control for irrelevant movement. Several studies have contrasted speech and nonspeech face gestures [Calvert et al.,1997; Campbell et al.,2001; Fridriksson et al.,2008]. This study contrasted speech with nonspeech face gestures. But simply contrasting speech with nonspeech does not take into account low‐level visual processing that is specific to either stimulus type. In this study, control stimuli (see Fig. 1) were generated from the speech and nonspeech stimuli by temporally permuting square segments (tiles) of the face. These stimuli were controls for low‐level stimulus characteristics such as the overall stimulus energy, and they also controlled for responses during the one‐back detection task that was used.
Figure 1.
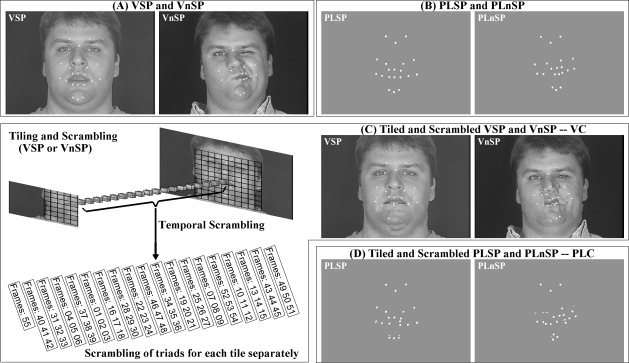
Stimulus generation. (A) Video speech (VSP) and nonspeech (VnSP); (B) Point‐light speech (PLSP) and nonspeech (PLnSP); (C, left) An example of tiling the face into squares, scrambling triads of tiles, and the resultant tiled and scrambled video control (VC) for VSP or VnSP (C, right); and (D) Tiled and scrambled PLSP and PLnSP as point‐light control (PLC).
Faces are complex stimuli, and nonspeech gestures do not control for characteristics such as the talker's expression or gaze. Static face images [Calvert and Campbell,2003; Capek et al.,2008; Pekkola et al.,2005] cannot control for irrelevant characteristics conveyed by motion. Point‐light animations can be used to present relevant biological motion without other natural visual features such as eye gaze [Pelphrey et al.,2004]. Point‐light displays consist of a few dots placed strategically on actors to convey movements (Johansson, 1973). They convey biological motion patterns with little, if any, form information in individual frames and without visual features such as eyes, skin, body structure, clothes, etc. Although suggestions have been made that still images can be recognized as speech [Calvert and Campbell,2003], speech is fundamentally a dynamic stimulus [Jenkins and Strange,1999]. Point‐light speech stimuli enhance the intelligibility of acoustic speech in noise [Rosenblum et al.,1996] and can interfere with audiovisual speech perception when discrepant [Rosenblum and Saldana,1996]. The point data are also highly effective in accounting for the perceptual dissimilarity of visual speech nonsense syllables [Jiang et al.,2007] and the relationship between visual and auditory speech stimuli [Bernstein et al.,2008]. The video speech, nonspeech, and control stimuli here were compared with a parallel set of point‐light stimuli.
This Study
In summary, the speech stimuli were nonsense syllables, because affordance of higher‐level psycholinguistic content would compromise the ability to isolate phonetic processing. Brief nonspeech face gestures were presented to differentiate between linguistic and nonlinguistic responses, also controlling for natural irrelevant face motion. With two parallel stimulus sets (i.e., video and point‐light), converging results could be obtained across stimuli that are natural and complex, versus schematized but clearly recognizable as speech versus nonspeech. In order to further exclude responses that might be nondiscriminating between biological and nonbiological motion, control stimuli were generated by sub‐dividing the images into tiles and randomly permuting the tiles across time. To examine specific candidate visual ROIs for their association with visual speech processing, localizer scans were carried out for the visual areas V5/MT, the LOC, and the FFA. The results support the conclusion that visual phonetic cue integration is carried out within a specific area of the posterior STS and posterior middle temporal gyrus (pSTS/pMTG), anterior to integration of nonspeech visual face cues. We propose that the stimulus conditions presented in this study could be used as an effective localizer for the site of visual speech cue integration, and we suggest, therefore, that there is a temporal visual speech area (TVSA) in the late vision processing pathway.
METHODS
Participants
Twelve adults participated in the experiment (ages, 22–28 years, mean age 26 years; 6 females). All had normal hearing and normal or corrected‐to‐normal vision and were right handed, as evaluated by the Edinburgh handedness inventory. They all reported English as their first and primary language. They were safety screened for MRI and gave informed consent. The experiment was approved by the Institutional Review Boards at the University of Southern California and at the St. Vincent Medical Center.
Stimuli
Speech and nonspeech face motion
All the stimuli were derived from recordings of one adult male producing nonsense syllables and nonspeech face gestures (see Fig. 1 for example frames). Stimuli were recorded using a production quality video camera (Sony DXC‐D30 digital) and video recorder (Sony UVW 1800) at a frame rate of 29.97 Hz, and simultaneously, a three‐dimensional (3D) optical recording system (Qualisys MCU120/240 Hz CCD Imager), which digitally recorded the positions of passive retro‐reflectors at a frame rate of 120 Hz during infrared flashes (not perceptible to the talker). Retro‐reflectors were glued to the talker's face at 17 positions in motion during speech and also three positions on the forehead [Jiang et al.,2007] (see Fig. 1).
The speech syllables were “du,” “sha,” “zi,” “fa,” “ta,” “bi,” “wi,” “dhu” (i.e., the voiced “th”), “ku,” “li,” and “mu”. They were selected because of their mutual dissimilarities [Jiang et al.,2007]. The nonspeech gestures were puff, kiss, raspberry, growl, yawn, smirk, fishface, chew, gurn, nose wiggle, and frown‐to‐smile. The original video recordings in color were transformed to a gray scale. After that, the intensities in each video token were normalized in terms of the mean (0.6) and standard deviation (.09). Video images were 720 × 480 pixels.
To determine the comparability of the motion speed across speech and nonspeech stimuli, histograms were made of the 3D optical retro‐reflector speeds (in degrees/s) for the points used to create the point‐light speech and nonspeech stimuli. The retro‐reflector speed calculation applied constants, that is, screen size, distance from the mirror to the screen, and image size, to obtain the angle of visual change per retro‐reflector point per second. Figure 1 in the Supporting Information online figures shows the frequencies of occurrence (binned) of speeds across all of the retro‐reflectors and frame‐to‐frame transitions for speech and nonspeech stimuli. The figure shows that the speech speeds were generally comparable with the nonspeech speeds and were mostly in the range of 1–9 degrees/s.
The original Qualisys 3D optical data were rendered into synthetic video after down‐sampling to the video frame‐rate. That is, they were transformed into point‐light stimuli, by projecting positions of 3D data point into a two‐dimensional picture plane (480 × 720 pixels). The first step in this process involved choosing a representative video frame for each stimulus token. Then, the individual frames of 3D data were rotated, translated, and scaled, such that each retro‐reflector position was projected onto the same two‐dimensional view in the representative video frame. This process was performed once per stimulus so as to preserve accurately the original gestural motion but maintain the head in a constant position. The visible rendered points were based on one small retro‐reflector image extracted from a video frame. The background intensity for point‐light stimuli matched that of the video stimuli.
Because the natural speech and nonspeech gestures were of somewhat different durations, the first frame of some stimuli was repeated so that individual stimuli were all 55 frames in duration. An 11‐frame segment of blank video with mean intensity of 0.6 was placed before each token, resulting in 2.2‐s stimulus intervals.
Control stimuli were created separately. Control stimuli were the result of processing tokens from the stimulus set. The face area focused around the mouth and jaw was divided into 100 (10 × 10) square tiles (see Fig. 1C). The order of frames within each tile was scrambled across sequential temporal groups comprising three frames for 54 frames, and the 55th frame was randomly assigned (Fig. 1C). Using this scheme, the stimulus energy/luminance of the original stimuli was maintained. The resulting video control stimuli had the appearance of a face with square patches of unrelated movement. The resulting point‐light control stimuli had the appearance of uncoordinated dot motion. After scrambling the tiles, identification of the stimuli as speech or nonspeech was no longer possible. Therefore, the control stimulus blocks comprised both scrambled speech and nonspeech tokens, while holding media (video or point‐light) constant. Per control block, five tokens were speech and five were nonspeech.
Six blocks comprised the fully crossed factors of media (video, point‐light) and condition (control, speech, nonspeech). With 10 stimuli per block, blocks were 22 s in length. The stimuli for each scan comprised 18 blocks (6 condition blocks, repeated three times in pseudo‐random order), 6 min 36 s total (22 s × 6 conditions × 3 repeats = 396 s), presented as one continuous video. Each block had a unique sequence of stimuli. The stimuli were transferred to a DVD for presentation during scanning. They were displayed to the subjects during the fMRI experiment using a laptop computer and Christie DLV 1280‐DX projector. The screen, with a resolution of 1024 × 768, was behind the participant's head and was viewed via a mirror with room lights off during scanning. The display on the screen was approximately 34.5 cm × 26 cm. The viewing distance was about 80 cm.
Localizer stimuli
Localizer stimuli were created using MATLAB and generated by a PC. The localizer for the lateral occipital complex (LOC) and the fusiform face area (FFA) comprised stationary images within the same scan. The stimuli were faces, scenery, single objects, and scrambled objects. Each image was shown for 0.5 s, and there were 48 stimuli per block, with each condition block repeated four times [(48 stimuli × 0.5 s × 4 blocks × 4 repeats) + 8‐s blank fixation in the beginning = 392 s].
A V5/MT localizer comprised 12‐s blocks in which a circular gradient expanded or contracted for 4 s, followed by a block in which the circular grating was stationary for 12 s. Each condition block was repeated 16 times [(12 s × 2 blocks × 16 repeats) + 8‐s blank fixation in the beginning = 392 s].
Procedure
All of the participants received a lipreading screening test [Auer and Bernstein,2007]. Video recordings of 15 sentences spoken by a man and 15 by a woman were presented to each participant without sound. The order in which the two sets of sentences were presented was randomized across participants. Following each sentence, the participants typed on a computer what was said in the video. Responses were scored for percent words correct. Participants' performance varied considerably (mean number of correct words: 38; range from 6 to 79 words), but no one was excluded from the study on the basis of the lipreading test.
Five separate scans were obtained, the first an anatomical MPRAGE scan, followed by functional scans using block designs. The second and third scans comprised the main experiment with speech and nonspeech stimuli. The FFA and LOC ROIs were derived using the same scan. The fourth and fifth scans were the V5/MT localizer scans, and the FFA and LOC localizer scans, respectively. All of the scans were obtained in the same session, except for one participant, for whom the two functional localizer scans were recorded in a later session due to a scanner problem. For that participant, two MPRAGE scans were recorded, one in each session.
During the main speech functional scans, two complete block orders were used, one a reversal of the other. Orders were counterbalanced across gender. A one‐back task was used to maintain participants' attention. Participants were instructed to press a button every time a stimulus was immediately repeated. In every block, one to three tokens were randomly chosen to be repeated. During the localizer scans, participants fixated on the center of the image and passively viewed the stimuli.
Imaging Parameters
Imaging was carried out in the Dana & David Dornsife Cognitive Neuroscience Imaging Center at the University of Southern California using a Siemens 3.0T MAGNETON Trio MRI system with TIM (Siemens Medical Systems, Erlangen, Germany). A localizer scan comprising five sagittal, one axial, and one coronal slice (22 s; TE/TR, 5/20 ms; flip angle, 40°; in‐plane resolution, 1.5 × 1.5 mm2; FOV, 280 × 280 mm2) was obtained to define 3D anatomical positions and slice positions for the functional scans. High‐resolution T1‐weighted 3D anatomical volumes were acquired for each participant with an MPRAGE sequence (TE/TR, 4.13/2,350 ms; flip angle, 7°; 192 sagittal slices; matrix size, 256 × 256; voxel size, 1 × 1 × 1 mm3; FOV, 256 × 256 mm2; slice thickness, 1 mm; slice spacing, 0 mm).
Video and point‐light functional scans used T2*‐weighted functional images with an echo‐planar imaging (EPI) sequence (TE/TR, 30/2000 ms; flip angle, 90°; matrix size, 64 × 64; in‐plane resolution, 3 × 3 mm2; slice thickness, 4 mm; slice spacing, 0 mm; FOV, 192 × 192 mm2). Each functional volume comprised 29 adjacent transversal slices that roughly covered the whole brain.
ROI scans used T2*‐weighted functional images with an EPI sequence (TE/TR, 30/1,000 ms; flip angle, 65°; matrix size, 64 × 64; in‐plane resolution, 3 × 3 mm2; slice thickness, 3 mm; slice spacing, 0 mm; FOV, 192 × 192 mm2). Each functional volume comprised 14 adjacent axial slices oriented approximately with the AC‐PC line as the superior slice, roughly covering the temporal lobe.
DATA PROCESSING
Anatomical Volumes
To correct for spatial variation in MRI intensities and to normalize across subjects, anatomical volumes were first inhomogeneity corrected using a polynomial fitting algorithm and were then transformed into the Talairach coordinate system using BrainVoyager QX 1.9.10 (Brain Innovation, Maastricht, The Netherlands). FreeSurfer 4.0.1 [Fischl et al.,1999a,b] with default parameters was used to perform the intensity‐based automatic cortex segmentation upon each participant's normalized volume. The procedure created the right and left cortical surfaces based on the gray‐white matter boundary. The midcortical surface, an average of the white‐matter and pial surfaces, was used for registration and displaying results.
Cortical Registration
An extensive analysis of cortical surface registration methods was undertaken separately with the anatomical data from this study in order to select an accurate registration method [Pantazis et al.,2010]. Pantazis et al. developed a cortical delineation protocol consisting of 26 relatively consistent cortical landmarks spanning the entire cortical surface. They compared the registration performance of a landmark‐based cortical surface registration method against those of two automatic methods and found that the manual registration was superior to the automatic methods. The landmark‐based cortical registration method was used here and the details can be found in Pantazis et al. Briefly, 26 landmarks were traced for each cortical surface using the software BrainSuite [Shattuck and Leahy,2002]. The curves were validated and corrected whenever necessary by an expert neuroanatomist (Hanna Damasio). In a few cases, for which some of the sulci were missing or could not be identified, only the remaining landmarks constrained the registration. After tracing, the manual registration procedure described in Joshi et al. [2007] using default parameters was used to map all surfaces to a target participant, separately for the left and right hemispheres. For the alignment, each target surface (left and right separately) was resampled to have 40,962 vertices appropriate for BrainVoyager (i.e., they were morphed with distortion correction onto a spherical surface; resampled into a regular/standard sphere; and mapped back into the folded form). Consequently, a mapping vector was obtained for each cortical surface.
Functional Data Preprocessing
During data acquisition, real‐time motion correction was applied to the functional data using 3D‐PACE (Siemens). Additional, offline motion correction with 3D, rigid‐body‐transformation, using the first volume as reference, was performed after slice‐timing correction in preprocessing. The data were filtered in the temporal domain for linear trend removal and high‐pass filtered with a cutoff frequency of three cycles per run. Each EPI scan for each participant was coregistered to the same‐session high‐resolution structural data. For the one participant who was run in two sessions, automatic 3D to 3D coregistration was applied to coregister the scans in the second session to the structural data recorded in the first session. The resulting functional‐to‐structural transformation matrices, together with Talairach transformation matrices, were used to warp the functional data into Talairach space.
The normalized 3D functional data were subsequently recomputed along the mesh surfaces using BrainVoyager (40962 vertices; summarizing activation from −2 mm to 2 mm around the approximate midcortical surface). The surface‐based functional data were then aligned using the mapping vectors from the registration program.
Functional Data Analyses
First‐level functional analyses involved z‐transformation of the BOLD signals, followed by application of the GLM (general linear model) to obtain Beta values. The GLM analyses used the difference of Gamma to model the BOLD response (BrainVoyager default). For GLM analyses involving data from more than one participant, the functional data were whitened by serial‐correlation removal. These analyses were performed using activations from surface‐based alignment for the whole‐brain analyses and from volume‐based alignment for the ROI analyses. For the whole‐brain analyses, the target cortical surfaces were inflated and smoothed to allow visualization of activity in the folded cortical areas, with the cluster size threshold set at 25.
Whole‐Brain Functional Data Analyses
Whole‐brain analyses used a random‐effects GLM to model the results from speech, nonspeech, and control stimuli (i.e., VSP, video speech; VnSP, video nonspeech; VC, video control; PLSP, point‐light speech; PLnSP, point‐light nonspeech; PLC, point‐light control), separately for each hemisphere. ANCOVA was carried out on the obtained Beta values for media (video and point‐light) and condition (speech, nonspeech, and control) as within‐subjects factors. Then second‐level analyses evaluated activation levels between conditions. Four basic contrasts were evaluated (df = 22), VSP > VC, VnSP > VC, PLSP > PLC, and PLnSP > PLC. The threshold significance level was set using the false discovery rate (FDR) of 0.001. FDR was computed using a custom MATLAB program based on Genovese et al. [2002]. Subsequently, conjunction analysis (logical AND; see [Nichols et al.,2005]), was applied to determine the common activations for speech, independent of media (VSP > VC and PLSP > PLC), and nonspeech, independent of media (VnSP > VC and PLnSP > PLC). The direct contrasts of speech versus nonspeech were also analyzed (df = 22) (VSP > VnSP and PLSP > PLnSP) with an uncorrected threshold P‐value of 0.001. For these two contrasts, a mask that preserved only the significant positive activations from the corresponding basic contrasts was used, and therefore a correction for multiple comparisons was not applied [Beauchamp,2005b]. The conjunction analyses of speech and nonspeech activations independent of media were also carried out on individual participant data. The fixed‐effects GLM was applied to the two runs from each participant with an uncorrected threshold P‐value of 0.001 for each contrast (VSP > VC, VnSP > VC, PLSP > PLC, or PLnSP > PLC). Anatomical regions were identified and named using the conventions in Damasio [2005].
Localizers and ROIs Analyses
To identify ROIs for each participant, a single‐study (single‐scan) GLM was performed. Then second‐level contrast analyses were carried out, using the obtained Beta values to identify the active cortical areas for LOC (faces + scenery + single objects >3 × scrambled objects), FFA (3 × faces > scenery + single objects + scrambled objects), and V5/MT (moving > stationary) with an uncorrected threshold P‐value of 0.001. The ROIs were subsequently manually selected in BrainVoyager to obtain contiguous supra‐threshold voxels constrained to be within a 30 × 30 × 30 mm3 volume in each hemisphere.
In order to evaluate the responses in the ROIs for the speech, nonspeech, and control conditions in video and point‐light media, a random‐effects GLM was used to extract the BOLD activation levels for each condition for each voxel. The resultant Beta values within each ROI were averaged per participant per hemisphere, resulting in a 12 × 36 activation matrix (12 participants; 6 stimulus conditions × 3 ROIs × 2 hemispheres), which was analyzed with SPSS (SPSS, 2006). Omnibus repeated measures analysis of variance was carried out with media (video and point‐light) and condition (speech, nonspeech, and control) as within‐subjects factors for each ROI (LOC, FFA, and MT), separately for each hemisphere.
RESULTS
Behavioral
Participants performed a one‐back task for stimulus repetitions in speech, nonspeech, and control conditions, and their responses were converted to d' sensitivity and bias values [Macmillan and Creelman,2005]. Repeated measures analyses of variance were carried out separately for d' and bias, with stimulus condition (speech, nonspeech, and control) and media (point‐light and video) as within‐subjects factors, and lipreading score as a covariate to statistically control for lipreading ability. Bias did not vary across conditions or media. The only significant main effect was d' for condition [F (2, 20) = 9.956, P = 0.001; mean d' control = 1.9; mean d' speech = 2.2; mean d' nonspeech = 3.5]. In simple comparisons, d' with nonspeech was higher than with control [F (1, 10) = 15.966, P = 0.003] and higher than with speech [F (1, 10) = 15.966, P = 0.003]. The sensitivity to speech and control was similar.
Whole‐Brain Results for Speech and Nonspeech Stimuli Versus Controls
The whole‐brain results for speech and nonspeech, each contrasted with the tiled control condition within media (point‐light versus video), are shown in Figure 2. Numerous common activations were obtained across stimulus conditions and media. However, the point‐light activations were generally in fewer locations and less extensive, an anticipated result, because the point‐light stimuli are less informative than the video stimuli. That the point‐light activations were a subset of the video activations is consistent with the vividness of the percept with these stimuli [Grossman and Blake,2002]. That the activations were so extensive despite being compared with the scrambled controls supports that the activated areas in Figure 2 were involved in more than the mere perception of motion.
Figure 2.
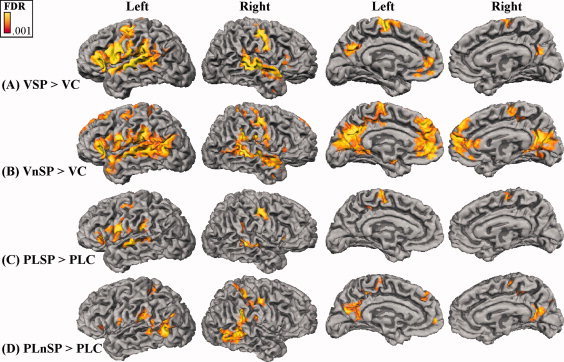
Whole‐brain activations projected onto the folded cortical surface, with the FDR threshold = 0.001, and cluster size = 25. A: VSP contrasted with its control, VC. B: VnSP contrasted with its control, VC. C: PLSP contrasted with its control, PLC. D: PLnSP contrasted with its control, PLC. (VSP, video speech; VnSP, video nonspeech; VC, video control; PLSP, point‐light speech; PLnSP, point‐light nonspeech; PLC, point‐light control).
Speech and nonspeech gestures were generally associated with more extensive activation of the left than of the right hemisphere, except for the point‐light nonspeech stimuli, for which the lateral activity on the right was more extensive than that on the left. Nonspeech stimuli were associated with the most posterior activations and with the more extensive mesial activations. The nonspeech stimuli activated bilateral pSTS near the junction of the STS and the inferior temporal sulcus, as was expected given previous research on nonspeech biological motion with humans [Beauchamp et al.,2003; Grossman and Blake,2002; Puce and Perrett,2003; Puce et al.,2003] and with monkeys [Oram and Perrett,1994; Perrett et al.,1985]. However, the speech stimuli did not activate those pSTS areas above the level of the control stimuli.
Localizer Results
To view the possible contributions to speech and nonspeech processing from the visual areas V5/MT, FFA, and LOC, repeated measures analyses of variance were carried out for each ROI and hemisphere using mean Beta values, with media and condition as within‐subjects factors. The bar graphs in Figure 3 summarize the results. Because a blank screen baseline was not used, the graphed values are relative to each other.
Figure 3.
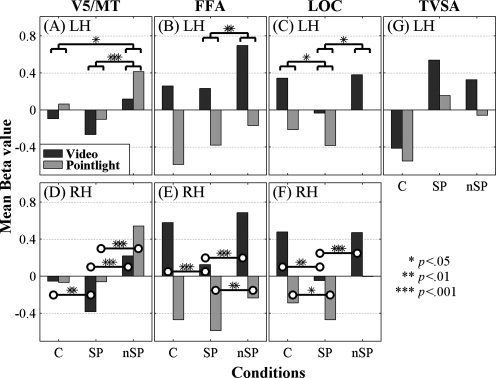
Mean relative activations for video and point‐light in the ROIs for the left hemisphere (LH) in (A) V5/MT, (B) FFA, and (C) LOC, and for the right hemisphere (RH) in (D) V5/MT, (E) FFA, and (F) LOC. Simple contrasts with Bonferroni corrections on the main effects of condition and their levels of significance (A, B, C). Paired‐t tests on the interactions and their levels of significance (D, E, F). Activations extracted from the TVSA are shown in (G) without statistics. (Note x‐axis labels: C, control; SP, speech; nSP, nonspeech).
V5/MT
On the left (Fig. 3A), the main effects of media [F (1, 11) = 5.079, P = 0.046] and condition [F (2, 22) = 11.446, P = 0.000] were reliable, but their interaction was not. Bonferroni‐corrected paired comparisons for condition showed that responses in the control and speech blocks were similar, but responses to nonspeech stimuli were greater than to speech (P = 0.000). Left V5/MT also preferred nonspeech to control stimuli (P = 0.031).
On the right (Fig. 3D), media was not a reliable main effect (P > 0.05), but condition [F (1, 11) = 46.538, P = 0.000] was. The interaction of media and condition [F (2, 22) = 8.644, P = 0.002] was also reliable. Responses in the point‐light control and speech blocks were similar. But the right V5/MT preferred point‐light nonspeech to speech [paired t (11) = 9.247, P = 0.000]. Responses to the video speech were lower than to control [paired t (11) = 3.128, P = 0.010] and lower than to nonspeech stimuli [paired t (11) = 8.254, P = 0.000].
FFA
In FFA, in both hemispheres, activation was higher with video than with point‐light stimuli. On the left (Fig. 3B), the main effects of media [F (1, 11) = 127.570, P = 0.000] and condition [F (2, 22) = 14.919, P = 0.000] were reliable, but their interaction was not. Bonferroni‐corrected paired comparisons showed no difference between control and speech but reliably lower speech than nonspeech activations (P = 0.002).
On the right (Fig. 3E), media [F (1, 11) = 80.358, P = 0.000], condition [F (2, 22) = 11.028, P = 0.000], and their interaction [F (2, 22) = 7.286, P = 0.004] were reliable. Video speech activation was lower than video control [t (11) = 4.608, P = 0.001], and lower than nonspeech [t (11) = 6.723, P = 0.000]. Point‐light activation speech and control activations were not different (P > 0.05), but point‐light speech was lower than nonspeech [t (11) = 3.614, P = 0.004].
LOC
In LOC, activation was higher with video than with point‐light stimuli. On the left (Fig. 3C), the main effects of media [F (1, 11) = 28.480, P = 0.000] and condition [F (2, 22) = 11.174, P = 0.000] were reliable, but their interaction was not. Bonferroni‐corrected paired comparisons showed that the left LOC preferred control stimuli (P = 0.026) and nonspeech stimuli (P = 0.002) in contrast with speech.
On the right (Fig. 3F), media [F (1, 11) = 39.074, P = 0.000], condition [F (2, 22) = 18.563, P = 0.000], and their interaction [F (2, 22) = 6.051, P = 0.008] were reliable. Video speech activation was lower than control [t (11) = 4.528, P = 0.001] and lower than nonspeech activation [t (11) = 5.363, P = 0.000]. Point‐light speech was lower than control [t (11) = 2.987, P = 0.012] but not reliably different from nonspeech activation (P = 0.059).
Additional ROI Analyses
Although the control stimuli presented high motion speeds and incoherent motion, a striking result across ROIs was the general pattern of reduced response with speech relative to nonspeech and control stimuli. Greater activation to nonspeech stimuli could possibly be attributed to higher motion speeds at rates more compatible with visual area processing preferences, in the range of 4 to 16 degrees/s [Chawla et al.,1999]. Therefore, additional analyses were carried out.
The method used to obtain retro‐reflector speeds for Figure 1 in the Supporting Information online figures was applied to obtain mean retro‐reflector speed per stimulus. In the Supporting Information online Figure 2, mean speech stimulus speeds are shown to have been relatively uniform and in the range of 0.73 to 1.79 degrees/s. Mean nonspeech stimulus speeds were, with the exception of one stimulus, within the similar range of 0.72 to 2.05 degrees/s: However, the gurn stimulus mean speed was almost 4 degrees/s. In a run for which there were three unique nonspeech blocks per media type, the gurn was presented once in one of the blocks and twice in another. To determine whether the gurn was responsible for the pattern of nonspeech preferences in the ROIs, the nonspeech blocks were separated into ones with gurns versus ones without, and the ROI analyses were rerun (see Supporting Information online Fig. 3).
In V5/MT, reliable increases in activation for nonspeech versus speech stimuli were present, even without the gurn stimulus. The left FFA results suggested that the greater activation for nonspeech stimuli did depend on the inclusion of the gurn stimulus. On the right and with video stimuli, the higher activation in FFA activation did not depend on the gurn. However, with point‐light stimuli the gurn and nongurn stimuli differed, and the contrast with speech was reliable only when the gurn was included in the contrast. The results for the LOC showed a similarly complex pattern. Bilaterally, the activation was higher for video nonspeech, without the gurn. But the point‐light speech differed only with the nonspeech blocks with gurns. Overall, the pattern of results, independent of the inclusion of the gurn stimulus, suggests that nonspeech activates V5/MT more strongly than speech. FFA and LOC are more strongly activated by video nonspeech and by point‐light nonspeech that includes gurns. Interestingly, gurning has been considered a very good control stimulus for speech motion [Calvert et al.,1997; Hall et al.,2005; MacSweeney et al.,2002], yet from the perspective of controlling for speed across stimulus types, here it produced a complex pattern of results likely due to its more extreme motion characteristics.
Activations Independent of Media in Group Analyses
Logical conjunctions [Nichols et al.,2005] were computed on the whole‐brain results from the main experiment in order to isolate activation due to speech versus nonspeech stimuli, independent of media (i.e., natural video vs. point‐light). Activations associated with the video speech were contrasted with activations for the video control, as were activations for video nonspeech stimuli; and activations associated with the point‐light video speech were contrasted with activations for the point‐light control, as were activations for the point‐light nonspeech. Then the supra‐threshold results were projected onto the cortical surface (see Fig. 4). Because point‐light stimuli presented primarily motion information, little configural information, and no other information about the face, responsive areas in these conjunctions are interpreted as the areas most concerned with processing the phonetic and nonspeech gestural information.
Figure 4.

Group conjunction analyses for speech and non‐speech activations independent of media (i.e., video and point‐light). Activations in red are speech greater than the relevant control, independent of media. Activations in green are nonspeech greater than the relevant control, independent of media.
Left Hemisphere
Table I lists the anatomical locations of activations that were suprathreshold in the conjunction analyses. Speech activations were obtained in the temporal lobe (STG, STS, MTG), the parietal lobe (inferior parietal lobe/supramarginal gyrus, IPL/SMG; inferior postcentral sulcus, postCS), and the frontal lobe (pars orbitalis, porb; Broca's area ‐ pars opercularis, po; inferior and superior precentral gyrus, preCG). Nonspeech activations were obtained in the temporal lobe (MTG, STS), the parietal lobe (IPL/SMG; the superior parietal lobe, SPL), and the frontal lobe (porb, preCG). Mesial responses were almost exclusively to nonspeech, except for the mesial central sulcus (CS) responses.
Table I.
Cortical areas activated in response to speech or nonspeech gestures, independent of media (i.e., video or point‐light)
| Hemisphere | mSTG/ mSTS | pSTS/ pMTG | mMTG | pMTG | IPL/ SMG | Inf postCS | Inf/Sup preCG | SPL | porp | po | mesCS | SFG | FP | pCingS | preCun/ rSP |
|---|---|---|---|---|---|---|---|---|---|---|---|---|---|---|---|
| Speech | |||||||||||||||
| LH | √ | √ | √ | √ | √ | √ | √ | √ | |||||||
| RH | √ | √ | √ | √ | √ | √ | √ | ||||||||
| Nonspeech | |||||||||||||||
| LH | √ | √ | √ | √ | √ | √ | √ | √ | √ | √ | √ | √ | |||
| RH | √ | √ | √ | √ | √ | √ | √ | √ | √ | √ | √ | ||||
pCingS, posterior cingulate sulcus; FP, frontal pole; IPL, inferior parietal lobe; mesCS, mesial central sulcus; mMTG, middle middle temporal gyrus; mSTG, middle superior temporal gyrus; mSTS, middle superior temporal sulcus; postCS, postcentral sulcus; po, pars opercularis; porb, pars orbitalis; preCG, precentral gyrus; preCun, precuneus; pMTG, posterior middle temporal gyrus; pSTS, posterior superior temporal sulcus; rSP, retrosplenial area; SFG, superior frontal gyrus; SMG, supramarginal gyrus; SPL, superior parietal lobe; rSP, retrosplenial area.
Right Hemisphere
Suprathreshold speech activations were in the mSTG/mSTS, IPL/SMG, the preCG, the porb, the postCG, and the mesial CS (see Table I). Activations associated with nonspeech were obtained in the right mSTG/mSTS, pSTS, pMTG, IPL/SMG, inferior postCS, preCG, SPL, and mesially, the CS, CingS, and preCun/rSP.
Activations Independent of Media in Individual Participant Analyses
Because of the possibility that the group conjunction analyses prevented us from seeing individual participant activation patterns, consistency was analyzed. Supporting Information online Figure 4 shows, per voxel, the number of participants with suprathreshold activation in the group conjunction analyses with alignment in group space. The results suggest that individual activations might not be well‐represented by the group analyses. Therefore, analogous to the group conjunction analyses, individual participant conjunction analyses were carried out, and the results were projected onto the individuals' own anatomical scans (see Fig. 5, and the right hemisphere Supporting Information online Fig. 5). Supporting Information online Figure 7 shows the individual TVSA ROIs that were manually selected based on the individual conjunction analyses.
Figure 5.

Individual participant conjunction analyses for speech and nonspeech left‐hemisphere activations independent of media (i.e., video and point‐light). Activations in burgundy are speech greater than the relevant control, independent of media. Activations in green are nonspeech greater than the relevant control, independent of media. Each individual's lipreading screening (ls) score is noted.
The individual results did not support the hypothesis that visual speech perception relies on the primary auditory cortex: No activation was suprathreshold for Heschl's gyrus in right or left hemispheres. Nor were the results in support of the mirror neuron hypothesis: Only four out of 12 left hemispheres demonstrated activation in Broca's area (po) or its right homologue. However, 10 out of 12 left hemispheres showed activation of the pSTS and/or the pMTG in response to speech, a result that is consistent with the hypothesis that this late vision area integrates the visual speech cues. The individual analyses provide good evidence for specificity [Kanwisher et al.,1997] of speech versus nonspeech activations: nonspeech activations were mostly distinct and posterior to speech activations. However, the individual results demonstrate considerable posterior anatomical variation in locations responsive to speech versus nonspeech.
General Discussion
This study was carried out in order to localize visual phonetic integration, that is, to localize the area/s in the bottom‐up lipreading pathway that are responsible for generating linguistically relevant descriptions of visual speech cues. Analyses of activations within the functionally defined FFA, LOC, and V5/MT ROIs disclosed significantly less activation for speech relative to nonspeech and control stimuli, thus, removing these sites as ones specialized for phonetic cue integration. In group analyses, activation to speech and to nonspeech gestures was obtained in the bilateral posterior STS and MTG, but the activations to nonspeech extended more posteriorly than activation to speech. In individual analyses, distinct activations were obtained in the posterior STS and MTG for visual phonetic processing contrasted with nonspeech processing in an area we call the TVSA. We suggest that TVSA integrates phonetic visual cues and projects phonetic representations anteriorly to areas that are also responsive to auditorily perceived speech segments (consonants and vowels) [Benson et al.,2006; Binder et al.,2000; Liebenthal et al.,2005; Scott et al.,2006].
To demonstrate specificity for speech activations in the TVSA, the manually labeled TVSA ROIs were used to extract the mean activations due to control, speech, and nonspeech across video and point‐light stimuli. Figure 3G shows the results without statistical analyses and for only those 10 participants for whom a TVSA could be identified. Additional studies with independent data [Kriegeskorte et al.,2009; Vul et al.,2009] are needed to assess statistically the specificity [Kanwisher et al.,1997] of the TVSA. Nevertheless, Figure 3G demonstrates that activations were approximately twice the value to speech than to nonspeech in video and approximately three times the value to speech than to nonspeech in pointlight, consistent with previously reported examples of stimulus specificity [Downing et al.,2001; Kanwisher et al.,1997].
Visual Speech Processing Pathway
Three alternate hypothetical pathways for visual phonetic cue processing were outlined in the introduction. One was that visual phonetic cues are not integrated into a visual phonetic description per se but are fed forward into the early bottom‐up auditory pathway, possibly as early as PAC [Calvert et al.,1997; Calvert and Campbell,2003; Pekkola et al.,2006; Sams et al.,1991], after which they are processed as though they were auditory phonetic cues. This hypothesis implies that visual phonetic specialization will not be found upstream in visual cortical areas. A second hypothesis was that the phonetic cues are integrated within the mirror neuron system [Calvert and Campbell,2003; Skipper et al.,2005], a region comprising the inferior frontal cortex and areas in the parietal and temporal cortex [Rizzolatti and Craighero,2004]. The third hypothesis was that the integration of sensory input is in the late vision processing pathway [Bernstein et al.,2004; Ponton et al.,2009].
With regard to the first hypothesis, supra‐threshold activation of the PAC region, including Heschl's gyrus, was not obtained in this study. The human PAC appears to be organized similarly to that of the macaque, with a core, surrounded by a belt, which is surrounded by a parabelt [Kaas and Hackett,2000]. In primates, the input from the ventral medial geniculate body (vMGB) activates the core areas of auditory cortex. Core areas activate the numerous belt areas, which in turn activate the parabelt areas. However, direct projections from the MGB to the belt areas in primates appear to modulate rather than activate [Eggermont,2001]. The mSTG and middle dorsal bank of the STS are thought to be homologous to the monkey parabelt area [Uppenkamp et al.,2006]. In monkey caudal PAC, some neurons respond more strongly to auditory stimuli in the context of visual stimuli, and there are discernable supra‐threshold responses to visual stimuli alone; but visual stimuli mostly result in a modulation of auditory activations in the caudal core and belt of auditory cortex [see also, Cappe et al.,2009, 2008]. Although speech stimuli were associated with activation in middle STS/STG in this study, there was not evidence that these activations were a consequence of PAC area activation.
The second hypothetical pathway is within the mirror neuron system [Calvert and Campbell,2003; Rizzolatti and Craighero,2004; Skipper et al.,2005]. Activation in po (Broca's area) was obtained in the group conjunction analysis (see Fig. 4) but inconsistently in the individual analyses (see Fig. 5). In direct comparisons between speech and nonspeech in video separately from pointlight, po activity was obtained only with video stimuli (see Supporting Information online Fig. 6). Inferior frontal activity is associated with interpretation or speech category identification, which is easier with the higher information content of video speech. Auditory phonological processing tasks, including tasks related to explicit working memory, activate po [Poldrack et al.,1999; Vigneau et al.,2006]. In Hasson et al. [2007], reduced activation in frontal cortical regions was considered evidence for abstract coding, when audiovisual physical speech stimuli varied but perception was similar. In that study, an area of left po localized with visual speech stimuli showed reduced activation under conditions of similar perception but different stimuli, consistent with a category processing role for left po. Thus, the current results are more consistent with ones that assign a higher level of psycholinguistic processing, beyond visual phonetic cue integration, to frontal cortex.
Finally, the hypothesis that phonetic sensory input is integrated by late vision, that is, a region in left pSTS/pMTG‐the TVSA‐does receive support. Group and individual results showed patches of cortex that responded significantly more to visual speech than to nonspeech stimuli. We suggest that the stimulus conditions presented in this study were an effective localizer for the site of visual phonetic cue integration.
While previous studies reported posterior temporal activations with visual speech [Bernstein et al.,2002; Calvert and Campbell,2003; Capek et al.,2008; Hall et al.,2005], the design of those studies precluded precision in defining the area's function. By comparing nonsense syllable speech and nonspeech face motion under video and point‐light conditions, relative to tiled control stimuli, the likelihood was increased here that sites of phonetic cue integration would be localized. Individual conjunction analyses (Fig. 5 and Supporting Information online Fig. 5) and extracted activations (Fig. 3G) suggest there to be cortical specificity [Kanwisher et al.,1997] between speech and nonspeech processing areas. However, the claim is not that the TVSA is responsible for categorizing visual speech information: The claim is that TVSA provides a linguistically relevant integration of cues that is projected for categorization by other areas [c.f., Pelphrey et al.,2005; Thompson et al.,2007], specifically, the more anterior mSTG/mSTS area previously identified as having a role in auditory speech perception [Benson et al.,2006; Binder et al.,2000; Liebenthal et al.,2005; Scott et al.,2006].
Relationships to Auditory Phonetic Perception
The left mSTG/mSTS was activated by visual speech. Previous research on auditory speech and complex auditory nonspeech perception suggest that the left mSTG/mSTS analyzes complex sounds and vocalizations [Benson et al.,2006; Binder et al.,2000; Liebenthal et al.,2005; Scott et al.,2006]. The more dorsal temporal cortex, including Heschl's gyrus, the planum temporale, and the adjacent STG, is responsive to both speech and nonspeech complex sounds [Binder et al.,2000; Scott et al.,2000; Scott et al.,2006]. Consensus has not been achieved regarding whether left mSTG/mSTS is responsible for auditory phonetic descriptions or for abstract phoneme categorizations [Benson et al.,2006; Binder et al.,2000; Liebenthal et al.,2005; Obleser et al.,2007; Scott et al.,2006]. The left mSTS has been shown to be more responsive to speech phoneme categories than to complex nonspeech sounds and, therefore, might be specifically involved in speech phoneme categorization [Liebenthal et al.,2005; Obleser et al.,2007; Scott et al.,2006]. The left mSTG/mSTS visual speech activation shows that the area is not specific to complex auditory stimulus processing. Furthermore, if TVSA is responsible for phonetic integration, then category processing in mSTG/mSTS for visual speech would be consistent with some of the results for auditory speech. Given that the speech stimuli were easily recognized as speech, and all of the participants performed the one‐back task adequately, a possibility is that recognizing the stimuli as speech is sufficient to activate the mSTS/mSTG. However, common activation by auditory and visual phonetic input does not necessitate that representations are amodal [c.f., Rosenblum,2008]: Modality‐specific auditory and visual representations can intermingle in the same region [Meredith,2002].
Individual Differences
The individual conjunction analyses (see Fig. 5) and the consistency analyses (Supporting Information online Fig. 5) show that the TVSA anatomical locations vary across individuals. Supporting Information online Figure 7 shows the individual TVSA ROIs that were manually selected based on the individual conjunction analyses. If these ROIs are accurate, and if phonetic processing is related to lipreading performance [Bernstein et al.,2000], activation in TVSA should be related to lipreading performance. Lipreading ability varies greatly in both deaf and hearing populations [Auer and Bernstein,2007; Bernstein et al.,2000; Mohammed et al.,2005]. If a sample comprises variation among lipreaders, that variation could assist in identifying cortical areas that are relevant to lipreading skill. Hall et al. [2005] reported a positive correlation between left STG activation and sentence lipreading, but that correlation could be ascribed to higher‐level psycholinguistic sentence processing subsequent to phonetic perception. Paulesu et al. [2003] reported negative correlations between a word lipreading task and activation in left temporal and frontal cortices, but again the lexical stimulus content precludes inferences concerning phonetic cue processing.
Here, in order to explore the results further, we obtained the mean activations for speech versus control and nonspeech versus control in the TVSA ROIs and correlated them with lipreading scores. However, the results are considered extremely preliminary due to the nonindependence of the ROI selection versus the activations that entered the correlation [Kriegeskorte et al.,2009; Vul et al.,2009]. The lipreading scores for the participants here varied between 6 and 79 words correct out of 257, which is a relatively restricted range; and the number of participants was only 10, because TVSA was not localized in two participants (one with a lipreading score of 6 and the other with a score of 29). The resulting correlations were: video speech and lipreading scores, r = 0.12; video nonspeech and lipreading scores: r = −0.39 (P < 0.10, one‐tailed); point‐light speech and lipreading scores: r = 0.35 (P < 0.10, one‐tailed); and pointlight nonspeech and lipreading scores: r = −0.09. The two marginally significant correlations are consistent with specificity in TVSA for speech processing. Future studies are needed with independent TVSA ROI localizer runs versus independent experimental runs and a larger participant sample to determine whether the TVSA is activated in relationship to lipreading ability.
Nonspeech Face Gesture Processing
Puce and Perrett [2003], in their review of the literature on temporal lobe responses to biological motion, show that speech and other biological motions have been reported across a fairly wide range of the middle and posterior STS. Ours is the first study, to our knowledge, to compare speech face motion directly to nonspeech face motion with gestures other than gurns and to quantify the stimulus motion speeds. Thus, here a conclusion can be made more strongly that speech face cues are integrated more anteriorly in the temporal lobe than nonspeech face motion. Thompson et al. [2007] show that the right STS responds similarly to face and hand movement and to radial gratings, supporting the view that this area provides a visual description to higher levels of processing but does not code that description in relationship to specific body parts [c.f., Pelphrey et al.,2005]. In the current study, the possibility of a correlation between lipreading scores and activation in pSTG/pMTG for speech and for nonspeech stimuli suggests that individuals vary not only in their visual speech perception skills but also in their perception of nonspeech motion for the face and other body parts. But strong conclusions about this issue must await further study.
V5/MT, FFA, and LOC ROIs
No support was obtained for specialized speech processing in the cortices for which functional localizers were applied, that is, for the FFA, LOC, and V5/MT, although activations in those areas have been reported for visible speech [Calvert and Campbell,2003; Campbell et al.,1986,1997; Capek et al.,2008; Santi et al.,2003]. Tiled control stimuli were very effective in removing activations that could be attributed to motion per se and face attributes that survived in the controls, such as the face configuration and eye movements. The coherent point‐light stimuli were more effective than video stimuli for activating V5/MT. But in addition, the difference between stimulus conditions showing significantly greater activation with the nonspeech stimuli, suggests that a functional processing distinction exists at the level of V5/MT for two different forms of face biological motion. This distinction could be due to feedback mechanisms from higher levels of analysis. Paulesu et al. [2003] obtained significantly less activation in a lipreading words condition versus a backward words condition with the same words, an interesting contrast in which the stimulus motions were the same but their function different. Santi et al. [2003], and Calvert and Campbell [2003] reported right V5/MT activation for visible speech, but in Calvert and Campbell, the contrast was between still video and moving video taken from speech, and in Santi et al., the contrast was point‐light speech versus body movement. That is, speech as a motion stimulus does activate V5/MT, as it did here, but when the stimuli are closely matched, response differences arise, perhaps, as a result of feedback from higher‐level processing. The FFA results are consistent with previous investigations of nonspeech face motion activating the fusiform gyrus [Puce and Perrett,2003]. In Campbell et al. [2001], the right FFA was reported to be more active for speech than for gurning, a result that is different from ours, and for which no ready explanation is available.
LOC is considered to be important for processing visual shape information [Grill‐Spector et al.,2001]. It responds preferentially to images of objects versus those of textured patterns [Malach et al.,1995]. fMRI studies have also suggested that LOC is involved in processing tactile shape information but not auditory representations of objects [Amedi et al.,2001]. Observations of cross‐modal priming effects in LOC suggest that the area is engaged in representing higher‐order shape information accessible by vision or touch [Beauchamp,2005a]. The finding here of greater activation to control and nonspeech stimuli versus speech might be due to speech suppressing activation related to shape or configural processing of face stimuli.
Point‐Light Stimuli
Both dynamic and pictorial/configural information is used in visual speech perception [Calvert and Campbell,2003]. However, Jordan et al. [2000] showed that point‐light stimuli were less effective than gray‐scale video stimuli for influencing perceptual identification under audiovisual conditions [see also, Rosenblum and Saldana,1998]. Why then were the point‐light stimuli in the current study effective in activating areas in common with video speech? The effectiveness of point‐light stimuli is predictable if indeed they capture perceptually relevant information.
Previously, Jiang et al. [2007] showed a high correlation between perceptual dissimilarity structure for lipreading nonsense syllables and the physical dissimilarity structure for the same syllables represented by the 3D coordinates or retro‐reflectors tracked over time. The same type of 3D, coordinate data was used here to synthesize the point‐light, stimuli. The current results converge with those of Jiang et al. in suggesting that the dynamic face motion of discrete points on the face is perceptually relevant for speech processing. Santi et al. [2003], in a study designed to compare point‐light speech to point‐light walking or jumping, showed similar responses to those in this study, when the speech was compared with a moving dot control.
CONCLUSIONS
Deaf individuals, whose speech perception relies exclusively on vision, show that speech perception is not a specialization of the auditory system per se [Andersson and Lidestam,2005; Auer et al.,2007; Bernstein et al.,2000]. Here, we sought evidence in adults with normal hearing for the cortical location/s responsible for generating linguistically relevant visual descriptions of the cues afforded by the talking face. The use of video and point‐light stimuli to convey speech, nonspeech, and control stimuli resulted in evidence that phonetic cue integration is carried out in a specialized region of the pSTS/pMTG. We propose that this is the temporal visual speech area ‐ the TVSA. Our results on participants that varied in lipreading expertise give some additional preliminary support for this attribution. We also suggest that the left middle STS/STG area is the site of phonemic categorization for visual and auditory speech stimuli. Thus, we propose that there are two parallel processing paths for speech cue integration [Bernstein et al.,2004], one that follows the hierarchical organization of the auditory system and the other that follows the hierarchical organization of the visual system. Each type of stimulus has its own attributes that are intrinsic to the signals by which it is conveyed. The role of phonetic cue integration is to condition the modality‐specific information for subsequent higher‐level psycholinguistic processing.
Supporting information
Additional Supporting Information may be found in the online version of this article.
Supporting Figure 1
Supporting Figure 2
Supporting Figure 3
Supporting Figure 4
Supporting Figure 5
Supporting Figure 6
Supporting Figure 7
Supporting Information
Acknowledgements
The authors acknowledge the involvement of Rachel Beattie, Chris Courtney, and Xiaofei Yang and thank them for assistance in carrying out the initial data collection and data reduction; the authors thank Bosco Tjan, Ph.D., for providing the ROI methods; Jiancheng Zhuang, Ph.D., for assisting with the scanning; Hanna Damasio, Ph.D., for providing consultation on anatomy; and Brian Chaney and Ewen Chao for technical assistance at House Ear Institute. The views expressed here are those of the authors and do not necessarily represent those of the National Science Foundation.
REFERENCES
- Amedi A, Malach R, Hendler T, Peled S, Zohary E ( 2001): Visuo‐haptic object‐related activation in the ventral visual pathway. Nat Neurosci 4: 324–330. [DOI] [PubMed] [Google Scholar]
- Andersson U, Lidestam B ( 2005): Bottom‐up driven speechreading in a speechreading expert: The case of AA (JK023). Ear Hear 26: 214–224. [DOI] [PubMed] [Google Scholar]
- Auer ET Jr, Bernstein LE ( 2007): Enhanced visual speech perception in individuals with early onset hearing impairment. J Speech Lang Hear Res 50: 1157–1165. [DOI] [PubMed] [Google Scholar]
- Auer ET Jr, Bernstein LE, Sungkarat W, Singh M ( 2007): Vibrotactile activation of the auditory cortices in deaf versus hearing adults Neuroreport 18: 645–648. [DOI] [PMC free article] [PubMed] [Google Scholar]
- Beauchamp MS ( 2005a): See me, hear me, touch me: Multisensory integration in lateral occipital‐temporal cortex. Curr Opin Neurobiol 15: 145–153. [DOI] [PubMed] [Google Scholar]
- Beauchamp MS ( 2005b): Statistical criteria in fMRI studies of multisensory integration. Neuroinformatics 3: 93–113. [DOI] [PMC free article] [PubMed] [Google Scholar]
- Beauchamp MS, Lee KE, Haxby JV, Martin A ( 2003): fMRI responses to video and point‐light displays of moving humans and manipulable objects. J Cogn Neurosci 15: 991–1001. [DOI] [PubMed] [Google Scholar]
- Benson RR, Richardson M, Whalen DH, Lai S ( 2006): Phonetic processing areas revealed by sinewave speech and acoustically similar non‐speech. Neuroimage 31: 342–353. [DOI] [PubMed] [Google Scholar]
- Bernstein LE, Auer ET Jr, Moore JK ( 2004): Audiovisual speech binding: Convergence or association? In: Calvert GA, Spence C, Stein BE, editors. Handbook of Multisensory Processes. Cambridge, MA: MIT; pp 203–223. [Google Scholar]
- Bernstein LE, Auer ET Jr, Moore JK, Ponton CW, Don M, Singh M ( 2002): Visual speech perception without primary auditory cortex activation. Neuroreport 13: 311–315. [DOI] [PubMed] [Google Scholar]
- Bernstein LE, Demorest ME, Tucker PE ( 2000): Speech perception without hearing. Percept Psychophys 62: 233–252. [DOI] [PubMed] [Google Scholar]
- Bernstein LE, Lu ZL, Jiang J ( 2008): Quantified acoustic‐optical speech signal incongruity identifies cortical sites of audiovisual speech processing. Brain Res 1242: 172–184. [DOI] [PMC free article] [PubMed] [Google Scholar]
- Binder JR, Frost JA, Hammeke TA, Bellgowan PS, Springer JA, Kaufman JN, Possing ET ( 2000): Human temporal lobe activation by speech and nonspeech sounds. Cereb Cortex 10: 512–528. [DOI] [PubMed] [Google Scholar]
- Bonda E, Petrides M, Ostry D, Evans A ( 1996): Specific involvement of human parietal systems and the amygdala in the perception of biological motion. J Neurosci 16: 3737–3744. [DOI] [PMC free article] [PubMed] [Google Scholar]
- Bunzeck N, Wuestenberg T, Lutz K, Heinze HJ, Jancke L ( 2005): Scanning silence: Mental imagery of complex sounds. Neuroimage 26: 1119–1127. [DOI] [PubMed] [Google Scholar]
- Calvert GA, Bullmore ET, Brammer MJ, Campbell R, Williams SC, McGuire PK, Woodruff PW, Iversen SD, David AS ( 1997): Activation of auditory cortex during silent lipreading. Science 276: 593–596. [DOI] [PubMed] [Google Scholar]
- Calvert GA, Campbell R ( 2003): Reading speech from still and moving faces: The neural substrates of visible speech. J Cogn Neurosci 15: 57–70. [DOI] [PubMed] [Google Scholar]
- Campbell R, Landis T, Regard M ( 1986): Face recognition and lipreading. A neurological dissociation. Brain 109: 509–521. [DOI] [PubMed] [Google Scholar]
- Campbell R, MacSweeney M, Surguladze S, Calvert G, McGuire P, Suckling J, Brammer MJ, David AS ( 2001): Cortical substrates for the perception of face actions: An fMRI study of the specificity of activation for seen speech and for meaningless lower‐face acts (gurning). Cogn Brain Res 12: 233–243. [DOI] [PubMed] [Google Scholar]
- Campbell R, Zihl J, Massaro DW, Munhall K, Cohen MM ( 1997): Speechreading in the akinetopsic patient, LM. Brain 120: 1793–1803. [DOI] [PubMed] [Google Scholar]
- Capek CM, MacSweeney M, Woll B, Waters D, McGuire PK, David AS, Brammer MJ, Campbell R ( 2008): Cortical circuits for silent speech reading in deaf and hearing people. Neuropsychologia 46: 1233–1241. [DOI] [PMC free article] [PubMed] [Google Scholar]
- Cappe C, Rouiller EM, Barone P ( 2009): Multisensory anatomical pathways. Hear Res 258: 28–36. [DOI] [PubMed] [Google Scholar]
- Chawla D, Buechel C, Edwards R, Howseman A, Josephs O, Ashburner J, Friston KJ ( 1999): Speed‐dependent responses in V5: A replication study. Neuroimage 9: 508–515. [DOI] [PubMed] [Google Scholar]
- Chomsky C ( 1986): Analytic study of the Tadoma method: Language abilities of three deaf‐blind subjects. J Speech Hear Res 29: 332–347. [DOI] [PubMed] [Google Scholar]
- Damasio H ( 2005): Human Brain Anatomy in Computerized Images. Oxford: Oxford University; 560 p. [Google Scholar]
- Downing PE, Jiang Y, Shuman M, Kanwisher N ( 2001): A cortical area selective for visual processing of the human body. Science 293: 2470–2473. [DOI] [PubMed] [Google Scholar]
- Driver J, Noesselt T ( 2008): Multisensory interplay reveals crossmodal influences on ‘sensory‐specific’ brain regions, neural responses, and judgments. Neuron 57: 11–23. [DOI] [PMC free article] [PubMed] [Google Scholar]
- Eggermont JJ ( 2001): Between sound and perception: Reviewing the search for a neural code. Hear Res 157: 1–42. [DOI] [PubMed] [Google Scholar]
- Fischl B, Sereno MI, Dale AM ( 1999a): Cortical surface‐based analysis. II: Inflation, flattening, and a surface‐based coordinate system. Neuroimage 9: 195–207. [DOI] [PubMed] [Google Scholar]
- Fischl B, Sereno MI, Tootell RB, Dale AM ( 1999b): High‐resolution intersubject averaging and a coordinate system for the cortical surface. Hum Brain Mapp 8: 272–284. [DOI] [PMC free article] [PubMed] [Google Scholar]
- Fridriksson J, Moss J, Davis B, Baylis GC, Bonilha L, Rorden C ( 2008): Motor speech perception modulates the cortical language areas. Neuroimage 41: 605–613. [DOI] [PMC free article] [PubMed] [Google Scholar]
- Genovese CR, Lazar NA, Nichols T ( 2002): Thresholding of statistical maps in functional neuroimaging using the false discovery rate. Neuroimage 15: 870–878. [DOI] [PubMed] [Google Scholar]
- Ghazanfar AA, Maier JX, Hoffman KL, Logothetis NK ( 2005): Multisensory integration of dynamic faces and voices in rhesus monkey auditory cortex. J Neurosci 25: 5004–5012. [DOI] [PMC free article] [PubMed] [Google Scholar]
- Ghazanfar AA, Schroeder CE ( 2006): Is neocortex essentially multisensory? Trends Cogn Sci 10: 278–285. [DOI] [PubMed] [Google Scholar]
- Grill‐Spector K, Kourtzi Z, Kanwisher N ( 2001): The lateral occipital complex and its role in object recognition. Vision Res 41: 1409–1422. [DOI] [PubMed] [Google Scholar]
- Grossman E, Donnelly M, Price R, Pickens D, Morgan V, Neighbor G, Blake R ( 2000): Brain areas involved in perception of biological motion. J Cogn Neurosci 12: 711–720. [DOI] [PubMed] [Google Scholar]
- Grossman ED, Blake R ( 2002): Brain areas active during visual perception of biological motion. Neuron 35: 1167–1175. [DOI] [PubMed] [Google Scholar]
- Hall DA, Fussell C, Summerfield AQ ( 2005): Reading fluent speech from talking faces: Typical brain networks and individual differences. J Cogn Neurosci 17: 939–953. [DOI] [PubMed] [Google Scholar]
- Hasson U, Skipper JI, Nusbaum HC, Small SL ( 2007): Abstract coding of audiovisual speech: Beyond sensory representation. Neuron 56: 1116–1126. [DOI] [PMC free article] [PubMed] [Google Scholar]
- Jenkins JJ, Strange W ( 1999): Perception of dynamic information for vowels in syllable onsets and offsets. Percept Psychophys 61: 1200–1210. [DOI] [PubMed] [Google Scholar]
- Jiang J, Auer ET Jr, Alwan A, Keating PA, Bernstein LE ( 2007): Similarity structure in visual speech perception and optical phonetics. Percept Psychophys 69: 1070–1083. [DOI] [PubMed] [Google Scholar]
- Johansson G ( 1973): Visual perception of biological motion and a model for its analysis. Percept Psychophys 14, 201–211. [Google Scholar]
- Jones EG, Powell TP ( 1970): An anatomical study of converging sensory pathways within the cerebral cortex of the monkey. Brain 93: 793–820. [DOI] [PubMed] [Google Scholar]
- Jordan TR, McCotter MV, Thomas SM ( 2000): Visual and audiovisual speech perception with color and gray‐scale facial images. Percept Psychophys 62: 1394–1404. [DOI] [PubMed] [Google Scholar]
- Joshi AA, Shattuck DW, Thompson PM, Leahy RM ( 2007): Surface‐constrained volumetric brain registration using harmonic mappings. IEEE Trans Med Imaging 26: 1657–1669. [DOI] [PMC free article] [PubMed] [Google Scholar]
- Kaas JH, Hackett TA ( 2000): Subdivisions of auditory cortex and processing streams in primates. Proc Natl Acad Sci USA 97: 11793–11799. [DOI] [PMC free article] [PubMed] [Google Scholar]
- Kanwisher N, McDermott J, Chun MM ( 1997): The fusiform face area: A module in human extrastriate cortex specialized for face perception. J Neurosci 17: 4302–4311. [DOI] [PMC free article] [PubMed] [Google Scholar]
- Kayser C, Petkov CI, Logothetis NK ( 2008): Visual modulation of neurons in auditory cortex. Cereb Cortex 18: 1560–1574. [DOI] [PubMed] [Google Scholar]
- Kriegeskorte N, Simmons WK, Bellgowan PS, Baker CI ( 2009): Circular analysis in systems neuroscience: The dangers of double dipping. Nat Neurosci 12: 535–540. [DOI] [PMC free article] [PubMed] [Google Scholar]
- Liebenthal E, Binder JR, Spitzer SM, Possing ET, Medler DA ( 2005): Neural substrates of phonemic perception. Cereb Cortex 15: 1621–1631. [DOI] [PubMed] [Google Scholar]
- Macmillan NA, Creelman CD ( 2005): Detection Theory: A User's Guide. Mahwah, NJ: Earlbaum; 512 p. [Google Scholar]
- MacSweeney M, Calvert GA, Campbell R, McGuire PK, David AS, Williams SC, Woll B, Brammer MJ ( 2002): Speechreading circuits in people born deaf. Neuropsychologia 40: 801–807. [DOI] [PubMed] [Google Scholar]
- Malach R, Reppas JB, Benson RR, Kwong KK, Jiang H, Kennedy WA, Ledden PJ, Brady TJ, Rosen BR, Tootell RB ( 1995): Object‐related activity revealed by functional magnetic resonance imaging in human occipital cortex. Proc Natl Acad Sci USA 92: 8135–8139. [DOI] [PMC free article] [PubMed] [Google Scholar]
- Meredith MA ( 2002): On the neuronal basis for multisensory convergence: A brief overview. Cogn Brain Res 14: 31–40. [DOI] [PubMed] [Google Scholar]
- Mesulam MM ( 1998): From sensation to cognition. Brain 121: 1013–1052. [DOI] [PubMed] [Google Scholar]
- Mohammed T, Campbell R, MacSweeney M, Milne E, Hansen P, Coleman M ( 2005): Speechreading skill and visual movement sensitivity are related in deaf speechreaders. Perception 34: 205–216. [DOI] [PubMed] [Google Scholar]
- Nichols T, Brett M, Andersson J, Wager T, Poline JB ( 2005): Valid conjunction inference with the minimum statistic. Neuroimage 25: 653–660. [DOI] [PubMed] [Google Scholar]
- Obleser J, Zimmermann J, Van Meter J, Rauschecker JP ( 2007): Multiple stages of auditory speech perception reflected in event‐related fMRI. Cereb Cortex 17: 2251–2257. [DOI] [PubMed] [Google Scholar]
- Oram MW, Perrett DI ( 1994): Responses of anterior superior temporal polysensory (STPa) neurons to “biological motion” stimuli. J Cogn Neurosci 6: 99–116. [DOI] [PubMed] [Google Scholar]
- Pantazis D, Joshi A, Jiang J, Shattuck DW, Bernstein LE, Damasio H, Leahy RM ( 2010): Comparison of landmark‐based and automatic methods for cortical surface registration. Neuroimage 49: 2479–2493. [DOI] [PMC free article] [PubMed] [Google Scholar]
- Paulesu E, Perani D, Blasi V, Silani G, Borghese NA, De Giovanni U, Sensolo S, Fazio F ( 2003): A functional‐anatomical model for lipreading. J Neurophysiol 90: 2005–2013. [DOI] [PubMed] [Google Scholar]
- Peelen MV, Wiggett AJ, Downing PE ( 2006): Patterns of fMRI activity dissociate overlapping functional brain areas that respond to biological motion. Neuron 49: 815–822. [DOI] [PubMed] [Google Scholar]
- Pekkola J, Ojanen V, Autti T, Jaaskelainen IP, Möttönen R, Sams M ( 2006): Attention to visual speech gestures enhances hemodynamic activity in the left planum temporale. Hum Brain Mapp 27: 471–477. [DOI] [PMC free article] [PubMed] [Google Scholar]
- Pekkola J, Ojanen V, Autti T, Jaaskelainen IP, Möttönen R, Tarkianen A, Sams M ( 2005): Primary auditory cortex activation by visual speech: An fMRI study at 3T. Neuroreport 16: 125–128. [DOI] [PubMed] [Google Scholar]
- Pelphrey KA, Viola RJ, McCarthy G ( 2004): When strangers pass: Processing of mutual and averted social gaze in the superior temporal sulcus. Psychol Sci 15: 598–603. [DOI] [PubMed] [Google Scholar]
- Pelphrey KA, Morris JP, Michelich CR, Allison T, McCarthy G ( 2005): Functional anatomy of biological motion perception in posterior temporal cortex: An fMRI study of eye, mouth and hand movements. Cereb Cortex 15: 1866–1876. [DOI] [PubMed] [Google Scholar]
- Perrett DI, Smith PA, Mistlin AJ, Chitty AJ, Head AS, Potter DD, Broennimann R, Milner AD, Jeeves MA ( 1985): Visual analysis of body movements by neurones in the temporal cortex of the macaque monkey: A preliminary report. Behav Brain Res 16: 153–170. [DOI] [PubMed] [Google Scholar]
- Perrett DI, Mistlin AJ, Chitty AJ, Smith PA, Potter DD, Broennimann R, Harries M ( 1988): Specialized face processing and hemispheric asymmetry in man and monkey: Evidence from single unit and reaction time studies. Behav Brain Res 29: 245–258. [DOI] [PubMed] [Google Scholar]
- Poldrack RA, Wagner AD, Prull MW, Desmond JE, Glover GH, Gabrieli JD ( 1999): Functional specialization for semantic and phonological processing in the left inferior prefrontal cortex. Neuroimage 10: 15–35. [DOI] [PubMed] [Google Scholar]
- Ponton CW, Bernstein LE, Auer ET Jr. ( 2009): Mismatch negativity with visual‐only and audiovisual speech. Brain Topogr 21: 207–215. [DOI] [PMC free article] [PubMed] [Google Scholar]
- Puce A, Perrett D ( 2003): Electrophysiology and brain imaging of biological motion. Philos Trans R Soc Lond B Biol Sci 358: 435–445. [DOI] [PMC free article] [PubMed] [Google Scholar]
- Puce A, Allison T, Bentin S, Gore JC, McCarthy G ( 1998): Temporal cortex activation in humans viewing eye and mouth movements. J Neurosci 18: 2188–2199. [DOI] [PMC free article] [PubMed] [Google Scholar]
- Puce A, Syngeniotis A, Thompson JC, Abbott DF, Wheaton KJ, Castiello U ( 2003): The human temporal lobe integrates facial form and motion: Evidence from fMRI and ERP studies. Neuroimage 19: 861–869. [DOI] [PubMed] [Google Scholar]
- Reed CM ( 1995): Tadoma: An overview of research In: Plant G, Spens K‐E, editors. Profound Deafness and Speech Communication. London: Whurr. [Google Scholar]
- Rizzolatti G, Arbib MA ( 1998): Language within our grasp. Trends Neurosci 21: 188–194. [DOI] [PubMed] [Google Scholar]
- Rizzolatti G, Craighero L ( 2004): The mirror‐neuron system. Annu Rev Neurosci 27: 169–192. [DOI] [PubMed] [Google Scholar]
- Rosenblum LD ( 2008): Speech perception as a multimodal phenomenon. Curr Dir Psychol Sci 17: 405–409. [DOI] [PMC free article] [PubMed] [Google Scholar]
- Rosenblum LD, Johnson JA, Saldana HM ( 1996): Point‐light facial displays enhance comprehension of speech in noise. J Speech Hear Res 39: 1159–1170. [DOI] [PubMed] [Google Scholar]
- Rosenblum LD, Saldana HM ( 1996): An audiovisual test of kinematic primitives for visual speech perception. J Exp Psychol Hum Percept Perform 22: 318–331. [DOI] [PubMed] [Google Scholar]
- Rosenblum LD, Saldana HM ( 1998): Time‐varying information for visual speech perception In: Campbell R, Dodd B, Burnham D, editors. Hearing by Eye II: Advances in the Psychology of Speech Reading and Auditory‐Visual Speech. East Sussex, Hove, UK: Psychology Press; pp 61–81. [Google Scholar]
- Sadato N, Okada T, Honda M, Matsuki K‐I, Yoshida M, Kashikura K‐I, Takei W, Sato T, Kochiyama T, Yonekura Y ( 2005): Cross‐modal integration and plastic changes revealed by lip movement, random‐dot motion and sign languages in the hearing and deaf. Cereb Cortex 15: 1113–1122. [DOI] [PubMed] [Google Scholar]
- Sams M, Aulanko R, Hamalainen M, Hari R, Lounasmaa OV, Lu ST, Simola J ( 1991): Seeing speech: Visual information from lip movements modifies activity in the human auditory cortex. Neurosci Lett 127: 141–145. [DOI] [PubMed] [Google Scholar]
- Santi A, Servos P, Vatikiotis‐Bateson E, Kuratate T, Munhall K ( 2003): Perceiving biological motion: Dissociating visible speech from walking. J Cogn Neurosci 15: 800–809. [DOI] [PubMed] [Google Scholar]
- Schroeder CE, Foxe JJ ( 2002): The timing and laminar profile of converging inputs to multisensory areas of the macaque neocortex. Cogn Brain Res 14: 187–198. [DOI] [PubMed] [Google Scholar]
- Scott SK, Blank CC, Rosen S, Wise RJ ( 2000): Identification of a pathway for intelligible speech in the left temporal lobe. Brain 123: 2400–2406. [DOI] [PMC free article] [PubMed] [Google Scholar]
- Scott SK, Rosen S, Lang H, Wise RJ ( 2006): Neural correlates of intelligibility in speech investigated with noise vocoded speech—A positron emission tomography study. J Acoust Soc Am 120: 1075–1083. [DOI] [PubMed] [Google Scholar]
- Shattuck DW, Leahy RM ( 2002): BrainSuite: An automated cortical surface identification tool. Med Image Anal 6: 129–142. [DOI] [PubMed] [Google Scholar]
- Skipper JI, Nusbaum HC, Small SL ( 2005): Listening to talking faces: Motor cortical activation during speech perception. Neuroimage 25: 76–89. [DOI] [PubMed] [Google Scholar]
- SPSS . 2006. SPSS 15.0 for Windows: LEAD Technologies, Inc.
- Thompson JC, Hardee JE, Panayiotou A, Crewther D, Puce A ( 2007): Common and distinct brain activation to viewing dynamic sequences of face and hand movements. Neuroimage 37: 966–973. [DOI] [PubMed] [Google Scholar]
- Uppenkamp S, Johnsrude IS, Norris D, Marslen‐Wilson W, Patterson RD ( 2006): Locating the initial stages of speech‐sound processing in human temporal cortex. Neuroimage 31: 1284–1296. [DOI] [PubMed] [Google Scholar]
- Vigneau M, Beaucousin V, Herve PY, Duffau H, Crivello F, Houde O, Mazoyer B, Tzourio‐Mazoyer N ( 2006): Meta‐analyzing left hemisphere language areas: Phonology, semantics, and sentence processing. Neuroimage 30: 1414–1432. [DOI] [PubMed] [Google Scholar]
- Vul E, Harris C, Winkielman P, Pashler H ( 2009): Puzzlingly high correlations in fMRI studies of emotion, personality, and social cognition. Perspect Psychol Sci 4: 274–290. [DOI] [PubMed] [Google Scholar]
- Waters D, Campbell R, Capek CM, Woll B, David AS, McGuire PK, Brammer MJ, MacSweeney M ( 2007): Fingerspelling, signed language, text and picture processing in deaf native signers: The role of the mid‐fusiform gyrus. Neuroimage 35: 1287–1302. [DOI] [PMC free article] [PubMed] [Google Scholar]
Associated Data
This section collects any data citations, data availability statements, or supplementary materials included in this article.
Supplementary Materials
Additional Supporting Information may be found in the online version of this article.
Supporting Figure 1
Supporting Figure 2
Supporting Figure 3
Supporting Figure 4
Supporting Figure 5
Supporting Figure 6
Supporting Figure 7
Supporting Information