

Dynamic contrast-enhanced MR imaging may be a useful imaging method and Ktrans may prove to be an imaging marker for the assessment of the therapeutic response of the vasa vasorum in patients with atherosclerotic plaque.
Abstract
Purpose:
To investigate whether short-term, intensive lipid therapy leads to changes in microvascular characteristics, as measured by using dynamic contrast material–enhanced (DCE) magnetic resonance (MR) imaging.
Materials and Methods:
Institutional review board approval and informed consent were obtained for this HIPAA-compatible study. Subjects with established coronary artery disease or carotid artery stenosis of 15% or greater determined by using ultrasonography and with levels of apolipoprotein B of 120 mg/dL (1.2 g/L) or greater were enrolled in an ongoing study (clinical trial NCT00715273). All received intensive lipid therapy to achieve targeted high- and low-density lipoprotein cholesterol levels and underwent serial serum monitoring including high-sensitivity C-reactive protein (HsCRP) level measurements. Carotid artery MR imaging examinations including morphologic and DCE MR images were obtained at baseline and 1 year after treatment. In subjects with advanced lesions (>2 mm thick), MR image analysis was performed, including measurement of lipid-rich necrotic core size and kinetic modeling of DCE MR images to assess changes in the transfer constant (Ktrans). The differences in Ktrans between baseline and 1-year follow-up were compared by using the Wilcoxon signed rank test, and associations were assessed by using the Spearman rank correlation coefficient.
Results:
Twenty-eight subjects with interpretable DCE MR imaging results at both baseline and 1-year follow-up were included. After 1 year of treatment, a significant reduction was found in mean Ktrans (0.085 min−1 ± 0.037 [standard deviation] to 0.067 min−1 ± 0.028, P = .02). Reduction in Ktrans was not significantly correlated with observed reductions in lipid-rich necrotic core size or reductions in HsCRP level.
Conclusion:
These findings suggest that DCE MR imaging may be a useful imaging method for the assessment of the therapeutic response of the vasa vasorum in patients with atherosclerotic plaque.
Clinical trial registration no. NCT00715273.
© RSNA, 2011
Introduction
The onset of atherosclerosis leads to growth of the adventitial vasa vasorum, expressed as a disorganized pattern of neovessels with enlarged and irregular diameters (1). Adventitial-derived vasa vasorum neovascularization plays a significant role in atherosclerotic plaque progression and destabilization (2–4). Investigators in a recent study (5) have shown that adventitial vasa vasorum density and permeability precede an increase in intima-media thickness, endothelial dysfunction (6), and, most important, inflammatory activity of the plaque (7,8). Plaque instability, which leads to plaque rupture and clinical events, may be triggered by the disruption and leakage of immature neovessels originating from adventitial vasa vasorum (9).
Because of the role of neovessels in atherosclerosis, there has been a growing interest in the development of imaging techniques with the capability for visualization and quantification of the vasa vasorum in vivo. Dynamic contrast material–enhanced (DCE) magnetic resonance (MR) imaging with a gadolinium-based contrast agent permits the assessment of neovascular architecture and functional characteristics, such as fractional plasma volume (vp) and permeability (10–12). DCE MR imaging also provides high spatial resolution that permits localization of the measurements, including the adventitial boundary, the source of the vasa vasorum (12). Among available kinetic parameters, most DCE MR imaging studies have focused on the transfer constant (Ktrans), which is interpreted as the mathematical product of vessel surface area and permeability (13).
The capability of DCE MR imaging to characterize vasa vasorum neovascularization and its permeability might be helpful for understanding therapeutic effects on the vasa vasorum. On the basis of findings in previous studies in animal models that have indicated that statins inhibit vasa vasorum neovascularization (14,15), we hypothesized that intensive lipid therapy over 12 months would reduce the neovessel density and/or permeability within the adventitial vasa vasorum, thereby reducing Ktrans, as measured by using DCE MR imaging. The aim of this study was to investigate whether short-term, intensive lipid therapy leads to changes in microvascular characteristics, as measured by using DCE MR imaging.
Materials and Methods
This investigation was conducted as part of the ongoing Carotid Plaque Composition study (clinical trial no. NCT00715273;http://clinicaltrials.gov) (16). Funding and medications were provided in part by Pfizer (New York, NY). Medications were also provided by Abbott Laboratories (Abbott Park, Ill) and Daiichi-Sankyo (Parsippany, NJ). The data and information presented here were in the sole control of the authors. In addition, one author (W.S.K.) is employed by a company that develops software similar to that described here, but that author did not have access to the data being presented.
Study Population
All subjects provided written informed consent, and the study protocol was approved by the institutional review board (University of Washington, Seattle, Wash). Between May 2001 and May 2004, the prospective Carotid Plaque Composition study recruited 123 subjects. These subjects met the following inclusion criteria: (a) Men were younger than 67 years and women were younger than 70 years; (b) they had a family history of cardiovascular disease; (c) they had documented coronary artery disease, with at least one lesion with a 50% stenosis or three coronary lesions with a 30% stenosis, or a history of myocardial infarction, percutaneous coronary intervention, or coronary artery bypass graft surgery, or they had documented carotid artery stenosis of greater than 15% by using ultrasonography (US); (d) they had a confirmed fasting apolipoprotein B level of 120 mg/dL (1.2 g/L) or higher; (e) they were willing to participate in the study and sign an informed consent form; (f) they were medically stable; (g) they had no contraindications to MR imaging; (h) they had not been treated with lipid-lowering therapy for longer than 1 year; and (i) they had no ischemic neurologic symptoms. Of more than 6600 subjects screened, 1392 (21.1%) potential subjects were contacted by their cardiologists and given study information. Two hundred forty-eight subjects (17.8% of 1392) were eligible for a screening blood draw, and 123 subjects (49.6% of 248) consented to participate. The major reason for subject screening failure was that many subjects had been treated with lipid-lowering therapy for longer than 1 year.
After enrollment, subjects were randomized to one of three treatment arms. All subjects received atorvastatin (Lipitor; Pfizer), at 10–80 mg/d. One-third received atorvastatin alone, one-third also received extended-release niacin at 2 g/d, and one-third received extended-release niacin plus colesevelam (Welchol; Daiichi-Sankyo) at 3.8 g/d. The treatment target for low-density lipoprotein cholesterol level was 80 mg/dL (2.07 mmol/L) or lower for the single- and double-treatment groups and 60 mg/dL (1.55 mmol/L) or lower for the triple-treatment group. The treatment target for high-density lipoprotein cholesterol level for the two niacin-treated groups was to increase the level by 10 mg/dL (0.26 mmol/L) from baseline. At present, blinding remains in effect. High-sensitivity C-reactive protein (HsCRP) was determined at baseline and at 12 months.
MR Imaging Protocol
Subjects underwent MR imaging of the carotid artery and DCE MR imaging at baseline and at 1 year after intensive lipid therapy with a 1.5-T imaging unit (Signa Horizon EchoSpeed; GE Healthcare, Piscataway, NJ) with a phased-array carotid artery surface coil (Pathway MR Imaging, Seattle, Wash). A standardized multicontrast-weighted carotid artery imaging protocol (17) was used to acquire T1-weighted, proton-density–weighted, and T2-weighted black-blood images and time-of-flight bright-blood angiographic images. Imaging parameters for each weighting were as follows: For T1-weighted images, repetition time msec/echo time msec was 800/11; for T2-weighted and proton-density–weighted images, the parameters were 3000/40 and 3000/20, respectively; and for time-of-flight images, they were 21/2.9, with a flip angle of 15°. All images were obtained centered at the carotid bifurcation with continuous 16 locations and the following: section thickness, 2 mm; field of view, 160 × 120 mm; and matrix size, 256 × 256. DCE MR imaging was performed by using a previously published protocol (10) during intravenous injection of 0.1 mmol/kg of gadodiamide (Omniscan; GE Healthcare) at a rate of 2 mL/sec through a power injector (Spectris Solaris EP; Medrad, Warrendale, Pa). Images were simultaneously acquired at six locations with the following: section thickness, 3 mm; intersection gap, 1 mm; field of view, 16 × 12 cm; matrix, 256 × 144; and pixels reconstructed at 0.625 × 0.625 mm through zero-filled interpolation. Images were obtained centered at the carotid bifurcation and at 12 times separated by a repetition interval of 15 seconds. The acquisition of the third time was coincident with the initiation of the injection of the gadolinium-based contrast agent. Following the DCE MR imaging acquisition, contrast-enhanced T1-weighted images were acquired 5 minutes after injection by using the same parameters as were used for the nonenhanced T1-weighted images.
Morphologic Characteristics and Composition Review
Two experienced reviewers (L.D., H.C., with more than 3 years of plaque image review experience), who were blinded to type of therapy used, laboratory results, clinical information, and times, interpreted the multicontrast-weighted MR images with consensus. Custom-designed plaque imaging analysis software (18) (Cascade; Vascular Imaging Laboratory, University of Washington, Seattle, Wash) was used to draw the lumen and outer wall boundary by using B-splines. Plaque composition was identified and outlined by using the previously published in vivo multicontrast-weighted MR imaging criteria that have been validated with histologic analyis (19). In brief, the lipid-rich necrotic core appears as an isointense to hyperintense signal intensity on T1-weighted images and as a hypointense signal intensity on T2-weighted and contrast-enhanced T1-weighted images (20). Calcification has a hypointense signal intensity on T1-weighted, T2-weighted, proton-density–weighted, time-of-flight, and contrast-enhanced T1-weighted images (19,21). Intraplaque hemorrhage has a hyperintense signal intensity on T1-weighted and time-of-flight images (22).
DCE MR Imaging Analysis
The analysis of plaque morphologic characteristics and composition was performed with blinding to the DCE MR imaging results. Subsequently, all subjects exhibiting a carotid wall thickness of 2 mm or greater at both baseline and 1 year were selected for DCE MR imaging analysis. The 2-mm constraint is necessary because bright-blood DCE MR imaging analyses can be corrupted by signal from flowing blood within the nearby lumen. A 2-mm thickness ensures that the adventitia, from which the measurement is taken, has adequate separation from the lumen.
The DCE MR imaging analysis was performed by using an established kinetic modeling approach (10,12). In this approach, “vasa vasorum images” are automatically generated that show colorized, parametric maps of vp and Ktrans. The processing begins with registration of a region of interest around the carotid artery to eliminate patient motion through the Kalman filtering registration and smoothing algorithm (23). Next, a mean-shift pattern-recognition algorithm is used to extract an arterial input function, based on the change in signal intensity of the carotid artery lumen over time (12). Finally, the arterial input function is used to estimate vp and Ktrans for each pixel, based on its temporal changes in intensity under a Patlak model of agent kinetics (24). The values for vp and Ktrans are then displayed in a single parametric image by using the red and green color channels, respectively.
Onto these parametric vasa vasorum images, the lumen and outer wall boundaries were then mapped from the standard contrast weightings, including nonenhanced and enhanced T1-weighted, T2-weighted, proton-density–weighted, and time-of-flight imaging. In the only manual step, the lumen and outer wall boundaries were adjusted as necessary by the reviewers by translating the node points of the B-spline contours. The lumen contour was adjusted to enclose a bright red region corresponding to the lumen, and the outer wall boundary was adjusted to coincide with a rim of elevated Ktrans. In making these adjustments, the reviewer remained blinded. Average values of Ktrans and vp were then computed from all pixels within 0.625 mm (1 pixel) of the outer wall boundary in all regions with at least a 2-mm wall thickness. In previous studies, this processing chain was shown to provide high interrate reproducibility, with an intraclass correlation coefficient of 0.95 (12).
Statistical Analysis
Statistical comparisons were limited to those subjects meeting the 2-mm-thick inclusion criterion for DCE MR imaging analysis. In addition, comparisons were performed by using pooled data from all three treatment groups, because the study is ongoing and the randomization remains to be unblinded. The values of adventitial Ktrans, vp, HsCRP, and lipid-rich necrotic core area were recorded as means ± standard deviations, and the baseline and 1-year means were compared by using the Wilcoxon signed rank test. Associations were assessed by using the Spearman rank correlation coefficient (ρ). The 95% confidence intervals (CIs) for the Spearman correlation were calculated by using the nonparametric bootstrap method with 999 resamples (25). Statistical analysis was performed by using software (SPSS/PC, version 12.0, SPSS, Chicago, Ill; R, version 2.10.1, R Foundation for Statistical Computing,Vienna, Austria). A value of P < .05 was considered to indicate a significant difference.
Results
Subjects
Of 123 subjects (mean age, 55 years; range, 35–70 years), 32 were women (mean age, 58 years; range, 38–70 years) and 91 were men (mean age, 54 years; range, 35–67 years). Of 123 subjects enrolled in the Carotid Plaque Composition study, 31 (25.2%) had a wall thickness greater than 2.0 mm at baseline and follow-up. Of 31 subjects, 9.7% (three) had noninterpretable vasa vasorum images in at least one time because of failure of the kinetic modeling algorithm as a consequence of poor image quality. The demographic characteristics of the final 28 of 31 subjects (90.3%), including plasma lipid levels and serum inflammatory marker (HsCRP) at baseline are summarized in the Table. At baseline, MR imaging indicated the presence of a lipid-rich necrotic core in all 28 (100%) subjects, calcification in eight of 28 (28.6%), and no identifiable hemorrhage in all (100%).
Baseline Demographics in 28 Subjects
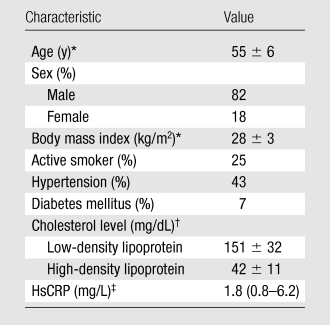
Note.—The remaining 25% of 28 subjects had metabolic syndrome.
Values are means ± standard deviations.
Values are means ± standard deviations. To convert to Système International units in millimoles per liter, multiply by 0.0259.
Value is the mean. Number in parentheses is the range. To convert to Système International units in nanomoles per liter, multiply by 9.524.
Vasa Vasorum Imaging Results
Figure 1 illustrates a typical vasa vasorum imaging result. High adventitial Ktrans appeared with varying degrees of conspicuity along the outer wall boundary. In some cases, the rim was defined by a series of distinct points of high Ktrans, as opposed to continuous lines. Areas of high vp, such as the carotid artery lumen, appeared red. Black regions indicate low Ktrans, where little contrast agent uptake occurs.
Figure 1:

Top: Typical vasa vasorum image from a 46-year-old man. The kinetic modeling results are displayed with vp indicated in red and Ktrans indicated in green. Regions with flowing blood, such as the carotid artery lumen and jugular vein, appear red. Regions with rapid transfer, such as the vessel adventitia (yellow arrows) appear green. Bottom: Representative sequence of DCE MR images obtained before (image frame N = 1) and after bolus injection of the contrast agent gadodiamide (image frames N = 3, N = 5, N = 7, N = 9, and N = 11).
Effect on Adventitial Vasa Vasorum
After 12 months of intensive lipid therapy, a significant reduction compared with the baseline value was observed in adventitial Ktrans (0.067 min−1 ± 0.028 for 12 months vs 0.085 min−1 ± 0.037 for baseline, P=.02) (Fig 2). Individual changes in adventitial Ktrans from baseline to 12 months are presented in Figures 3 and 4. A reduction in adventitial vp was also observed, although this trend was not significant (5.9% ± 2.4 for 12 months vs 6.8% ± 3.0 for baseline, P=.3). A significant Spearman correlation (ρ=0.835; 95% CI: 0.681, 0.941; P < .001) was observed between baseline Ktrans and vp. In addition, the change in vp over 12 months was significantly correlated with the change in Ktrans (ρ=0.839; 95% CI: 0.644, 0.938; P < .001).
Figure 2:

Change in adventitial Ktrans before and after treatment for 1 year.
Figure 3:

Individual changes in adventitial Ktrans from baseline to year 1. Each line represents one subject (n = 28).
Figure 4:

Vasa vasorum images in a 63-year-old man with hypertension. Adventitial Ktrans was 0.129 min−1 before therapy and 0.099 min−1 after 1- year treatment. There was subtle gradation of color in adventitial zone (arrows).
Relationship between Adventitial Ktrans and HsCRP, High-Density Lipoprotein Cholesterol, and Lipid-Rich Necrotic Core
For the 28 subjects, the effects of intensive lipid therapy induced a significant reduction in the mean HsCRP level of 38% (1.8 mg/L [17.1 nmol/L] to 1.1 mg/L [10.5 nmol/L], P=.007), and the size of the lipid-rich necrotic core decreased by 16.7% (20.8 mm3 to 17.3 mm3, P=.04). After 1 year of study therapy, on average, low-density lipoprotein cholesterol level was decreased by 38.4% (151 mg/dL [3.9 mmol/L] to 93 mg/dL [2.4 mmol/L], P < .001) and high-density lipoprotein cholesterol level was increased by 15.9% (42 mg/dL [1.09 mmol/L] to 48 mg/dL [1.24 mmol/L], P < .001).
There was no significant Spearman correlation at baseline between adventitial Ktrans and other variables, such as baseline HsCRP levels (ρ=−0.16; 95% CI: −0.53, 0.22; P=.4), baseline high-density lipoprotein cholesterol level (ρ=−0.16; 95% CI: −0.53, 0.22; P=.4), or baseline lipid-rich necrotic core size (ρ=−0.34; 95% CI: −0.68, 0.14; P=.08). Finally, there was no significant correlation between the change in adventitial Ktrans and the change in either HsCRP (ρ=−0.27; 95% CI: −0.59, 0.12; P = .2) or lipid-rich necrotic core size (ρ=0.08; 95% CI: −0.53, 0.22; P=.7) (Fig 5).
Figure 5a:

Associations between change in Ktrans and change in (a) lipid-rich necrotic core size or (b) HsCRP levels. Change in Ktrans showed no correlation with change in HsCRP levels (ρ = −0.27, P = .2) or lipid-rich necrotic core size (ρ = 0.08, P = .7).
Figure 5b:

Associations between change in Ktrans and change in (a) lipid-rich necrotic core size or (b) HsCRP levels. Change in Ktrans showed no correlation with change in HsCRP levels (ρ = −0.27, P = .2) or lipid-rich necrotic core size (ρ = 0.08, P = .7).
Discussion
The results of this study demonstrate that intensive lipid therapy is associated with a significant alteration of adventitial Ktrans measured by DCE MR imaging among patients with at least a 2-mm or greater wall thickness. The reduction of adventitial Ktrans suggests that neovessels arising from the adventitia are reduced in volume, permeability, or both by using lipid therapy. In addition, the reduction of Ktrans appeared to be unrelated to attenuation of HsCRP and lipid-rich necrotic core size, suggesting that DCE MR imaging may be an alternative and independent method for assessing therapeutic effects on carotid artery atherosclerosis.
Investigators in previous DCE MR imaging studies of atherosclerosis, to date, have measured vp and Ktrans through kinetic modeling. The parameter vp is simply interpreted as the fraction of the total volume that is plasma and has been shown to correlate with histologically measured microvessel densities (10). On the other hand, Ktrans has a more complex interpretation that depends on both the microvessel density and permeability. In a permeability-limited state, Ktrans is interpreted as the mathematical product of vessel surface area and permeability (13). Despite the more complex interpretation, Ktrans has emerged as the most common parameter to describe DCE MR imaging kinetics, and in atherosclerosis, Ktrans is associated not only with microvessel density but also with factors such as macrophage density that influence microvessel permeability (11).
The mechanism for therapeutic effects on adventitial vasa vasorum is uncertain. Researchers in other studies (26–29) documented antiinflammatory activities of statins in atherosclerosis. Niacin favorably affects high-density lipoprotein cholesterol, which is capable of inhibiting vascular inflammation by decreasing monocyte and macrophage adhesion and accumulation (30). Either alone or combined with niacin, atorvastatin may reduce macrophage content, leading to reduced neovessel signaling and regression of vasa vasorum. Wilson et al (15) found that a statin attenuated the increase in vasa vasorum density in coronary arteries of female crossbred pigs. Alternatively, statins may directly inhibit vasa vasorum neovascularization, reducing macrophage accumulation (31). In inflammation, neovessels dilate and increase their permeability, which allows extravasation of red blood cells from leaky neovessels, thereby attracting macrophages to the field (4,32).
Although we used DCE MR imaging in this study, the study also conceptually supports the potential to use contrast-enhanced US with microbubbles for monitoring therapeutic response of the vasa vasorum. Highly echogenic microbubbles passing through the vasa vasorum are readily visualized at contrast-enhanced US (33,34). Quantitative and qualitative assessments of US enhancement have been shown to correlate with histologically quantified microvessel density (35–37). Thus, contrast-enhanced US might be capable of showing therapeutic changes in the vasa vasorum in a manner similar to the way DCE MR imaging shows them. An important caveat, however, is that the DCE MR imaging technique used here is sensitive to changes in both microvessel density and permeability, whereas US microbubbles have targeted microvessel density alone. In addition, the choice between imaging methods is influenced by the greater spatial and temporal resolution of US versus the greater spatial coverage and flexibility of viewing planes in MR imaging. In this investigation, the DCE MR imaging approach was integrated into our current MR imaging protocol for characterization of carotid plaque morphologic characteristics and composition, thereby allowing assessment of the vasa vasorum during the same imaging session. The additional capability of MR imaging to be used to monitor changes in plaque morphologic characteristics and composition has previously been validated (38,39) and shown in clinical studies to enable detection of lesion changes (40,41).
In addition to showing reduction of adventitial Ktrans, this study also showed reduction of lipid-rich necrotic core area, as observed in other evaluations of lipid-lowering therapy (40,42). Similar results have previously been reported for the entire Carotid Plaque Composition cohort (43). An interesting question is whether a temporal relationship exists between lipid depletion and vasa vasorum regression. Investigators in previous experimental studies found that vasa vasorum provides a pathway for not only lipid deposition (44) but reverse lipid transport, contributing to active efflux of plaque lipoproteins from the intima through the adventitia (4,45). This activity is followed by neovessel regression and return of flow across the vasa vasorum to normal values (14). Although this study is underpowered to understand the temporal relationship between lipid depletion and vasa vasorum regression, the DCE MR imaging method could be used in future in vivo studies to address temporal relationships with multiple times.
One limitation of this study was that the current kinetic modeling algorithm for measuring Ktrans required a minimum of a 2-mm thickness of the carotid arterial wall, precluding the evaluation in those arteries with thinner walls. Thus, our conclusions may not apply to arteries with minimal lesions. Nevertheless, previous studies have demonstrated that advanced plaques containing a lipid-rich necrotic core, which may be of greatest therapeutic interest, are associated with thickened walls (>1.5 mm) (46,47). In our study, we observed a high concordance between lipid-rich necrotic cores and wall thicknesses in excess of 2 mm. The major difficulty encountered with the use of bright-blood DCE MR imaging is the signal influence from the hyperintense image appearance of the lumen adjacent to a small lesion. Improved techniques, such as black-blood DCE MR imaging, may help overcome the limitation of wall thickness.
An additional limitation of this study is that a number of simplistic assumptions in regard to contrast agent kinetics were made in this investigation, including assumption of a linear relationship between concentration and signal intensity and the absence of agent efflux in the Patlak model. From a physiologic perspective, we did not control for factors, such as hematocrit level, that can affect plasma concentration, nor did we assess the natural variability of perfusion characteristics over short time periods. Nevertheless, the techniques used here have been shown to be strongly associated with plaque pathologic findings despite these limitations (10–12). The development of new techniques that account for these additional factors could further improve DCE MR imaging as a tool for monitoring therapeutic effects in atherosclerosis.
In conclusion, our finding that intensive lipid therapy is associated with a significant reduction in Ktrans by 12 months, as measured by DCE MR imaging, is consistent with the hypothesis that intensive lipid therapy is associated with reduction in the extent and permeability of the vasa vasorum. Such reduction is thought to be part of the antiinflammatory mechanism of lipid therapy. The results of this study suggest that DCE MR imaging may be a useful imaging method and Ktrans may prove to be an imaging marker for the assessment of therapeutic response of the vasa vasorum to intensive lipid therapy in patients with atherosclerotic plaque.
Advances in Knowledge.
Intensive lipid therapy is associated with a significant reduction in the transfer constant (Ktrans) within 12 months of onset of treatment, as measured by using dynamic contrast-enhanced MR imaging of the carotid artery.
Reduction in Ktrans occurs independent of change in lipid core size or change in C-reactive protein level in the short term.
Implication for Patient Care.
Ktrans may prove to be an imaging marker for the assessment of therapeutic response of the vasa vasorum in patients with atherosclerotic plaque.
Disclosures of Potential Conflicts of Interest: L.D. No potential conflicts of interest to disclose. W.S.K. Financial activities related to the present article: Pfizer, Abbott, and Daiichi-Sankyo provided medications for the study. Financial activities not related to the present article: is a part-time employee of VPDiagnostics, and has multiple software patents licensed to VPDiagnostics. Other relationships: none to disclose. H.C. Financial activities related to the present article: Pfizer, Abbott, and Daiichi-Sankyo provided medications for the study. Financial activities not related to the present article: none to disclose. Other relationships: none to disclose. B.C. No potential conflicts of interest to disclose. H.R.U. No potential conflicts of interest to disclose. M.B.N. No potential conflicts of interest to disclose. T.S.H. Financial activities related to the present article: none to disclose. Financial activities not related to the present article: received grants for effort on clinical trial from KOWA and Hoffmann-LaRoche and receives royalties as co-editor of a book on carotid imaging from Cambridge University Press. Other relationships: none to disclose. C.Y. Financial activities related to the present article: received a grant from Philips. Financial activities not related to the present article: receives consultancy fees from BG Medicine. Other relationships: none to disclose. X.Q.Z. Financial activities related to the present article: received grants from Pfizer, Abbott, and Daiichi-Sankyo. Financial activities not related to the present article: receives payment for lectures including service on speakers bureaus from Abbott and Pfizer. Other relationships: none to disclose.
Acknowledgments
Thanks to Duane A. Monick, MD, Yakima Heart Center, Yakima, Wash, and Colin D. Lee, MD, Idaho Cardiology Associates, Boise, Idaho, for their contribution of referring patients to this study.
Received June 28, 2010; revision requested August 4; final revision received February 14, 2011; accepted February 17; final version accepted February 25.
Supported in part by Pfizer.
Funding: This research was supported by the National Heart, Lung, and Blood Institute (grant R01 HL63895).
Abbreviations:
- CI
- confidence interval
- DCE
- dynamic contrast material enhanced
- HsCRP
- high-sensitivity C-reactive protein
- Ktrans
- transfer constant
- vp
- fractional plasma volume
References
- 1.Kwon HM, Sangiorgi G, Ritman EL, et al. Enhanced coronary vasa vasorum neovascularization in experimental hypercholesterolemia. J Clin Invest 1998;101(8):1551–1556 [DOI] [PMC free article] [PubMed] [Google Scholar]
- 2.Barger AC, Beeuwkes R, 3rd, Lainey LL, Silverman KJ. Hypothesis: vasa vasorum and neovascularization of human coronary arteries: a possible role in the pathophysiology of atherosclerosis. N Engl J Med 1984;310(3):175–177 [DOI] [PubMed] [Google Scholar]
- 3.Virmani R, Kolodgie FD, Burke AP, et al. Atherosclerotic plaque progression and vulnerability to rupture: angiogenesis as a source of intraplaque hemorrhage. Arterioscler Thromb Vasc Biol 2005;25(10):2054–2061 [DOI] [PubMed] [Google Scholar]
- 4.Moreno PR, Purushothaman KR, Sirol M, Levy AP, Fuster V. Neovascularization in human atherosclerosis. Circulation 2006;113(18):2245–2252 [DOI] [PubMed] [Google Scholar]
- 5.Magnoni M, Coli S, Marrocco-Trischitta MM, et al. Contrast-enhanced ultrasound imaging of periadventitial vasa vasorum in human carotid arteries. Eur J Echocardiogr 2009;10(2):260–264 [DOI] [PubMed] [Google Scholar]
- 6.Herrmann J, Lerman LO, Rodriguez-Porcel M, et al. Coronary vasa vasorum neovascularization precedes epicardial endothelial dysfunction in experimental hypercholesterolemia. Cardiovasc Res 2001;51(4):762–766 [DOI] [PubMed] [Google Scholar]
- 7.Libby P, Ridker PM, Maseri A. Inflammation and atherosclerosis. Circulation 2002;105(9):1135–1143 [DOI] [PubMed] [Google Scholar]
- 8.Maiellaro K, Taylor WR. The role of the adventitia in vascular inflammation. Cardiovasc Res 2007;75(4):640–648 [DOI] [PMC free article] [PubMed] [Google Scholar]
- 9.Kolodgie FD, Gold HK, Burke AP, et al. Intraplaque hemorrhage and progression of coronary atheroma. N Engl J Med 2003;349(24):2316–2325 [DOI] [PubMed] [Google Scholar]
- 10.Kerwin W, Hooker A, Spilker M, et al. Quantitative magnetic resonance imaging analysis of neovasculature volume in carotid atherosclerotic plaque. Circulation 2003;107(6):851–856 [DOI] [PubMed] [Google Scholar]
- 11.Kerwin WS, O’Brien KD, Ferguson MS, Polissar N, Hatsukami TS, Yuan C. Inflammation in carotid atherosclerotic plaque: a dynamic contrast-enhanced MR imaging study. Radiology 2006;241(2):459–468 [DOI] [PMC free article] [PubMed] [Google Scholar]
- 12.Kerwin WS, Oikawa M, Yuan C, Jarvik GP, Hatsukami TS. MR imaging of adventitial vasa vasorum in carotid atherosclerosis. Magn Reson Med 2008;59(3):507–514 [DOI] [PubMed] [Google Scholar]
- 13.Tofts PS, Brix G, Buckley DL, et al. Estimating kinetic parameters from dynamic contrast-enhanced T(1)-weighted MRI of a diffusable tracer: standardized quantities and symbols. J Magn Reson Imaging 1999;10(3):223–232 [DOI] [PubMed] [Google Scholar]
- 14.Williams JK, Sukhova GK, Herrington DM, Libby P. Pravastatin has cholesterol-lowering independent effects on the artery wall of atherosclerotic monkeys. J Am Coll Cardiol 1998;31(3):684–691 [DOI] [PubMed] [Google Scholar]
- 15.Wilson SH, Herrmann J, Lerman LO, et al. Simvastatin preserves the structure of coronary adventitial vasa vasorum in experimental hypercholesterolemia independent of lipid lowering. Circulation 2002;105(4):415–418 [DOI] [PubMed] [Google Scholar]
- 16.Zhao XQ, Phan BA, Chu B, et al. Testing the hypothesis of atherosclerotic plaque lipid depletion during lipid therapy by magnetic resonance imaging: study design of Carotid Plaque Composition study. Am Heart J 2007;154(2):239–246 [DOI] [PubMed] [Google Scholar]
- 17.Yuan C, Kerwin WS, Yarnykh VL, et al. MRI of atherosclerosis in clinical trials. NMR Biomed 2006;19(6):636–654 [DOI] [PubMed] [Google Scholar]
- 18.Kerwin W, Xu D, Liu F, et al. Magnetic resonance imaging of carotid atherosclerosis: plaque analysis. Top Magn Reson Imaging 2007;18(5):371–378 [DOI] [PubMed] [Google Scholar]
- 19.Saam T, Ferguson MS, Yarnykh VL, et al. Quantitative evaluation of carotid plaque composition by in vivo MRI. Arterioscler Thromb Vasc Biol 2005;25(1):234–239 [DOI] [PubMed] [Google Scholar]
- 20.Cai J, Hatsukami TS, Ferguson MS, et al. In vivo quantitative measurement of intact fibrous cap and lipid-rich necrotic core size in atherosclerotic carotid plaque: comparison of high-resolution, contrast-enhanced magnetic resonance imaging and histology. Circulation 2005;112(22):3437–3444 [DOI] [PubMed] [Google Scholar]
- 21.Toussaint JF, LaMuraglia GM, Southern JF, Fuster V, Kantor HL. Magnetic resonance images lipid, fibrous, calcified, hemorrhagic, and thrombotic components of human atherosclerosis in vivo. Circulation 1996;94(5):932–938 [DOI] [PubMed] [Google Scholar]
- 22.Chu B, Kampschulte A, Ferguson MS, et al. Hemorrhage in the atherosclerotic carotid plaque: a high-resolution MRI study. Stroke 2004;35(5):1079–1084 [DOI] [PubMed] [Google Scholar]
- 23.Kerwin WS, Cai J, Yuan C. Noise and motion correction in dynamic contrast-enhanced MRI for analysis of atherosclerotic lesions. Magn Reson Med 2002;47(6):1211–1217 [DOI] [PubMed] [Google Scholar]
- 24.Patlak CS, Blasberg RG, Fenstermacher JD. Graphical evaluation of blood-to-brain transfer constants from multiple-time uptake data. J Cereb Blood Flow Metab 1983;3(1):1–7 [DOI] [PubMed] [Google Scholar]
- 25.Davison AC, Hinkley DV. Bootstrap methods and their application. Cambridge, England: Cambridge University Press, 1997 [Google Scholar]
- 26.Ridker PM, Danielson E, Fonseca FA, et al. Rosuvastatin to prevent vascular events in men and women with elevated C-reactive protein. N Engl J Med 2008;359(21):2195–2207 [DOI] [PubMed] [Google Scholar]
- 27.Hanefeld M, Marx N, Pfützner A, et al. Anti-inflammatory effects of pioglitazone and/or simvastatin in high cardiovascular risk patients with elevated high sensitivity C-reactive protein: the PIOSTAT study. J Am Coll Cardiol 2007;49(3):290–297 [DOI] [PubMed] [Google Scholar]
- 28.Kinlay S, Schwartz GG, Olsson AG, et al. Inflammation, statin therapy, and risk of stroke after an acute coronary syndrome in the MIRACL study. Arterioscler Thromb Vasc Biol 2008;28(1):142–147 [DOI] [PubMed] [Google Scholar]
- 29.Tang TY, Howarth SP, Miller SR, et al. The ATHEROMA (Atorvastatin Therapy: Effects on Reduction of Macrophage Activity) study: evaluation using ultrasmall superparamagnetic iron oxide-enhanced magnetic resonance imaging in carotid disease. J Am Coll Cardiol 2009;53(22):2039–2050 [DOI] [PubMed] [Google Scholar]
- 30.Kamanna VS, Kashyap ML. Mechanism of action of niacin. Am J Cardiol 2008;101(8A):20B–26B [DOI] [PubMed] [Google Scholar]
- 31.Moulton KS, Vakili K, Zurakowski D, et al. Inhibition of plaque neovascularization reduces macrophage accumulation and progression of advanced atherosclerosis. Proc Natl Acad Sci U S A 2003;100(8):4736–4741 [DOI] [PMC free article] [PubMed] [Google Scholar]
- 32.Costa C, Incio J, Soares R. Angiogenesis and chronic inflammation: cause or consequence? Angiogenesis 2007;10(3):149–166 [DOI] [PubMed] [Google Scholar]
- 33.Granada JF, Feinstein SB. Imaging of the vasa vasorum. Nat Clin Pract Cardiovasc Med 2008;5(suppl 2):S18–S25 [DOI] [PubMed] [Google Scholar]
- 34.Staub D, Schinkel AF, Coll B, et al. Contrast-enhanced ultrasound imaging of the vasa vasorum: from early atherosclerosis to the identification of unstable plaques. JACC Cardiovasc Imaging 2010;3(7):761–771 [DOI] [PubMed] [Google Scholar]
- 35.Coli S, Magnoni M, Sangiorgi G, et al. Contrast-enhanced ultrasound imaging of intraplaque neovascularization in carotid arteries: correlation with histology and plaque echogenicity. J Am Coll Cardiol 2008;52(3):223–230 [DOI] [PubMed] [Google Scholar]
- 36.Schinkel AF, Krueger CG, Tellez A, et al. Contrast-enhanced ultrasound for imaging vasa vasorum: comparison with histopathology in a swine model of atherosclerosis. Eur J Echocardiogr 2010;11(8):659–664 [DOI] [PubMed] [Google Scholar]
- 37.Moguillansky D, Leng X, Carson A, et al. Quantification of plaque neovascularization using contrast ultrasound: a histologic validation. Eur Heart J 2011;32(5):646–653 [DOI] [PMC free article] [PubMed] [Google Scholar]
- 38.Takaya N, Cai J, Ferguson MS, et al. Intra- and interreader reproducibility of magnetic resonance imaging for quantifying the lipid-rich necrotic core is improved with gadolinium contrast enhancement. J Magn Reson Imaging 2006;24(1):203–210 [DOI] [PubMed] [Google Scholar]
- 39.Saam T, Hatsukami TS, Yarnykh VL, et al. Reader and platform reproducibility for quantitative assessment of carotid atherosclerotic plaque using 1.5T Siemens, Philips, and General Electric scanners. J Magn Reson Imaging 2007;26(2):344–352 [DOI] [PubMed] [Google Scholar]
- 40.Underhill H, Yuan C, Zhao X, et al. Effect of rosuvastatin therapy on carotid plaque morphology and composition in moderately hypercholesterolemic patients: a high-resolution magnetic resonance imaging trial. Am Heart J 2008;155(3):e1–e8 [Published correction appears in Am Heart J 2008;155(6):1127.] [DOI] [PubMed] [Google Scholar]
- 41.Corti R, Fuster V, Fayad ZA, et al. Lipid lowering by simvastatin induces regression of human atherosclerotic lesions: two years’ follow-up by high-resolution noninvasive magnetic resonance imaging. Circulation 2002;106(23):2884–2887 [DOI] [PubMed] [Google Scholar]
- 42.Nasu K, Tsuchikane E, Katoh O, et al. Effect of fluvastatin on progression of coronary atherosclerotic plaque evaluated by virtual histology intravascular ultrasound. JACC Cardiovasc Interv 2009;2(7):689–696 [DOI] [PubMed] [Google Scholar]
- 43.Zhao XQ, Dong L, Hatsukami TS, et al. Magnetic resonance imaging of the plaque lipid depletion during lipid therapy: a prospective assessment of efficacy and time-course—a late breaking clinical trial report. Presented at the 58th annual meeting of the American College of Cardiology, Orlando, Fla, March 28–31, 2009 [Google Scholar]
- 44.Jeziorska M, Woolley DE. Local neovascularization and cellular composition within vulnerable regions of atherosclerotic plaques of human carotid arteries. J Pathol 1999;188(2):189–196 [DOI] [PubMed] [Google Scholar]
- 45.Ritman EL, Lerman A. The dynamic vasa vasorum. Cardiovasc Res 2007;75(4):649–658 [DOI] [PMC free article] [PubMed] [Google Scholar]
- 46.Wasserman BA, Sharrett AR, Lai S, et al. Risk factor associations with the presence of a lipid core in carotid plaque of asymptomatic individuals using high-resolution MRI: the multi-ethnic study of atherosclerosis (MESA). Stroke 2008;39(2):329–335 [DOI] [PubMed] [Google Scholar]
- 47.Wagenknecht L, Wasserman B, Chambless L, et al. Correlates of carotid plaque presence and composition as measured by MRI: the Atherosclerosis Risk in Communities study. Circ Cardiovasc Imaging 2009;2(4):314–322 [DOI] [PMC free article] [PubMed] [Google Scholar]