

The radiopharmaceutical agent 18F-FPPRGD2 has desirable pharmacokinetic and biodistribution properties, with the latter favoring PET applications in the head, neck, thorax, and extremities.
Abstract
Purpose:
To assess the safety, biodistribution, and dosimetric properties of the positron emission tomography (PET) radiopharmaceutical agent fluorine 18 (18F) FPPRGD2 (2-fluoropropionyl labeled PEGylated dimeric RGD peptide [PEG3-E{c(RGDyk)}2]), which is based on the dimeric arginine-glycine–aspartic acid (RGD) peptide sequence and targets αvβ3 integrin, in the first volunteers imaged with this tracer.
Materials and Methods:
The protocol was approved by the institutional review board, and written informed consent was obtained from all participants. Five healthy volunteers underwent whole-body combined PET–computed tomography 0.5, 1.0, 2.0, and 3.0 hours after tracer injection (mean dose, 9.5 mCi ± 3.4 [standard deviation] [351.5 MBq ± 125.8]; mean specific radioactivity, 1200 mCi/mmol ± 714 [44.4 GBq/mmol ± 26.4]). During this time, standard vital signs, electrocardiographic (ECG) readings, and blood sample values (for chemistry, hematologic, and liver function tests) were checked at regular intervals and 1 and 7 days after the injection. These data were used to evaluate tracer biodistribution and dosimetric properties, time-activity curves, and the stability of laboratory values. Significant changes in vital signs and laboratory values were evaluated by using a combination of population-averaged generalized estimating equation regression and exact paired Wilcoxon tests.
Results:
The administration of 18F-FPPRGD2 was well tolerated, with no marked effects on vital signs, ECG readings, or laboratory values. The tracer showed the same pattern of biodistribution in all volunteers: primary clearance through the kidneys (0.360 rem/mCi ± 0.185 [0.098 mSv/MBq ± 0.050]) and bladder (0.862 rem/mCi ± 0.436 [0.233 mSv/MBq ± 0.118], voiding model) and uptake in the spleen (0.250 rem/mCi ± 0.168 [0.068 mSv/MBq ± 0.046]) and large intestine (0.529 rem/mCi ± 0.236 [0.143 mSv/MBq ± 0.064]). The mean effective dose of 18F-FPPRGD2 was 0.1462 rem/mCi ± 0.0669 (0.0396 mSv/MBq ± 0.0181). With an injected dose of 10 mCi (370 MBq) and a 1-hour voiding interval, a patient would be exposed to an effective radiation dose of 1.5 rem (15 mSv). Above the diaphragm, there was minimal uptake in the brain ventricles, salivary glands, and thyroid gland. Time-activity curves showed rapid clearance from the vasculature, with a mean 26% ± 17 of the tracer remaining in the circulation at 30 minutes and most of the activity occurring in the plasma relative to cells (mean whole blood–plasma ratio, 0.799 ± 0.096).
Conclusion:
18F-FPPRGD2 has desirable pharmacokinetic and biodistribution properties. The primary application is likely to be PET evaluation of oncologic patients—especially those with brain, breast, or lung cancer. Specific indications may include tumor staging, identifying patients who would benefit from antiangiogenesis therapy, and separating treatment responders from nonresponders early.
© RSNA, 2011
Supplemental material: http://radiology.rsna.org/lookup/suppl/doi:10.1148/radiol.11101139/-/DC1
Introduction
Angiogenesis is essential for tumor growth and progression (1,2). Inhibition of angiogenesis has been shown in various experimental models to prevent tumor growth and even cause tumor regression (3,4). The expression of the cell adhesion molecule αvβ3 integrin on sprouting capillary cells and the interaction of αvβ3 integrin with specific matrix ligands have been shown to play a key role in tumor angiogenesis (5) and metastasis (6), and the αvβ3 integrin is a potential target for antiangiogenic therapy (7).
The ability to noninvasively visualize and quantify αvβ3 integrin expression via arginine-glycine–aspartic acid (RGD) peptide sequence levels will provide new opportunities to document tumor integrin levels, more appropriately select patients who are candidates for antiangiogenic treatment, and monitor treatment effectiveness in patients with integrin-positive findings (8). A variety of modalities have been used to image integrins. Contrast material–enhanced ultrasonography with microbubbles targeted to αv integrins expressed on the neovascular endothelium has been used to image the tumor integrin status in addition to the tumor microvascular blood volume and the blood velocity (9–12). With use of an animal model, Sipkins et al (13) demonstrated that it is feasible to image αvβ3 integrin expression by using magnetic resonance (MR) imaging and antibody-coated paramagnetic liposomes. It has also been shown that the near-infrared fluorescent dye–conjugated cyclic RGD peptide sequence could enable visualization of subcutaneously inoculated integrin-positive tumors (14,15). However, to date, most of the studies have been focused on the development of suitably radiolabeled small RGD peptide antagonists of αv integrin that can serve as radiopharmaceutical agents for single photon emission computed tomography (SPECT) and positron emission tomography (PET) applications (8). Owing to the higher sensitivity of PET, as compared with SPECT (16), the development of probes for PET imaging of integrin expression has been the mainstay of continued efforts.
Instead of introducing an amino sugar moiety to increase the hydrophilicity (17–19), we previously inserted an amphiphilic polyethylene glycol linker (PEGylation), and this resulted in improved pharmacokinetics (20,21). However, PEGylation also reduced the receptor binding affinity of the RGD peptide sequence. We then applied a polyvalency effect to develop dimeric and multimeric RGD peptide sequences (22–28), with repeating cyclic pentapeptide units connected by glutamates. Fluorine 18 (18F) FPPRGD2 (phenylalanine-proline-proline-arginine-glycine–aspartic acid) is a PET radiopharmaceutical agent based on the dimeric RGD peptide sequence, and it targets αvβ3 integrin (Fig 1). In several tumor xenograft models, we confirmed that 18F-FPPRGD2 is superior to 18F galacto–RGD in terms of tumor-targeting effectiveness (tumor-to-background ratio) and in vivo pharmacokinetics (29).
Figure 1:

Chemical structure of 18F-FPPRGD2. Arg = arginine, Asp = aspartic acid, Gly = glycine, Lys = lysine.
On the basis of these favorable preclinical study results and the potential specificity of imaging angiogenesis (ie, αvβ3 integrin expression) for a variety of oncologic and nononcologic applications, a Food and Drug Administration emergency investigational new drug application (eIND 104150) was obtained for further evaluation of 18F-FPPRGD2. The purpose of this pilot study was to assess the safety, biodistribution, and dosimetric properties of 18F-FPPRGD2 in the first volunteers imaged with this tracer.
Materials and Methods
18F-FPPRGD2 was synthesized under good manufacturing practice conditions. The single-dose acute toxicity of a structurally similar compound, 18F-FPRGD2 (fluorobenzoate labeled PEGylated dimeric RDG peptide [PEG3-E{c(RDGyk)}2), was tested by using Sprague-Dawley rats (Harlan, Hayward, Calif) under good laboratory practice–like conditions, and the emergency investigational new drug application was submitted to include both FPRGD2 and FPPRGD2.
Preparation of Reference Compound and 18F-FPPRGD2
Synthesis of the reference compound, fluorine 19–FPPRGD2, was performed according to previously published methods (29); the nuclear MR and mass spectrometry data collected were similar to the results of these methods. For preparation of 18F-FPPRGD2, first an 18F-synthon ([18F]-4-nitrophenyl-2-fluoropropionate, or 18F-NPE) was produced by means of nucleophilic 18F fluorination of methyl 2-bromopropionate, hydrolysis, and esterification at one-pot synthesis performed with a GE TRACERlab FXFN synthesizer (GE Healthcare, Waukesha, Wis). Subsequently, the conjugation between 18F-NPE and the RGD dimeric peptide (PEG3-c [RGDyK]2) was performed in a customized module to yield 18F-FPPRGD2 with a specific mean radioactivity level of 1200 mCi/mmol ± 714 (44.4 GBq/mmol ± 26.4). This agent had greater than 99% radiochemical purity and greater than 90% chemical purity (Fig 1). More details about the radiosynthesis and quality control process are described elsewhere (30,31).
Volunteers and Collection of Nonimaging Data for Biosafety
The protocol was approved by the institutional review board, and written informed consent was obtained from all five volunteer participants. They were recruited between August 2009 and October 2009 (Table 1). Volunteers older than 18 years with no known oncologic or notable nononcologic medical conditions were eligible for study inclusion. Not more than 6 months before the start of the study, all volunteers submitted physical examination and laboratory results documenting their healthy status. Not more than 1 day before they were injected with 18F-FPPRGD2, all female volunteers underwent serum pregnancy tests, with documented negative results.
Table 1.
Demographic and 18F-FPPRGD2 Dose Data
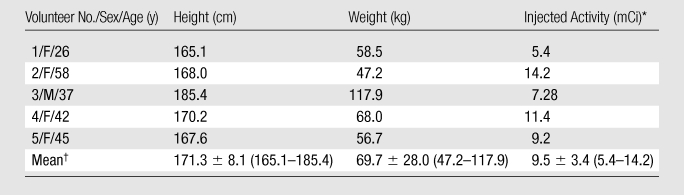
To convert to megabecquerels, multiply by 37.
Data are mean values ± standard deviations, with ranges in parentheses. The volunteers had a mean age of 41.6 years ± 11.7 (range, 26–58 years).
To mimic the preparation that future clinical patients might have, no specific subject preparation (eg, fasting, hydration) was requested on the day of imaging. One volunteer needed to take 1 mg of lorazepam sublingually before undergoing imaging owing to claustrophobia. The 18F-FPPRGD2 was injected as a bolus within 30 seconds. A range of 5.4–14.2 mCi (199.8–525.4 MBq) was injected because the radiochemistry yields for this radiopharmaceutical agent were variable (Table 1). Immediately afterward, each volunteer’s vital signs (ie, heart rate, pulse oximetry value, body temperature, and blood pressure) were monitored every 15 minutes during the imaging procedure and for up to 3 hours after the injection by using an automated machine (Vital Signs Monitor; Welch Allyn, Skaneateles Falls, NY). The volunteers also underwent a 12-lead electrocardiographic examination (Burdick Eclipse Plus; Cardiac Science, Bothell, Wash) at the same frequency. The electrocardiographic and vital sign data were reviewed by a nuclear medicine physician (E.S.M.). A 5-mL blood sample was obtained just before the tracer injection for laboratory tests (Table E1 [online]), and 1-mL blood samples were obtained throughout the imaging period—specifically at 1, 3, 5, 10, 30, 60, 90, 120, 150, and 180 minutes after the injection—for time-activity curve calculations. Vital signs were checked and blood samples (5 mL) were also obtained on days 1 and 7 after the injection to ensure that there were no changes or abnormalities. Any unusual or adverse symptoms were recorded on the day of imaging and during the follow-up period. In addition, the subjects were asked to void before the start of each imaging examination.
The preinjection and follow-up blood samples were assessed for full chemistry, hematology, and liver function tests, as detailed in Table E1 (online). The smaller blood samples collected during imaging were analyzed in a well counter (Wallac Wizard 1470 Automatic Gamma Counter; Perkin Elmer, Waltham, Mass) to measure the photon counts per minute emitted from both the whole blood sample and the plasma portion only. To determine the biologic clearance of 18F-FPPRGD2, the activity was decay corrected to the injection time and time-activity curves were constructed. Note that tracer metabolites were not analyzed because pilot studies revealed greater than 95% stability when the tracer was incubated with human plasma for 2 hours (data not shown). These metabolites will be studied in future investigations on cancer patients.
PET Imaging and Reconstruction Procedure
In all subjects, imaging was performed on a GE Discovery LS PET/CT scanner (GE Healthcare) in the two-dimensional mode. Because institutional review board approval for examining the first volunteer was more limited at the time of imaging, she only underwent one total-body (from vertex to toes) combined PET–computed tomographic (CT) examination 1 hour after tracer administration. The four subsequent volunteers underwent a serial examination involving a total of four PET scans and one PET/CT scan acquired after the tracer injection. The PET scans were acquired 0, 30, 120, and 180 minutes after the injection by using six bed positions (from skull base to middle of thigh), 3-minute emission scans, and 1-minute transmission scans with a germanium rod source for attenuation correction. The PET/CT scan was acquired 1 hour after the injection by using a total of 11 bed positions (from vertex to toes) and 3-minute emission scans. The CT parameters used included a fixed amperage setting of 90 mA and a peak voltage of 140 kVp with a 5-mm reconstruction interval. In this case, the CT transmission data were used for attenuation correction and anatomic localization of the PET information. The PET scans were reconstructed by using an ordered subset expectation maximization algorithm and were reviewed in the axial, coronal, and sagittal planes. All reconstructions and image analyses were performed by using Xeleris, version 2.0551 (GE Healthcare), software.
Biodistribution and Dosimetry
Visual analysis was used to determine the general biodistribution of the radiopharmaceutical agent and the temporal and intersubject stability. Organ dosimetry values were calculated by using organ-level internal dose assessment software (Vanderbilt University, 2003) (32). Thresholded datasets were used to hand draw three-dimensional regions of interest over all of the major organs showing visually appreciable uptake greater than that in the background tissue (Table 2). The regions of interest were drawn in consensus (by E.S.M. and M.L.G., 3 and 30 years experience in nuclear medicine, respectively). Note that the CT information was not used to draw the regions of interest. Time-activity curves were constructed by using values of whole-organ activity at the time of imaging. These data were used to estimate the radiation doses absorbed by all of the organs. To determine the maximal dose of 18F-FPPRGD2 that can be safely injected into a patient, we used the residence time of the tracer in each organ for each volunteer to calculate his or her absorbed radiation dose.
Table 2.
Standardized Uptake Values Normalized to Weight for Various Organs
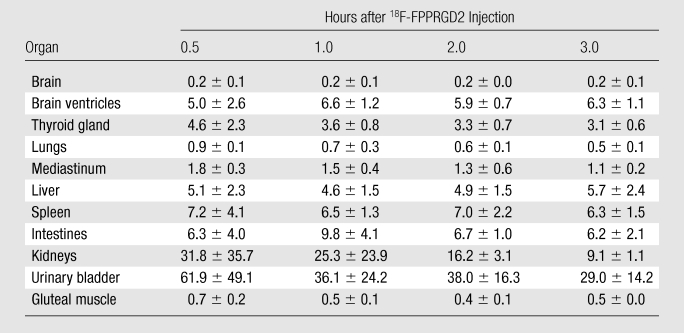
Note.—Data are mean standardized uptake values (in grams per milliliter) decay corrected to the time of tracer injection, ± standard deviations.
Statistical Analyses
To assess changes in vital signs during the first 3 hours (during the first day of imaging), a population-averaged generalized estimating equation regression analysis was performed by using the difference in the given value at baseline as the dependent variable and the log (minutes) and its square as dependent variables. Age and weight were included as covariates, and a lag-2 autoregressive correlation structure was used. To assess changes in a given vital sign at days 1 and 7, exact paired Wilcoxon tests were used to perform comparisons between the baseline measurements and the measurements obtained at a later time. Pre- and posttracer differences in laboratory values were tested with individual exact paired Wilcoxon tests by using the coin package in R, version 9.2 (www.r-project.org), program. P < .05 indicated a significant difference.
Results
Biosafety
The mean injected dose of 18F-FPPRGD2 was 9.5 mCi ± 3.4 (standard deviation) (351.5 MBq ± 125.8) (Table 1), and the mean specific radioactivity level was 1200 mCi/mmol ± 714 (44.4 GBq/mmol ± 26.4) at the end of the bombardment. As such, the mean mass of tracer injected into each subject was 8 pmol ± 5, or 12.9 ng ± 8.1.
No adverse symptoms (eg, rash, palpitations, headache, nausea) or signs were reported by the volunteers or noticed by the staff either immediately or up to 7 days after the administration of 18F-FPPRGD2. There were significant short-term changes in pulse (P = .011) and systolic and diastolic blood pressure (P < .001 for both) caused by sharp changes from the baseline that occurred during the first few minutes after the injection. These changes were followed by a gradual return to baseline values. There was no significant change (P = .181) in oxygen level. There were no long-term changes in any vital signs (P > .12 for all). Temporal variations in average heart rate, pulse oximetry, and blood pressure values are shown in Figure E1 (online). The electrocardiographic recordings of the five volunteers before and after the injection of 18F-FPPRGD2 were normal. Two subjects showed a normal sinus rhythm with baseline bradycardia, but no changes were seen after tracer administration. No individual tests of pre- versus posttracer differences in laboratory values yielded significant differences (Table E1 [online]), and, thus, no further adjustments for multiple comparisons were made.
Biodistribution and Dosimetry
Figure 2 shows the distribution of 18F-FPPRGD2 1 hour after intravenous tracer administration in a healthy volunteer, with the principal organs labeled. The corresponding transaxial CT and PET scans further show the tracer distribution in several key areas of the body. The combined PET image set in Figure 3 shows the temporal and intersubject stability of 18F-FPPRGD2. The areas of highest activity are the bladder, kidneys, liver, spleen, and bowel. There are no major differences visually aside from the normal intersubject variability expected with any radiopharmaceutical agents. As would be expected, the renal and hepatobiliary excretion rates are slightly different among the individuals, reflecting the moderate variability in uptake in these areas among subjects. One subject also had gallbladder uptake. Above the diaphragm, there is minimal radiotracer accumulation in the brain ventricles, salivary glands, and thyroid gland. Essentially no uptake is seen in the thorax and extremities. One volunteer had low-grade uptake in both breasts.
Figure 2:

A, Coronal maximum intensity projection PET image shows distribution of 18F-FPPRGD2 1 hour after intravenous administration in healthy volunteer (subject 1). Principal organs and regions of uptake are labeled: brain ventricles (1), salivary-oropharyngeal cavity (2), thyroid gland (3), lungs (4), liver (5), spleen (6), kidneys (7), bowel (8), and bladder (9). B, Corresponding axial CT (left) and PET (right) images further show distribution of 18F-FPPRGD2 at key levels in brain (top), thorax (middle), and upper abdomen (bottom). Principal organs and regions of uptake are labeled: brain ventricles, brain (10), lungs, liver, spleen, kidneys, heart (11), and stomach (12).
Figure 3a:

PET image sets show temporal and intersubject stability of 18F-FPPRGD2. All images are coronal views of maximum intensity projection images from PET examination. (a) Images show tracer uptake in 58-year-old women (volunteer 2) at five time points after 18F-FPPRGD2 injection. (b) Images show uptake differences among the five subjects 1 hour after injection. There is minimal variability in 18F-FPPRGD2 uptake over time and across subjects.
Figure 3b:

PET image sets show temporal and intersubject stability of 18F-FPPRGD2. All images are coronal views of maximum intensity projection images from PET examination. (a) Images show tracer uptake in 58-year-old women (volunteer 2) at five time points after 18F-FPPRGD2 injection. (b) Images show uptake differences among the five subjects 1 hour after injection. There is minimal variability in 18F-FPPRGD2 uptake over time and across subjects.
The average percentage of injected dose per gram of activity and the standardized uptake values in the organs involved in the clearance pathway and in some background tissues in all of the subjects are listed in Tables E2 (online) and 2, respectively. The low activity that was seen in most background tissues indicated low blood-pool activity and low retention of 18F-FPPRGD2 in cells that do not express αvβ3 integrin. The negligible activity in the brain likely reflects the inability of 18F-FPPRGD2 to cross the blood-brain barrier. However, all five subjects had stable uptake in the brain ventricles. Figure 4 shows the time-activity curves for four principal organs in all of the subjects. These activity data are not decay corrected.
Figure 4a:

Averaged time-activity curves indicate clearance of 18F-FPPRGD2 from (a) bladder, (b) intestines, (c) liver, and (d) kidneys and percentages of total injected activity in each organ versus time after tracer injection, for all healthy volunteers. Activity data are not decay corrected to the time of injection. Error bars indicate standard deviations.
Figure 4b:

Averaged time-activity curves indicate clearance of 18F-FPPRGD2 from (a) bladder, (b) intestines, (c) liver, and (d) kidneys and percentages of total injected activity in each organ versus time after tracer injection, for all healthy volunteers. Activity data are not decay corrected to the time of injection. Error bars indicate standard deviations.
Figure 4c:

Averaged time-activity curves indicate clearance of 18F-FPPRGD2 from (a) bladder, (b) intestines, (c) liver, and (d) kidneys and percentages of total injected activity in each organ versus time after tracer injection, for all healthy volunteers. Activity data are not decay corrected to the time of injection. Error bars indicate standard deviations.
Figure 4d:

Averaged time-activity curves indicate clearance of 18F-FPPRGD2 from (a) bladder, (b) intestines, (c) liver, and (d) kidneys and percentages of total injected activity in each organ versus time after tracer injection, for all healthy volunteers. Activity data are not decay corrected to the time of injection. Error bars indicate standard deviations.
The data in Table E2 (online), and Figure 4 show that there was a gradual decline in activity throughout all of the organs and regions studied. While this was true on average, two individuals had an initial increase in activity, followed by a pattern of decreasing uptake in the bowel—reflecting initial accumulation from hepatobiliary clearance followed by subsequent clearance. There was rapid clearance of the radiotracer from the blood circulation (Fig 5). At 30, 60, and 90 minutes after the injection, means of 26% ± 17, 18% ± 14, and 8% ± 2 of the tracer, respectively, remained in the circulation. The mean ratio of 18F-FPPRGD2 in whole blood to 18F-FPPRGD2 in the plasma portion across the 10 blood collection times after the injection was 0.799 ± 0.096, indicating that the majority of the tracer was in the plasma (Table 3).
Figure 5:

Time-activity curves for 18F-FPPRGD2 in whole blood (◆) and plasma (■), for all healthy volunteers. Error bars indicate standard deviations. 18F-FPPRGD2 clears from blood rapidly, with most activity in plasma portion.
Table 3.
Whole Blood–Plasma Uptake Ratios
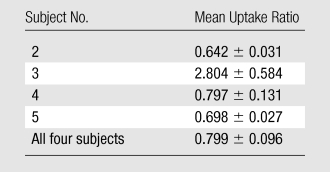
Note.—Data are mean ratios of 18F-FPPRGD2 uptake in whole blood to 18F-FPPRGD2 uptake in plasma, ± standard deviations.
The mean absorbed radiation doses for all organs in the four volunteers who had multiple scans are listed in Table 4. The bladder received the highest absorbed doses (mean absorbed dose, 0.862 rem/mCi ± 0.436 [0.233 mSv/MBq ± 0.118]), reflecting rapid clearance of most of the injected 18F-FPPRGD2 into the bladder. The other major organs that received relatively high doses were the lower region of the large intestine (mean absorbed dose, 0.529 rem/mCi ± 0.236 [0.143 mSv/MBq ± 0.064]), kidneys (mean absorbed dose, 0.360 rem/mCi ± 0.185 [0.098 mSv/MBq ± 0.050]), and spleen (mean absorbed dose, 0.250 rem/mCi ± 0.168 [0.068 mSv/MBq ± 0.046]). On the other hand, the thymus, skin, lungs, myocardium, bone marrow, and muscle absorbed the lowest doses.
Table 4.
18F-FPPRGD2 Dosimetric Data
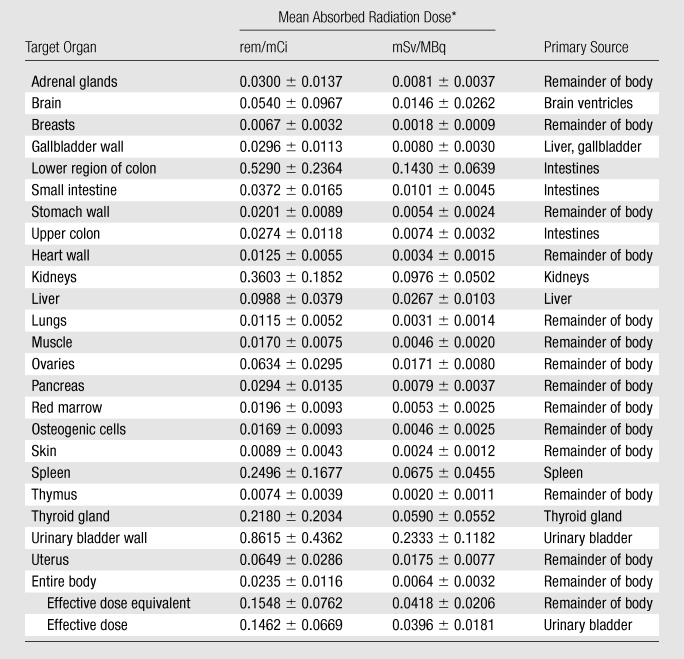
Data are mean absorbed radiation doses ± standard deviations.
The mean effective dose of 18F-FPPRGD2 was 0.1462 rem/mCi ± 0.0669 (0.0396 mSv/MBq ± 0.0181) (95% confidence interval: 0.086 rem/mCi [0.023 mSv/MBq], 0.206 rem/mCi [0.056 mSv/MBq]). With an injected dose of 10 mCi (370 MBq) and a 1-hour voiding interval, the patient would be exposed to an effective dose of 1.5 rem (15 mSv). Note that with use of visual comparison and quantitative assessment of standardized uptake values, good quality images are possible at doses as low as 5.4 mCi (185 MBq). Volunteer 3 was injected with 7.28 mCi (269.36 MBq) of 18F-FPPRGD2, and although he weighed 117.9 kg, his images were visually indistinguishable from those of volunteer 2, who was injected with 14.2 mCi (525.4 MBq) and weighed 47.2 kg.
Discussion
This phase 1 (pilot) study shows the safety of intravenously injected 18F-FPPRGD2. There were no adverse events or clinically important changes in vital signs or electrocardiographic findings during the course of the study. We believe that the initial significant increase in blood pressure and pulse during the first few minutes of imaging was a physiologic response to the stress related to the procedure, which subsequently normalizes. In addition, the biodistribution and dosimetry analyses revealed a stable and reproducible biodistribution of 18F-FPPRGD2 over time and across subjects, with acceptable doses absorbed by critical organs and even lower doses absorbed by radiation-sensitive organs.
One safety goal was to keep the absorbed organ radiation dose below 50 rem (0.5 Sv) per year, as set forth by the Food and Drug Administration. According to the calculated dosimetric values, a maximum of 56 mCi (2072 MBq) of 18F-FPPRGD2 per patient can be injected per year, or up to five acquisitions can be performed in one patient per year by using 10 mCi (370 MBq) per scan. Similarly, the doses to radiation-sensitive organs, such as the testes and ovaries, were well below the 0.03-Gy limit set by the Food and Drug Administration.
The mean effective dose of 18F-FPPRGD2 was 0.1462 rem/mCi ± 0.0669 (0.0396 mSv/MBq ± 0.0181). With use of an injected dose of 10 mCi (370 MBq) and a 1-hour voiding interval, the patient would be exposed to an effective radiation dose of 1.5 rem (15 mSv). This corresponds to the second risk category defined by the 2007 International Commission on Radiological Protection (33,34). The dose limit for the second risk category was 2.0 rem (20 mSv) and applies to situations in which there is a direct or indirect benefit for exposed individuals. In comparison, the effective dose to the patient from a 18F-galacto–RGD PET examination is 0.07 rem/mCi (0.019 mSv/MBq), or 0.7 rem (7 mSv) for a 10-mCi dose (35). Similarly, the total effective dose to the patient from a standard 18F-fluorodeoxyglucose PET examination is approximately 0.6–0.7 rem (6–7 mSv) (36).
The 95% confidence interval for the mean effective dose of 18F-FPPRGD2 was 0.086 rem/mCi (0.023 mSv/MBq), 0.206 rem/mCi (0.056 mSv/MBq). At the maximum of this confidence interval, an injected dose of 10 mCi (370 MBq) with a 1-hour voiding interval would expose the patient to an effective dose of 2.1 rem (20.7 mSv), which is still at the upper limit of the second risk category. We believe the higher radiation dose from 18F-FPPRGD2 is warranted, given its potentially improved specificity compared with the specificity of 18F-fluorodeoxyglucose and the aforementioned better tumor-to-background ratio relative to that with galacto-RGD. Moreover, as mentioned earlier, doses as low as 5.4 mCi may be used, further reducing the radiation dose to the patient.
The biodistribution of intravenously injected 18F-FPPRGD2 showed that the route of clearance of this tracer was through the renal and hepatobiliary pathways. Thus, the organs showing primary uptake were the kidneys, bladder, liver, and gastrointestinal tract. One volunteer also showed radiopharmaceutical accumulation in the gallbladder, which is understandable, given the hepatobiliary excretion pathway. All four of these organs had, on average, decreasing time-activity curves over the duration of imaging. Compared with 18F-fluciclatide, another RGD peptide agent tested in human volunteers (37), 18F-FPPRGD2 has better pharmacokinetic properties and less uptake in background tissue (especially lower uptake in liver).
A 1-hour circulation-uptake time is recommended after the intravenous injection of 18F-FPPRGD2. While the biodistribution of the tracer was relatively fixed after 30 minutes, the blood and plasma clearance curves show that approximately 25% of the tracer remained in the circulation at 30 minutes, less than 20% remained at 60 minutes, and less than 10% remained at 90 minutes. Before imaging, patients should be instructed to urinate to reduce both the degree of uptake in the bladder and the radiation dose to this dose-limiting organ.
There are a variety of potential applications for the 18F-FPPRGD2 tracer. Owing to the increased levels of angiogenesis in tumors and the associated αvβ3 integrin levels in the sprouting capillary walls and tumor cells, the primary role of 18F-FPPRGD2 is expected to be the evaluation of tumors. The biodistribution of 18F-FPPRGD2 observed in our study indicates that malignancies of the head, neck, and thorax would be most optimal for evaluation, given the low background in these areas. Moreover, those malignancies treated with antiangiogenic agents might be identified on 18F-FPPRGD2 scans to help identify those patients who would benefit from antiangiogensis therapy and more precisely assess the response to therapy at an earlier time. Other cancers, including those below the diaphragm can also be imaged. For instance, pancreatic tumors, which are often treated with fractionated radiation therapy, may be good candidates for 18F-FPPRGD2 imaging because their neovasculature tends to decrease substantially after therapy. Ultimately, further clinical studies involving patients with cancer will be required to determine the specificity of 18F-FPPRGD2 in humans and the tumor-to-background ratio that can be achieved.
Nononcologic applications of 18F-FPPRGD2 also have been proposed. Tissue growth and healing require angiogenesis. Study investigators have reported the use of galacto-RGD in the evaluation of myocardial healing after an infarct (38). Also, the development of aortic aneurysms is closely related to angiogenesis. As such, 18F-FPPRGD2 might be used to track the development and progression of aneurysms in native vessels and after therapy.
Because 18F-FPPRGD2 was assessed as a potential imaging agent for oncologic PET, the primary limitation of this study was that only healthy volunteers were examined. This was mandated by the Food and Drug Administration, and testing this agent in patients with cancer is the next step. Also, since only five healthy volunteers were involved, this work qualifies as a pilot study only; this limited the statistical analyses in particular. Again, the biodistribution and safety parameters will be investigated further in future studies involving patients with cancer. In addition, no urine metabolite analyses were performed; future experiments will also include these assessments.
In conclusion, the radiopharmaceutical 18F-FPPRGD2 has desirable pharmacokinetic and biodistribution properties, with the latter favoring PET applications in the head, neck, thorax, and extremities. As such, the primary application for 18F-FPPRGD2 is likely to be the PET evaluation of patients with cancer—especially those with brain, breast, and lung malignancies—for staging and restaging. As a next step, we plan to test the usefulness of 18F-FPPRGD2 in patients with brain, lung, and breast cancers for tumor staging and assessing suitability for and response to antiangiogenesis agents.
Advances in Knowledge.
A recently introduced PET radiopharmaceutical agent, fluorine 18 (18F) FPPRGD2, was well tolerated in all five healthy volunteers examined, with no adverse events or clinically important changes in vital signs or electrocardiographic findings.
The biodistribution of 18F-FPPRGD2, a marker for αvβ3 integrin expression, was evaluated in the nonpathologic state, with the areas of highest activity in the bladder, kidneys, liver, spleen, and bowel and minimal uptake above the diaphragm.
Complete dosimetric parameters for 18F-FPPRGD2 and expected maximal administered doses in clinical practice are given, with the mean effective dose being 0.1462 rem/mCi ± 0.0669 (0.0396 mSv/MBq ± 0.0181).
Implications for Patient Care.
18F-FPPRGD2 provides a way of determining the expression of αvβ3 integrin, a marker for angiogenesis, and can be used as a more specific imaging agent primarily for oncologic applications but also some nononcologic PET applications.
Use of 18F-FPPRGD2 might be a targeted imaging approach for identifying patients who would benefit from antiangiogenesis treatments and separating responders from nonresponders at an early time point.
Disclosures of Potential Conflicts of Interest: E.S.M. No potential conflicts of interest to disclose. M.L.G. No potential conflicts of interest to disclose. A.H.I. No potential conflicts of interest to disclose. A.K. No potential conflicts of interest to disclose. L.B. No potential conflicts of interest to disclose. R.B. No potential conflicts of interest to disclose. E.C. No potential conflicts of interest to disclose. S.L. No potential conflicts of interest to disclose. B.S. No potential conflicts of interest to disclose. F.T.C. Financial activities related to the present article: none to disclose. Financial activities not related to the present article: received a consulting fee from Abbott Vascular. Other relationships: none to disclose. X.C. No potential conflicts of interest to disclose. S.S.G. No potential conflicts of interest to disclose.
Supplementary Material
Acknowledgments
We thank Zheng Cheng, PhD, for assistance with radiochemistry and Jarrett Rosenberg, PhD, for statistical help with this manuscript, and all the technologists in the Nuclear Medicine clinic.
Received June 7, 2010; revision requested August 2; revision received December 29; accepted January 18, 2011; final version accepted February 14.
Supported in part by the Doris Duke Foundation, the Canary Foundation, and the Ben & Katherine Ivy Foundation.
Funding: This research was supported by the National Institutes of Health (grant ICMIC P50CA114747).
See also Science to Practice in this issue.
Abbreviations:
- FPPRGD2
- 2-fluoropropionyl labeled PEGylated dimeric RGD peptide (PEG3-E[c{RGDyk}]2)
- RGD
- arginine-glycine–aspartic acid
References
- 1.Folkman J. Angiogenesis and angiogenesis inhibition: an overview. EXS 1997;79:1–8 [DOI] [PubMed] [Google Scholar]
- 2.Folkman J. Role of angiogenesis in tumor growth and metastasis. Semin Oncol 2002;29(6 Suppl 16):15–18 [DOI] [PubMed] [Google Scholar]
- 3.Siemann DW, Chaplin DJ, Horsman MR. Vascular-targeting therapies for treatment of malignant disease. Cancer 2004;100(12):2491–2499 [DOI] [PubMed] [Google Scholar]
- 4.Bhujwalla ZM, Artemov D, Natarajan K, Solaiyappan M, Kollars P, Kristjansen PE. Reduction of vascular and permeable regions in solid tumors detected by macromolecular contrast magnetic resonance imaging after treatment with antiangiogenic agent TNP-470. Clin Cancer Res 2003;9(1):355–362 [PubMed] [Google Scholar]
- 5.Eliceiri BP, Cheresh DA. Role of alpha v integrins during angiogenesis. Cancer J 2000;6(Suppl 3):S245–S249 [PubMed] [Google Scholar]
- 6.Felding-Habermann B, O’Toole TE, Smith JW, et al. Integrin activation controls metastasis in human breast cancer. Proc Natl Acad Sci U S A 2001;98(4):1853–1858 [DOI] [PMC free article] [PubMed] [Google Scholar]
- 7.Kerr JS, Slee AM, Mousa SA. The alpha v integrin antagonists as novel anticancer agents: an update. Expert Opin Investig Drugs 2002;11(12):1765–1774 [DOI] [PubMed] [Google Scholar]
- 8.Haubner R, Wester HJ. Radiolabeled tracers for imaging of tumor angiogenesis and evaluation of anti-angiogenic therapies. Curr Pharm Des 2004;10(13):1439–1455 [DOI] [PubMed] [Google Scholar]
- 9.Willmann JK, Cheng Z, Davis C, et al. Targeted microbubbles for imaging tumor angiogenesis: assessment of whole-body biodistribution with dynamic micro-PET in mice. Radiology 2008;249(1):212–219 [DOI] [PMC free article] [PubMed] [Google Scholar]
- 10.Willmann JK, Kimura RH, Deshpande N, Lutz AM, Cochran JR, Gambhir SS. Targeted contrast-enhanced ultrasound imaging of tumor angiogenesis with contrast microbubbles conjugated to integrin-binding knottin peptides. J Nucl Med 2010;51(3):433–440 [DOI] [PMC free article] [PubMed] [Google Scholar]
- 11.Willmann JK, Lutz AM, Paulmurugan R, et al. Dual-targeted contrast agent for US assessment of tumor angiogenesis in vivo. Radiology 2008;248(3):936–944 [DOI] [PMC free article] [PubMed] [Google Scholar]
- 12.Willmann JK, Paulmurugan R, Chen K, et al. US imaging of tumor angiogenesis with microbubbles targeted to vascular endothelial growth factor receptor type 2 in mice. Radiology 2008;246(2):508–518 [DOI] [PMC free article] [PubMed] [Google Scholar]
- 13.Sipkins DA, Cheresh DA, Kazemi MR, Nevin LM, Bednarski MD, Li KC. Detection of tumor angiogenesis in vivo by alphaVbeta3-targeted magnetic resonance imaging. Nat Med 1998;4(5):623–626 [DOI] [PubMed] [Google Scholar]
- 14.Chen X, Conti PS, Moats RA. In vivo near-infrared fluorescence imaging of integrin alphavbeta3 in brain tumor xenografts. Cancer Res 2004;64(21):8009–8014 [DOI] [PubMed] [Google Scholar]
- 15.Wang W, Ke S, Wu Q, et al. Near-infrared optical imaging of integrin alphavbeta3 in human tumor xenografts. Mol Imaging 2004;3(4):343–351 [DOI] [PubMed] [Google Scholar]
- 16.Gambhir SS. Molecular imaging of cancer with positron emission tomography. Nat Rev Cancer 2002;2(9):683–693 [DOI] [PubMed] [Google Scholar]
- 17.Haubner R, Kuhnast B, Mang C, et al. [18F]Galacto-RGD: synthesis, radiolabeling, metabolic stability, and radiation dose estimates. Bioconjug Chem 2004;15(1):61–69 [DOI] [PubMed] [Google Scholar]
- 18.Haubner R, Wester HJ, Weber WA, et al. Noninvasive imaging of alpha(v)beta3 integrin expression using 18F-labeled RGD-containing glycopeptide and positron emission tomography. Cancer Res 2001;61(5):1781–1785 [PubMed] [Google Scholar]
- 19.Haubner R, Weber WA, Beer AJ, et al. Noninvasive visualization of the activated alphavbeta3 integrin in cancer patients by positron emission tomography and [18F]Galacto-RGD. PLoS Med 2005;2(3):e70. [DOI] [PMC free article] [PubMed] [Google Scholar]
- 20.Chen X, Hou Y, Tohme M, et al. Pegylated Arg-Gly-Asp peptide: 64Cu labeling and PET imaging of brain tumor alphavbeta3-integrin expression. J Nucl Med 2004;45(10):1776–1783 [PubMed] [Google Scholar]
- 21.Chen X, Park R, Hou Y, et al. MicroPET imaging of brain tumor angiogenesis with 18F-labeled PEGylated RGD peptide. Eur J Nucl Med Mol Imaging 2004;31(8):1081–1089 [DOI] [PubMed] [Google Scholar]
- 22.Vagner J, Handl HL, Gillies RJ, Hruby VJ. Novel targeting strategy based on multimeric ligands for drug delivery and molecular imaging: homooligomers of alpha-MSH. Bioorg Med Chem Lett 2004;14(1):211–215 [DOI] [PubMed] [Google Scholar]
- 23.Rao J, Lahiri J, Isaacs L, Weis RM, Whitesides GM. A trivalent system from vancomycin.D-ala-D-Ala with higher affinity than avidin.biotin. Science 1998;280(5364):708–711 [DOI] [PubMed] [Google Scholar]
- 24.Li ZB, Chen K, Chen X. (68)Ga-labeled multimeric RGD peptides for microPET imaging of integrin alpha(v)beta (3) expression. Eur J Nucl Med Mol Imaging 2008;35(6):1100–1108 [DOI] [PubMed] [Google Scholar]
- 25.Li ZB, Wu Z, Chen K, Chin FT, Chen X. Click chemistry for (18)F-labeling of RGD peptides and microPET imaging of tumor integrin alphavbeta3 expression. Bioconjug Chem 2007;18(6):1987–1994 [DOI] [PMC free article] [PubMed] [Google Scholar]
- 26.Wu Z, Li ZB, Chen K, et al. MicroPET of tumor integrin alphavbeta3 expression using 18F-labeled PEGylated tetrameric RGD peptide (18F-FPRGD4). J Nucl Med 2007;48(9):1536–1544 [DOI] [PMC free article] [PubMed] [Google Scholar]
- 27.Li ZB, Cai W, Cao Q, et al. (64)Cu-labeled tetrameric and octameric RGD peptides for small-animal PET of tumor alpha(v)beta(3) integrin expression. J Nucl Med 2007;48(7):1162–1171 [DOI] [PubMed] [Google Scholar]
- 28.Wu Z, Li ZB, Cai W, et al. 18F-labeled mini-PEG spacered RGD dimer (18F-FPRGD2): synthesis and microPET imaging of alphavbeta3 integrin expression. Eur J Nucl Med Mol Imaging 2007;34(11):1823–1831 [DOI] [PMC free article] [PubMed] [Google Scholar]
- 29.Liu S, Liu Z, Chen K, et al. 18F-labeled galacto and PEGylated RGD dimers for PET imaging of αvβ3 integrin expression. Mol Imaging Biol 2010;12(5):530–538 [DOI] [PMC free article] [PubMed] [Google Scholar]
- 30.Chin FT, Shen B, Liu S, et al. Initial experience with clinical-grade [18F]FPP(RGD)2: an automated multi-step radiosynthesis for clinical PET studies. J Nucl Med (in press). [DOI] [PMC free article] [PubMed] [Google Scholar]
- 31.Chin FT, Shen B, Liu S, et al. First experience with clinical-grade [18F]FPP (RGD)2: an automated multi-step radiosynthesis for clinical PET studies. Mol Imaging Biol. [DOI] [PMC free article] [PubMed] [Google Scholar]
- 32.Stabin MG, Sparks RB, Crowe E. OLINDA/EXM: the second-generation personal computer software for internal dose assessment in nuclear medicine. J Nucl Med 2005;46(6):1023–1027 [PubMed] [Google Scholar]
- 33.International Commission on Radiological Protection. Radiation protection in medicine. ICRP publication 105. Ann ICRP 2007;37(6):1–63 [DOI] [PubMed] [Google Scholar]
- 34.International Commission on Radiological Protection. The 2007 recommendations of the International Commission on Radiological Protection. ICRP publication 103. Ann ICRP 2007;37(2-4):1–332 [DOI] [PubMed] [Google Scholar]
- 35.Beer AJ, Schwaiger M. Imaging of integrin alphavbeta3 expression. Cancer Metastasis Rev 2008;27(4):631–644 [DOI] [PubMed] [Google Scholar]
- 36.Leide-Svegborn S. Radiation exposure of patients and personnel from a PET/CT procedure with 18F-FDG. Radiat Prot Dosimetry 2010;139(1-3):208–213 [DOI] [PubMed] [Google Scholar]
- 37.McParland BJ, Miller MP, Spinks TJ, et al. The biodistribution and radiation dosimetry of the Arg-Gly-Asp peptide 18F-AH111585 in healthy volunteers. J Nucl Med 2008;49(10):1664–1667 [DOI] [PubMed] [Google Scholar]
- 38.Higuchi T, Bengel FM, Seidl S, et al. Assessment of alphavbeta3 integrin expression after myocardial infarction by positron emission tomography. Cardiovasc Res 2008;78(2):395–403 [DOI] [PubMed] [Google Scholar]
Associated Data
This section collects any data citations, data availability statements, or supplementary materials included in this article.