Abstract
Background
For understanding cellular systems and biological networks, it is important to analyze functions and interactions of proteins and domains. Many methods for predicting protein-protein interactions have been developed. It is known that mutual information between residues at interacting sites can be higher than that at non-interacting sites. It is based on the thought that amino acid residues at interacting sites have coevolved with those at the corresponding residues in the partner proteins. Several studies have shown that such mutual information is useful for identifying contact residues in interacting proteins.
Results
We propose novel methods using conditional random fields for predicting protein-protein interactions. We focus on the mutual information between residues, and combine it with conditional random fields. In the methods, protein-protein interactions are modeled using domain-domain interactions. We perform computational experiments using protein-protein interaction datasets for several organisms, and calculate AUC (Area Under ROC Curve) score. The results suggest that our proposed methods with and without mutual information outperform EM (Expectation Maximization) method proposed by Deng et al., which is one of the best predictors based on domain-domain interactions.
Conclusions
We propose novel methods using conditional random fields with and without mutual information between domains. Our methods based on domain-domain interactions are useful for predicting protein-protein interactions.
Background
Understanding of protein functions and protein-protein interactions is one of important topics in the field of molecular biology and bioinformatics. Recently, many researchers have focused on the investigation of amino acid residues of proteins to reveal interactions and contacts between residues [1-4]. If residues at important sites for interactions between proteins are substituted in one protein, the corresponding residues in interacting partner proteins are expected to be also substituted by selection pressure. Otherwise, such mutated proteins may lose the interactions. Fraser et al. confirmed that interacting proteins evolve at similar evolutionary rates by comparing putatively orthologous protein sequences between S. cerevisiae and C. elegans[5]. It means that substitutions for contact residues occur in both interacting proteins as long as the proteins keep interacting with each other. Therefore, mutual information (MI) between residues is useful for predicting protein-protein interactions for proteins of unknown function. MI is calculated from multiple sequence alignments for homologous protein sequences. Weigt et al. identified direct residue contacts between sensor kinase and response regulator proteins by message passing, which is an improvement of MI [4]. Burger and van Nimwegen used a dependence tree where a node corresponds to a position of amino acid sequences, and predicted interactions using a Bayesian network method [2]. On the other hand, Markov random field and conditional random field models have been well studied in fields of natural language processing [6,7]. Also in bioinformatics, protein function prediction methods from protein-protein interaction network and other biological networks were developed using Markov random fields [8,9]. On the other hand, several prediction methods have been developed based on domain-domain interactions. Deng et al. proposed a domain-based probabilistic model of protein-protein interactions, and developed EM (Expectation Maximization) method [10]. Based on this probabilistic model, LP (Linear Programming)-based methods were developed [11], and Chen et al. improved the accuracy of interaction strength prediction by APM (Association Probabilistic Method) [12]. In this paper, we propose prediction methods based on domain-domain interactions using conditional random fields with and without mutual information. Furthermore, we perform computational experiments for several protein-protein interaction datasets, compare the methods with the EM method proposed by Deng et al. [10], which is one of the best predictors based on domain-domain interactions, and the association method proposed by Sprinzak and Margalit [13] (the APM method for binary interaction data is equivalent to the association method), and show that our methods outperform the EM method and the association method.
Mutual information between domains
In order to investigate the relationship between two positions of proteins, MI for distributions of amino acids at the positions is used. Such distributions can be obtained from multiple alignments of protein sequences and domain sequences. In this section, we briefly review MI for distributions of amino acids, and explain MI between domains.
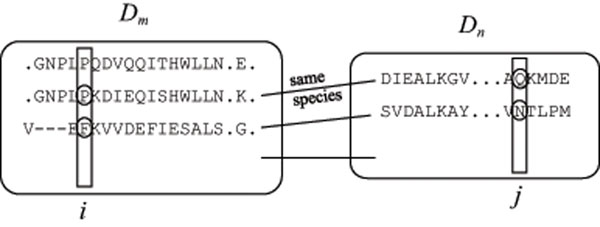
We assume that multiple sequence alignments for domains Dm and Dn are obtained, respectively (see Figure 1). In order to calculate MI, we need joint appearance frequencies. However, we cannot see which sequence in the multiple alignment of domain Dm corresponds to a specified sequence in that of Dn. Therefore, we assume that sequences contained in the same organism can be paired. In the example of Figure 1, the second sequence of Dm is paired with the first one of Dn, the third one of Dm is paired with the second one of Dn, and so on. The first sequence of Dm is not counted into the appearance frequencies because it is not paired with any sequence of Dn although it may be paired with sequences of other domains than Dn.
Figure 1.
Illustration on the calculation of mutual information from multiple alignments of domains Domains Dm and Dn have multiple alignments of sequences from several organisms, respectively. Mutual information is calculated for each pair of positions i and j.
Let A be a set of amino acids, fi(A) be the appearance frequency of amino acid A at position i in domains Dm and Dn, and fij(A, B) be the joint appearance frequency of a pair of amino acids A at position i in Dm and B at position j in Dn, where each frequency is divided by the number of paired sequences M in the multiple alignments such that ∑A∈Afi(A) = ∑A,B∈Afij(A,B) = 1.
Multiple alignments often include some gaps. Weigt et al. counted the frequencies of gaps as well as amino acids [4]. Therefore, we also consider gaps to be a kind of amino acids, that is, the number of distinct amino acids is |A| = 21. Then, mutual information for positions i in Dm and j in Dn is defined as the Kullback-Leibler divergence between the multiplication of appearance frequencies, fi(A)fj(B), and the joint appearance frequencies, fij(A,B), as follows.
| (1) |
If frequency distributions of amino acids at positions i and j are independent from each other, fij(A,B) ≈ fi(A)fj(B), and MIij approaches to zero. This means that the two positions are not related with each other in the evolutionary process. If domains Dm and Dn interact at the positions, it is considered that MIij becomes high because the positions have coevolved through the evolutionary process in order to keep the interaction. It should be noted that two positions i and j do not always directly interact even if MIij is high [4]. However, such proteins with high values of MI have a possibility to directly interact with each other at other positions in the proteins.
However, we need to reduce MIij because it can be unnecessarily high depending on distributions of fi(A) and fj(B). For that purpose, we make use of  , which is the mutual information MIij from the joint frequency, fij(A, B), obtained by shuffling at random the combinations of sequences in multiple alignments. In this paper, we repeat the procedure 400 times according to [4], and take the average. For practical uses of MI, fi(A), fj(B) and fij(A,B) should be positive values. Otherwise, we cannot calculate MIij by using computers. Therefore, we use the following pseudocount as in [4],
| (2) |
| (3) |
where η is a constant value, in this paper we use η = 1. It should be noted that the sum over all amino acids A,  and
and  because ∑A∈Afi(A) = ∑A,B∈Afij(A,B) = 1.
In order to investigate interactions between proteins, we need MI between domains included in the proteins. Thus, we define MI between domains Dm and Dn, Mmn, to be the maximum of MI over all positions i and j as follows.
| (4) |
where 〈v〉 means the average of v, i and j are positions of Dm and Dn, respectively. Since MIij is calculated to be high for the positions i and j that include many gaps, we exclude positions that include more than 20% gaps as in [14].
Conditional random field model for PPI
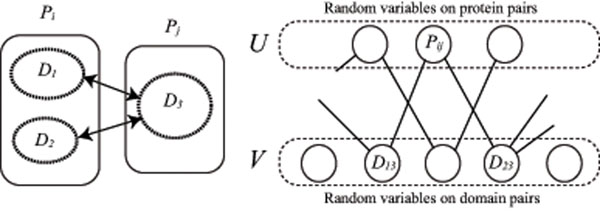
In this section, we propose a probabilistic model for protein-protein and domain-domain interactions using conditional random fields [6,7] because it can be considered that two domains Dm and Dn do not always interact even if the mutual information Mmn is large. For example, Weigt et al. improved MI and proposed direct information (DI) because residues do not always contact with each other even if the MI is large [4]. Most proteins contain domains as is well known. If two proteins do not interact with each other, any two domains contained in the proteins must not interact with each other. In the left example of Figure 2, protein Pi consists of domains D1 and D2 and protein Pj consists of domain D3 respectively. If Pi and Pj do not interact, any pair of (D1, D3) and (D3, D3) does not interact. Deng et al. proposed a probabilistic model for a pair of proteins as follows [10]. By assuming that proteins Pi and Pj interact if and only if at least a pair of domains included in the proteins interacts, and events that domains interact are independent from each other, they defined
| (5) |
Figure 2.
Markov random field model for protein-protein interactions Left: Example of proteins Pi and Pj. Pi consists of domains D1 and D2, and Pj consists of domain D3, respectively. Right: Factor graph G(U,V,E). There exists an edge between Pij ∈ U and Dmn ∈ V if and only if Dmn ∈ Pij.
where Pij = 1 means that proteins Pi and Pj interact, Dmn = 1 means that domains Dm and Dn interact, Dmn ∈ Pij means that domain Dm is included in protein Pi and Dn is included in Pj and the product in the right hand side is calculated for all domain pairs (Dm, Dn) included in the protein pair (Pi, Pj). By transforming equation (5), we have
| (6) |
 |
(7) |
where λ(mn) = log(1 – Pr(Dmn = 1)).
From this equation, we can consider the following Markov random field model for protein pair (Pi, Pj) (see Figure 2).
 |
(8) |
where pij ∈ {0, 1}, d means a set of events on domain-domain interactions, Dmn = dmn (dmn ∈ {0, 1}),  denotes a local feature,
  is the corresponding weight parameter and related to the joint probability Pr(Pij = s, Dmn = t), and Zij denotes the normalization constant. For instance, equation (8) for pij = 0 is equivalent to equation (7) in the case that
  for all protein pairs (Pi, Pj) and
  if s = t = 0, otherwise 0.
In Markov random fields, random variables have Markov properties represented as an undirected graph [15]. The factor graph for our model is represented to be a bipartite graph G(U, V, E) with a set of vertices U corresponding to protein-protein interactions Pij, a set of vertices V corresponding to domain-domain interactions Dmn, and a set of edges E between U and V as the right figure of Figure 2. There exists an edge between Pij ∈ U and Dmn ∈ V if and only if Dmn ∈ Pij. For the left example of Figure 2, protein pair (Pi, Pj) includes domain pairs (D1, D3) and (D2, D3). Then, in the factor graph, the vertex of Pij is connected with vertices of D13 and D23, respectively. Although the vertex of Pij does not have other adjacent vertices than the vertices of D13 and D23, those of D13 and D23 can be connected with other vertices than that of Pij
Since Pr(Pij = 0|Dmn =t) = 1 – Pr(Pij = 1|Dmn = t), it is redundant to consider both s = 0, 1, and it is sufficient to consider only s = 1. Therefore, in order to simplify the model, we substitute  ,
,  , and
, and  for all protein pairs (Pi, Pj). Then, we have the following joint probability,
 |
(9) |
where p means a set of events on protein-protein interactions, Pij = pij.
We here introduce mutual information between domains M = {Mmn} as given conditional data in order to combine it with the probabilistic model. Then, equation (9) can be written as
 |
(10) |
where
 |
(11) |
 |
(12) |
σ(x) = 1/(1 + e–x) is an increasing function, and c is a positive constant. It should be noted that a negative value, –1, is given to  because it is undesired that a pair of domains interact although proteins having the pair do not interact. In this way, the local feature
  correlates protein-protein interactions Pij with domain-domain interactions Dmn (see Figure 2).
For a conditional random field model without MI, we use the following local feature instead of  .
.
 |
(13) |
Parameter estimation
In this section, we discuss how to estimate the parameters  . We assume that protein-protein interaction data p = {pij} are given. Then, the likelihood function is represented by
 |
(14) |
where Z(M) = ∏pij∈pZij(M). By taking the logarithm, we have
 |
(15) |
We estimate the parameters by maximizing the log-likelihood function, l(λ). Since log(ex + ey) is a convex function for variables x and y, that is, l(λ) is a concave function, we are able to obtain a global maximum. For maximizing such functions, various methods such as the steepest descent method, Newton’s method, and the Broyden-Fletcher-Goldfarb-Shanno (BFGS) [16] method have been developed. Newton’s method calculates the inverse of the Hessian matrix for the objective function. However, the computational cost is high. Therefore, the quasi-Newton method approximates the matrix by some efficient method using the first derivatives, the gradient. In this paper, we use the BFGS method, which is one of the quasi-Newton methods. By differentiating equation (15) partially with respect to each parameter  , we have
 |
(16) |
In the BFGS method, this equation is repeatedly applied for updating a solution.
Computational experiments
Data and implementation
We used protein-protein interaction data of H. sapiens, D. melanogaster, and C. elegans from the DIP database [17], the file name is ’dip20091230.txt’. We used the UniProt Knowledgebase database (version 15.4) [18] as protein domain inclusion data. We deleted proteins that did not have any domain, and obtained 294 interacting protein pairs as positive data that included 300 distinct proteins and 320 domains for H. sapiens, 449 interacting pairs that included 562 proteins and 449 domains for D. melanogaster, and 250 interacting pairs that included 602 proteins and 476 domains for C. elegans.
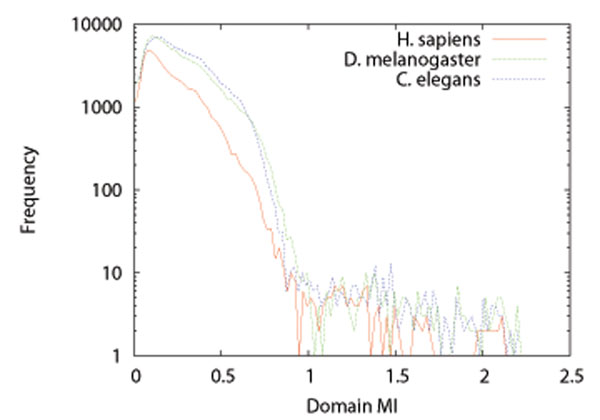
We used the Pfam database (version 24.0) [19] to obtain multiple sequence alignments for domains, and calculated MI, Mmn, for each pair of domains. Figure 3 shows the distributions of domain MI Mmn for H. sapiens, D. melanogaster, and C. elegans. We can see from the figure that most domain MIs are distributed in the part of less than about 0.8 for all organisms. It is considered that domains Dm and Dn with Mmn less than 0.8 may not interact, and domains with Mmn more than 0.8 have more possibilities to interact with each other. Therefore, we set the constant c in equation (12) to be 0.8. Although we tried several values from 0.6 to 1.0 for c, the results were similar to the case of c = 0.8.
Figure 3.
Distributions of domain MIs for H. sapiens, D. melanogaster, and C. elegans
We selected non-interacting protein pairs as negative data uniformly at random such that negative data did not overlap with the positive data. The number of negative data was the same as that of positive data for each organism.
We used libLBFGS (version 1.9) with default parameters to estimate the parameters  , which is a C implementation of the limited memory BFGS method [20], and is available on the web page, http://www.chokkan.org/software/liblbfgs/.
Result
In order to evaluate our method, we compared the proposed CRF method with MI and that without MI with the EM method by Deng et al. [10] and the association method proposed by Sprinzak and Margalit [13]. The association method and the APM method [12] estimate probabilities λmn that domains Dm and Dn interact as  and
and  , respectively, where Nmn (Imn) denotes the number of (interacting) protein pairs that include domain pair (Dm, Dn), and ρij denotes the interaction strength of protein pair (Pi, Pj), 0 ≤ ρij ≤ 1. However, our input interaction data are binary, that is, ρij takes only 0 or 1. Then, the numerator of the APM method becomes Imn. It means that the APM method for binary interaction data is equivalent to the association method. In the EM method, probabilities λmn that domains Dm and Dn interact are estimated by the recursive formula,
  , where oij = 1 denotes that it was observed that proteins Pi and Pj interact with each other, and fn = 0.8. In this paper, the solution of the association method was given as the initial value
  of the EM method.
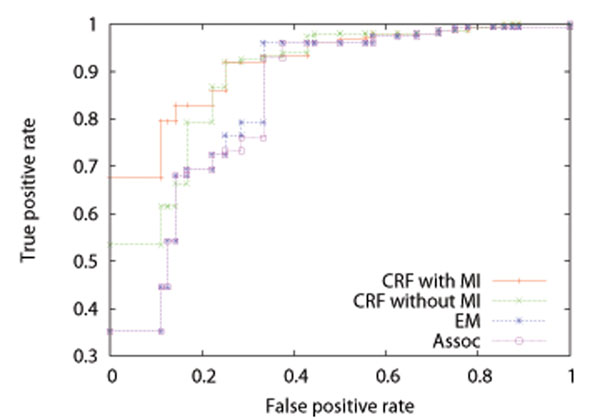
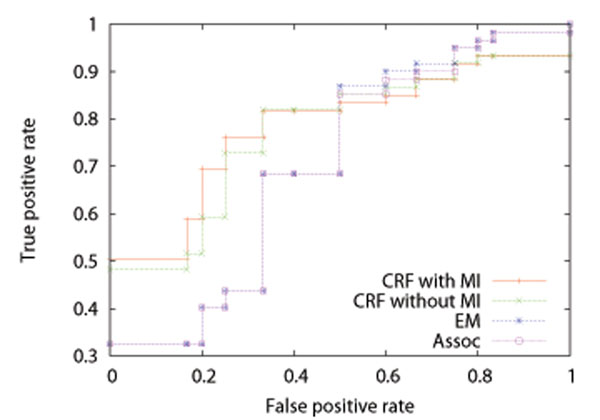
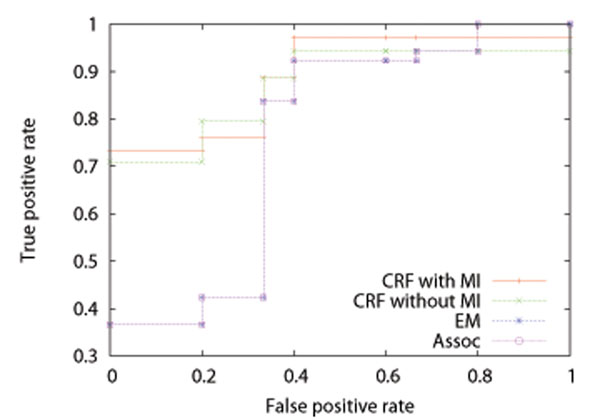
We performed five-fold cross-validation, that is, split the data into 5 datasets (4 for training and 1 for test), estimated  from the training datasets, and calculated Pr(Pij = 1|M) of equation (10) for each protein pair in the test dataset and AUC (Area Under ROC Curve) score, where among the test dataset only protein pairs that included at least a parameter estimated from the corresponding training dataset were always used. We repeated 5 times, and took the average. Tables 1, 2, and 3 show the results on AUC for training and test datasets by the CRF method with MI, that without MI, the EM method, and the association method for H. sapiens, D. melanogaster, and C. elegans, respectively. An AUC score is the area under an ROC (Receiver Operating Characteristic) curve, and takes a value between 0 and 1. The ROC curve of a random classifier lies on the diagonal line, and the AUC score is 0.5. The ROC curve of a perfect classifier goes through the point (0 (false positive rate), 1 (true positive rate)), and the AUC score is 1. A classifier with the AUC score closer to 1 has better performance. We can see from these tables that the results by the CRF method with MI are better than those by the CRF method without MI, and that the results by the CRF method without MI are better than those by the EM method and the association method. It is also seen that the results by the EM method are almost the same as those by the association method. It might be because the parameters of the EM method were estimated from the solution of the association method and the solution of the EM method already reached a local optimum. Figures 4, 5, and 6 show the average ROC curves for training and test datasets by the CRF method with MI, that without MI, the EM method, and the association method. For training datasets, the results by all of the methods were almost perfect. For test datasets, the CRF method with MI outperformed that without MI, the EM method, and the association method. It should be noted that the ROC curves of the EM method are almost the same as those of the association method for the same reason discussed above.
Table 1.
The AUC results for training and test datasets of H. sapiens by the CRF method with MI, that without MI, the EM method, and the association method
| iteration | CRF with MI | CRF without MI | EM | Assoc | ||||
|---|---|---|---|---|---|---|---|---|
| training | test | training | test | training | test | training | test | |
| 1st | 0.999366 | 0.989247 | 0.999366 | 0.881720 | 0.999819 | 0.709677 | 0.999602 | 0.709677 |
| 2nd | 0.998787 | 0.919355 | 0.999312 | 0.923387 | 0.999909 | 0.875000 | 0.999330 | 0.854839 |
| 3rd | 1.000000 | 0.847222 | 1.000000 | 0.833333 | 1.000000 | 0.861111 | 1.000000 | 0.861111 |
| 4th | 0.999351 | 0.989583 | 0.999369 | 1.000000 | 0.999856 | 0.989583 | 0.999351 | 0.989583 |
| 5th | 0.999333 | 0.842365 | 0.999369 | 0.827586 | 0.999982 | 0.798030 | 0.999802 | 0.798030 |
| average | 0.999367 | 0.917554 | 0.999483 | 0.893205 | 0.999913 | 0.846680 | 0.999617 | 0.842648 |
Table 2.
The AUC results for training and test datasets of D. melanogaster by the CRF method with MI, that without MI, the EM method, and the association method
| iteration | CRF with MI | CRF without MI | EM | Assoc | ||||
|---|---|---|---|---|---|---|---|---|
| training | test | training | test | training | test | training | test | |
| 1st | 0.999255 | 0.707692 | 0.999977 | 0.738462 | 0.999961 | 0.769231 | 0.999938 | 0.769231 |
| 2nd | 0.997928 | 0.818182 | 0.997905 | 0.848485 | 0.999938 | 0.727273 | 0.999736 | 0.727273 |
| 3rd | 0.997920 | 0.708333 | 0.997920 | 0.562500 | 0.999922 | 0.645833 | 0.999884 | 0.625000 |
| 4th | 0.998660 | 0.863636 | 0.999318 | 0.886364 | 0.999814 | 0.840909 | 0.999853 | 0.840909 |
| 5th | 0.999234 | 0.819444 | 0.999954 | 0.833333 | 0.999861 | 0.527778 | 0.999923 | 0.527778 |
| average | 0.998599 | 0.783458 | 0.999015 | 0.773829 | 0.999899 | 0.702205 | 0.999867 | 0.698038 |
Table 3.
The AUC results for training and test datasets of C. elegans by the CRF method with MI, that without MI, the EM method, and the association method
| iteration | CRF with MI | CRF without MI | EM | Assoc | ||||
|---|---|---|---|---|---|---|---|---|
| training | test | training | test | training | test | training | test | |
| 1st | 0.999975 | 0.657143 | 0.999975 | 0.514286 | 1.000000 | 0.542857 | 1.000000 | 0.542857 |
| 2nd | 0.997899 | 0.923077 | 0.996873 | 0.948718 | 0.999875 | 0.743590 | 0.999825 | 0.743590 |
| 3rd | 0.998775 | 0.900000 | 0.998825 | 0.933333 | 0.999875 | 0.866667 | 0.999825 | 0.866667 |
| 4th | 0.998950 | 0.966667 | 0.999850 | 0.966667 | 0.999850 | 0.633333 | 0.999850 | 0.633333 |
| 5th | 0.998900 | 1.000000 | 0.998875 | 1.000000 | 0.999675 | 1.000000 | 0.999700 | 1.000000 |
| average | 0.998900 | 0.889377 | 0.998879 | 0.872601 | 0.999855 | 0.757289 | 0.999840 | 0.757289 |
Figure 4.
Average ROC curves for test datasets of H. sapiens by the CRF method with MI, that without MI, the EM method, and the association method
Figure 5.
Average ROC curves for test datasets of D. melanogaster by the CRF method with MI, that without MI, the EM method, and the association method
Figure 6.
Average ROC curves for test datasets of C. elegans by the CRF method with MI, that without MI, the EM method, and the association method
Conclusions
We proposed novel methods which combine conditional random fields with the domain-based model of protein-protein interactions. In order to give better performance, we introduced mutual information to the probabilistic model. In the improved model, mutual information between domains is given as conditions, where MI between domains is defined as the maximum of MIs between residues in the domains. This method was developed based on the fact that amino acid residues at important sites for interactions have coevolved with each other, and MI has been used for identifying contact residues in interactions. We performed five-fold cross-validation experiments, and calculated AUC for probabilities that two proteins interact. The results suggested that our proposed methods, especially the CRF method with mutual information, are useful. However, the results of AUC for training datasets implied that estimated parameters were overfitting to training datasets. For avoiding that problem, we can improve the methods, for instance, by adding regularization terms, l1-norm of parameters to the log-likelihood function. Since CRF has an advantage to be able to incorporate large number of features, it remains as a future work to improve the model itself to obtain better accuracy by, for instance, modifying the local feature and adding new features.
Authors contributions
JS proposed the use of mutual information for predicting protein-protein interactions. Methods were developed and implemented by MH. MK and TA participated in the discussion during development of the methods. The manuscript was prepared by MH, JS, and TA.
Competing interests
The authors declare that they have no competing interests.
Contributor Information
Morihiro Hayashida, Email: morihiro@kuicr.kyoto-u.ac.jp.
Mayumi Kamada, Email: kamada@kuicr.kyoto-u.ac.jp.
Jiangning Song, Email: Jiangning.Song@monash.edu.
Tatsuya Akutsu, Email: takutsu@kuicr.kyoto-u.ac.jp.
Acknowledgements
This work was partially supported by Grants-in-Aid #22240009 and #21700323 from MEXT, Japan. JS would like to thank the National Health and Medical Research Council of Australia (NHMRC) and the Chinese Academy of Sciences (CAS) for financially supporting this research via the NHMRC Peter Doherty Fellowship and the Hundred Talents Program of CAS.
This article has been published as part of BMC Systems Biology Volume 5 Supplement 1, 2011: Selected articles from the 4th International Conference on Computational Systems Biology (ISB 2010). The full contents of the supplement are available online at http://www.biomedcentral.com/1752-0509/5?issue=S1.
References
- White RA, Szurmant H, Hoch JA, Hwa T. Features of protein-protein interactions in two-component signaling deduced from genomic libraries. Methods Enzymol. 2007;422:75–101. doi: 10.1016/S0076-6879(06)22004-4. full_text. [DOI] [PubMed] [Google Scholar]
- Burger L, van Nimwegen E. Accurate prediction of protein-protein interactions from sequence alignments using a Bayesian method. Molecular Systems Biology. 2008;4:165. doi: 10.1038/msb4100203. [DOI] [PMC free article] [PubMed] [Google Scholar]
- Halabi N, Rivoire O, Leibler S, Ranganathan R. Protein sectors: Evolutionary units of three-dimensional structure. Cell. 2009;138:774–786. doi: 10.1016/j.cell.2009.07.038. [DOI] [PMC free article] [PubMed] [Google Scholar]
- Weigt M, White RA, Szurmant H, Hoch JA, Hwa T. Identification of direct residue contacts in protein-protein interaction by message passing. Proc. Natl. Acad. Sci. USA. 2009;106:67–72. doi: 10.1073/pnas.0805923106. [DOI] [PMC free article] [PubMed] [Google Scholar]
- Fraser HB, Hirsh AE, Steinmetz LM, Scharfe C, Feldman MW. Evolutionary rate in the protein interaction network. Science. 2002;296:750–752. doi: 10.1126/science.1068696. [DOI] [PubMed] [Google Scholar]
- Sha F, Pereira F. Shallow parsing with conditional random fields. Proc. HLT-NAACL 2003. 2003. pp. 134–141.
- Sutton C, McCallum A. Introduction to statistical relational learning. MIT Press; 2006. An introduction to conditional random fields for relational learning; pp. 93–128. [Google Scholar]
- Deng M, Zhang K, Mehta S, Chen T, Sun F. Prediction of protein function using protein-protein interaction data. Journal of Computational Biology. 2003;10(6):947–960. doi: 10.1089/106652703322756168. [DOI] [PubMed] [Google Scholar]
- Deng M, Chen T, Sun F. An integrated probabilistic model for functional prediction of proteins. Journal of Computational Biology. 2004;11:463–475. doi: 10.1089/1066527041410346. [DOI] [PubMed] [Google Scholar]
- Deng M, Mehta S, Sun F, Chen T. Inferring domain-domain interactions from protein-protein interactions. Genome Research. 2002;12:1540–1548. doi: 10.1101/gr.153002. [DOI] [PMC free article] [PubMed] [Google Scholar]
- Hayashida M, Ueda N, Akutsu T. Inferring strengths of protein-protein interactions from experimental data using linear programming. Bioinformatics. 2003;19(suppl 2):ii58–ii65. doi: 10.1093/bioinformatics/btg1061. [DOI] [PubMed] [Google Scholar]
- Chen L, Wu LY, Wang Y, Zhang XS. Inferring protein interactions from experimental data by association probabilistic method. Proteins. 2006;62(4):833–837. doi: 10.1002/prot.20783. [DOI] [PubMed] [Google Scholar]
- Sprinzak E, Margalit H. Correlated sequence-signatures as markers of protein-protein interaction. Journal of Molecular Biology. 2001;311:681–692. doi: 10.1006/jmbi.2001.4920. [DOI] [PubMed] [Google Scholar]
- Little DY, Chen L. Identification of coevolving residues and coevolution potentials emphasizing structure, bond formation and catalytic coordination in protein evolution. PLoS One. 2009;4:e4762. doi: 10.1371/journal.pone.0004762. [DOI] [PMC free article] [PubMed] [Google Scholar]
- Moussouri J. Gibbs and Markov random systems with constraints. Journal of Statistical Physics. 1974;10:11–33. doi: 10.1007/BF01011714. [DOI] [Google Scholar]
- Bertsekas DP. Nonlinear Programming. Athena Scientific; 1999. [Google Scholar]
- Salwinski L, Miller CS, Smith AJ, Pettit FK, Bowie JU, Eisenberg D. The Database of Interacting Proteins: 2004 update. Nucleic Acids Research. 2004;32:D449–D451. doi: 10.1093/nar/gkh086. [DOI] [PMC free article] [PubMed] [Google Scholar]
- The UniProt Consortium. The Universal Protein Resource (UniProt) in 2010. Nucleic Acids Research. 2010;38:D142–D148. doi: 10.1093/nar/gkp846. [DOI] [PMC free article] [PubMed] [Google Scholar]
- Finn RD, Mistry J, Tate J, Coggill P, Heger A, Pollington JE, Gavin OL, Gunasekaran P, Ceric G, Forslund K, Holm L, Sonnhammer ELL, Eddy SR, Bateman A. The Pfam protein families database. Nucleic Acids Research. 2010;38:D211–D222. doi: 10.1093/nar/gkp985. [DOI] [PMC free article] [PubMed] [Google Scholar]
- Nocedal J. Updating quasi-Newton matrices with limited storage. Mathematics of Computation. 1980;35(151):773–782. doi: 10.1090/S0025-5718-1980-0572855-7. [DOI] [Google Scholar]


