Abstract
Cauliflower-like DNAs are stem-loop DNAs that are fabricated periodically in inverted repetitions from deoxyribonucleic acid phosphates (dNTPs) by loop-mediated isothermal amplification (LAMP). Cauliflower-like DNAs have ladder-shape behaviors on gel electrophoresis, and increasing the time of LAMP leads to multiplying the repetitions, stem-loops, and electrophoretic bands. Cauliflower-like DNAs were fabricated via LAMP using two loop primers, two bumper primers, dNTPs, a λ-phage DNA template, and a Bst DNA polymerase in 75- and 90-min periods. These times led to manufacturing two types of cauliflower-like DNAs with different contents of inverted repetitions and stem-loops, which were clearly indicated by two comparable electrophoresis patterns in agarose gel. LAMP-fabricated DNAs and natural dsB-DNA (salmon genomic DNA) were dialyzed in Gomori phosphate buffer (10 mM, pH 7.4) to be isolated from salts, nucleotides, and primers. Dialyzed DNAs were studied using UV spectroscopy, circular dichroism spectropolarimetry, and fluorescence spectrophotometry. Structural analyses indicated reduction of the molecular ellipticity and extinction coefficients in comparison with B-DNA. Also, cauliflower-like DNAs demonstrated less intrinsic and more extrinsic fluorescence in comparison with natural DNA. The overwinding and lengthening of the cauliflower-like configurations of LAMP DNAs led to changes in physical parameters of this type of DNA in comparison with natural DNA. The results obtained introduced new biomolecular characteristics of DNA macromolecules fabricated within a LAMP process and show the effects of more inverted repeats and stem-loops, which are manufactured by lengthening the process.
Keywords: LAMP, nanostructures, extinction coefficient, extrinsic, intrinsic
INTRODUCTION
Cauliflower-like DNAs are the main products of loop-mediated isothermal amplification (LAMP),1,2 which amplifies DNA by a unique methodology. In LAMP, Bst DNA polymerase is a thermophile enzyme with strand-displacement activity, which uses loop and bumper primers to synthesize DNAs in inverted repetitions.3,4 The bottom-up approach for fabrication of periodic DNAs by LAMP leads to ladder-shape behaviors on gel electrophoresis. The increased electrophoretic bands of cauliflower-like DNAs in the agarose gel indicate more inverted repetitions and more stem-loops overwound in more lengths of DNAs.
LAMP has been used in molecular diagnoses of microorganisms in several studies.5–10 There are no reports of structural or spectroscopic analyses of cauliflower-like DNAs in the literature. However, there are some reports describing the use of LAMP in the development of microfluidic diagnostic devices11,12 or coupling its application with rolling circle amplification (RCA) for detection of short lengths of DNA.13
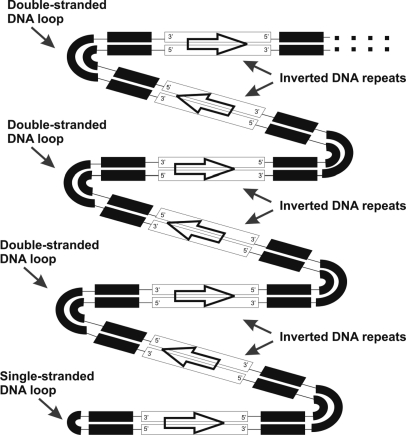
The LAMP process, in amplification of DNA, indicates manufacturing different forms of DNAs, which have been extended using several loop structures.14 Scanning tunneling microscopy demonstrated the presence of μ-length DNAs with periodic inverted sequences, three-way DNA nanojunctions, and stem-loops in a LAMP product.15 One of the important characteristics of cauliflower-like DNAs is the presence of two types of stem-loops in their structures, which are different in comparison with natural dsDNAs. ssDNA loops are always present at the one end of each cauliflower-like configuration, and double-stranded loops join inverted DNA repeats to each other (Scheme 1).
SCHEME 1.
Animation of one periodic and inverted repetitions of a cauliflower-like DNA. The structure includes ssDNA and dsDNA loops, in addition to numerous inverted repeats of a specific DNA sequence.
It appears that cauliflower-like DNAs include different biophysical characteristics in comparison with the other forms of nucleic acids16–19; thus, in the present study, we characterized the macromolecules by UV and circular dichroism (CD) spectroscopies. Also, intrinsic and extrinsic fluorescence properties of these kinds of DNA were analyzed relative to natural B-DNA.
MATERIALS AND METHODS
Chemicals, Instruments, and Oligonucleotides
UV spectroscopy measurements were performed with a UV S-2100 spectrophotometer (Scinco, Korea). CD studies were done with a CD spectropolarimeter J-715 (Jasco, Japan). Fluorescence was measured using an LS-5S fluorescence spectrophotometer (PerkinElmer, Wellesley, MA, USA). Isothermal condition for LAMP reaction was set using a cool-hotter dry bath incubator (Major Science, Taiwan). Bst DNA polymerase was purchased from New England Biolabs (Beverly, MA, USA). Salmon genomic DNA and other chemicals were obtained from Sigma-Aldrich (St. Louis, MO, USA). SYBR® Gold nucleic acid gel stain was purchased from Molecular Probes (Eugene, OR, USA). GeneRuler DNA ladder mix was from Fermentas Life Sciences (Lithuania). λ-DNA were purchased from Takara Biotechnology (Dalian, Japan). Oligonucleotides (Table 1) were synthesized by Sigma-Aldrich.
TABLE 1.
Oligonucleotides for Fabrication of Cauliflower-Like DNAs in the LAMP Process15
| Oligonucleotide | Sequence |
|---|---|
| FIPa | 5′ CAGCCAGCCGCAGCACGTTCGCTCATAGGAGATATGGTAGAGCCGC 3′ |
| BIPb | 5′ GAGAGAATTTGTACCACCTCCCACCGGGCACATAGCAGTCCTAGGGACAGT 3′ |
| F3 | 5′ GGCTTGGCTCTGCTAACACGTT 3′ |
| B3 | 5′ GGACGTTTGTAATGTCCGCTCC 3′ |
aFIP, forward internal primer;
bBIP, backward internal primer.
Fabrication of Cauliflower-Like DNAs
Reaction mix [12.5 μL; 2× reaction mix; 40 mM Tris-HCl, 20 mM KCl, 16 mM MgSO4, 20 mM (NH4)2SO4, 0.2% Tween 20, 1.6 M betain, and 2.8 mM each deoxyribonucleic acid phosphates, pH 8.8], 2.5 μl primer mix (1.6 μM FIP, 1.6 μM BIP, 0.2 μM F3, 0.2 μM B3), 8 U Bst DNA polymerase, and 7 μl distilled water were dispensed in each microtube. λ-DNA (300 ng) was added to the master mix. For negative-control reaction, 2.0 μl distilled water was added to the microtubes. The solutions were mixed by pipetting and then spun down.15
The tubes were set in the block of the cool-hotter dry bath incubator and incubated at 60°C for 75 and 90 min separately. Then, Bst DNA polymerase was inactivated by incubating the mixture for 5 min at 80°C to terminate the reaction.15
Gel Electrophoresis of Cauliflower-Like DNAs
Gel electrophoresis was performed on a 2% (w/v) agarose gel with 0.5× TBE as gel and electrophoresis buffer. Electrophoreses were run at 7 V/cm for 1.5 h. Gels were stained using SYBR® Gold nucleic acid gel stain, following the manufacturer's instruction. The amounts of DNA loaded into the gel were adjusted to yield approximately equal brightness in all lanes. Lane 1, 6 μl DNA ladder (0.1–10 kb); lanes 2 and 3, 5 and 7 μl dialyzed, cauliflower-like DNAs fabricated in 90 min; lanes 4 and 5, 7 and 5 μl dialyzed, cauliflower-like DNAs fabricated in 75 min.15
DNA Measurement by Dische Colorimetric Assay
For determination of DNA concentrations, Dische colorimetric assay was used.20,21 A stock solution of 3 mg/ml dialyzed salmon genomic DNA was prepared by dissolving the DNA in 1× sodium citrate buffer (20× SSC; 175 g NaCl, 88 g trisodium citrate; in 1 L distilled water, pH 7). Then, a series of known standard solutions was prepared by serially diluting the stock solution. To each volume of the standard solutions was added 2 vol Dische diphenylamine reagent (500 mg diphenylamine, 49 ml glacial acetic acid, 1 ml concentrated HCl) and mixed well. The tubes were placed in a boiling water bath for 10 min and then transferred in an ice bath to be cooled. Absorbance of each standard tube was measured at λ = 600 nm by a UV spectrophotometer. The absorbance against DNA concentration was plotted, and after performing a linear regression of the data, the extinction coefficient was calculated. For cauliflower-like DNAs, serial dilutions of dialyzed DNAs (free from salts, nucleotides, and primers) were made in 1× SSC and their concentrations measured using the calculated extinction coefficient.
UV Spectroscopy
Dialyzed salmon genomic DNA (50 μg; natural B-isoform of dsDNA); dialyzed 75 min fabricated, cauliflower-like DNAs; and dialyzed 90 min fabricated, cauliflower-like DNAs were prepared in Gomori buffer (10 mM, pH 7.4). These concentrations were determined according to the Dische colorimetric assay. Then, UV spectra of DNAs were measured between λ = 200 nm and 300 nm wavelengths.
A series of known standard solutions was prepared by serially diluting the DNAs. Absorbance of each standard tube was measured at λ = 260 nm by a UV spectrophotometer. The absorbance against DNA concentration was plotted, and after performing a linear regression of the data, the extinction coefficients were calculated.22
CD Spectroscopy
Salmon genomic DNA (0.5 mg/ml) and 75 min and 90 min fabricated, cauliflower-like DNAs were prepared after dialyzing in Gomori buffer (10 mM, pH 7.4) at 4°C for 16 h. CD spectra were measured at λ = 195–325 nm.23 CD parameters were set as the step resolution at 1 nm, speed 100 nm/min, accumulation at 1, response at 1 s, bound width at 1 nm, and sensitivity at 200 millidegree (mdeg). Noise in the data was smoothed using Jasco J-715 software, including the fast Fourier-transform noise-reduction routine, which allows enhancement of most noisy spectra without distorting their peak shape.23,24
Fluorescence Spectroscopy
For intrinsic fluorescence measurements, 1 μg/ml dialyzed salmon genomic DNA and 75 min and 90 min fabricated, cauliflower-like DNAs in 10 mM Gomori buffer (pH 7.4) were used. The fluorescence spectrophotometer was prepared by setting the excitation wavelength to 270 nm and 330 nm for specifically intrinsic emission of DNA.25 The emission spectra were plotted to 390–500 nm for intrinsically fluorescent emission of DNAs.
For extrinsic fluorescence measurements, 31.25 ng/ml dialyzed salmon genomic DNA and 75 min and 90 min fabricated, cauliflower-like DNAs in 1× SYBR® Gold solution (diluted in Gomori buffer 10 mM, pH 7.4) were used for the extrinsic fluorescence study. The fluorescence spectrophotometer was prepared by setting the excitation wavelength to 495 nm and the emission wavelength to 537 nm.
RESULTS
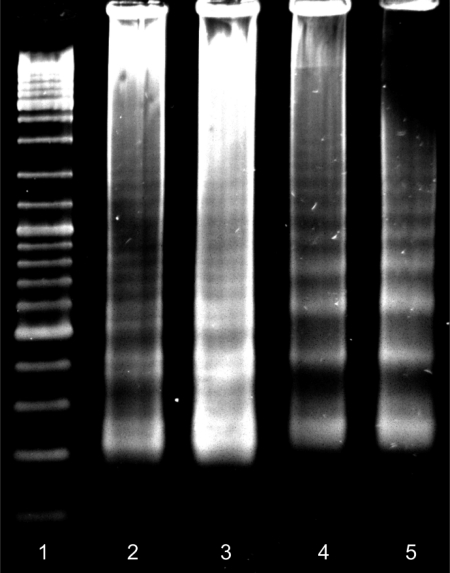
Gel electrophoresis of cauliflower-like DNAs, fabricated after 75 min and 90 min LAMP reactions, demonstrated ladder-shape behaviors (Fig. 1). Increasing the LAMP period from 75 min to 90 min increased the DNA bands on the gel and resulted in more complex, cauliflower-like DNAs. Ladder patterns of these DNAs confirmed their repetitive characteristics.
FIGURE 1.
Gel electrophoresis of cauliflower-like DNAs. Lane 1, GeneRuler DNA Ladder (Fermentas Life Sciences); lanes 2 and 3, reproducibility and specificity of LAMP reactions in fabrication of cauliflower-like DNAs after 90 min; lanes 4 and 5, reproducibility and specificity of LAMP reactions in fabrication of cauliflower-like DNAs after 75 min. Electrophoresis was performed on 2% w/v agarose gel in 0.5× TBE buffer, pH 7.8.
UV Measurements
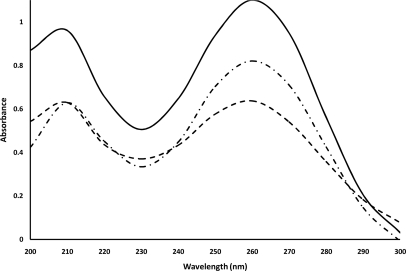
UV spectra of 75 min and 90 min fabricated, cauliflower-like DNAs had less intensity at λ = 260 nm in comparison with natural DNA (Fig. 2). Also, the peak spectrum of 75 min fabricated DNAs had less intensity at λ = 260 nm wavelength when compared with that of 90 min fabricated DNAs.
FIGURE 2.
UV spectra of salmon genomic DNA (solid line), 75 min fabricated, cauliflower-like DNAs (dashed line), and 90 min fabricated, cauliflower-like DNAs (dashed/dotted line) in 10 mM Gomori buffer (pH 7.4). The plotted results are averages of triplication analysis.
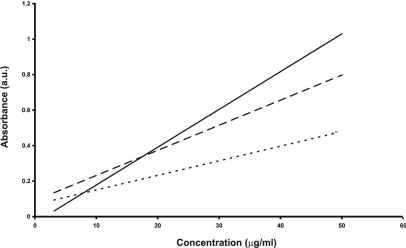
Extinction coefficients of cauliflower-like DNAs and salmon genomic DNA are indicated in Table 2 and Fig. 3. Obtained results showed that cauliflower-like DNAs had lower extinction coefficients than natural DNA. Additionally, the value for 75 min fabricated, cauliflower-like DNAs was less than that of 90 min fabricated, cauliflower-like DNAs.
TABLE 2.
Calculated Extinction Coefficients of Salmon Genomic DNA and Cauliflower-Like DNAs
| Type of DNA | Preparation mode | Extinction coefficient (μml)–1 cm–1 |
|---|---|---|
| Salmon genomic DNA | Isolated from salmon | 0.020a |
| Cauliflower-like DNA | By LAMP after 75 min | 0.008a |
| Cauliflower-like DNA | By LAMP after 90 min | 0.014a |
aThe results are averages of triplication analysis.
FIGURE 3.
Extinction coefficient plots of salmon genomic DNA (solid line), 90 min fabricated, cauliflower-like DNAs (dashed line), and 75 min cauliflower-like DNAs (dotted line) in 10 mM Gomori buffer (pH 7.4). The plotted results are averages of triplication analysis.
CD Spectroscopy
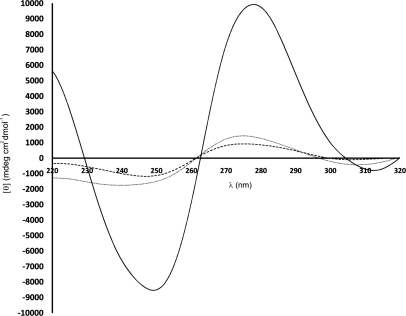
CD spectra of cauliflower-like DNAs showed lower molecular ellipticities than those of natural DNA (Fig. 4). Also, 75 min fabricated, cauliflower-like DNAs had lower negative [–844±330 mdeg cm2 decimol (dmol)–1] and positive (950±240 mdeg cm2 dmol–1) maxima in comparison with 90 min fabricated, cauliflower-like DNAs (–1005±650 mdeg cm2 dmol–1 and 1753±433 mdeg cm2 dmol–1, respectively).
FIGURE 4.
CD spectra of salmon genomic DNA (solid line), 75 min fabricated, cauliflower-like DNAs (dashed line), and 90 min fabricated, cauliflower-like DNAs (dotted line) in 10 mM Gomori buffer (pH 7.4). The plotted results are averages of triplication analysis.
Fluorescence Studies
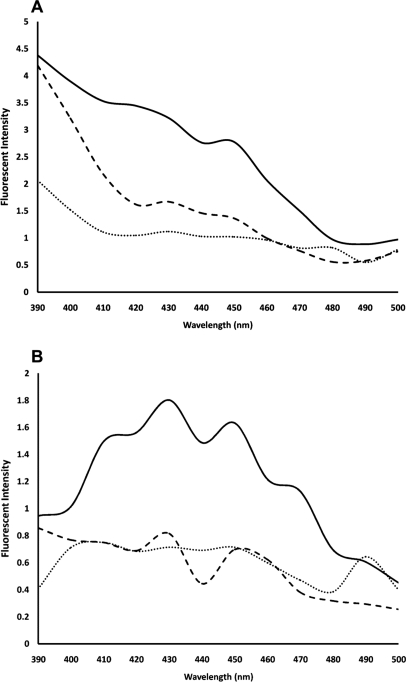
Fluorescence spectra showed lower intrinsic intensity of cauliflower-like DNAs in comparison with natural DNA (Fig. 5). In addition, 75 min fabricated, cauliflower-like DNAs showed higher emission of intrinsic fluorescence (between 390 and 500 nm) than 90 min fabricated DNAs when excited at 270 nm (Fig. 5A). However, 75 min and 90 min fabricated DNAs had similar fluorescence intensities (between 390 and 500 nm wavelengths) when excited at 339 nm (Fig. 5B).
FIGURE 5.
Intrinsic fluorescence spectra of 75 min fabricated, cauliflower-like DNAs (dashed lines), 90 min cauliflower-like DNAs (dotted lines), and salmon genomic DNA (solid lines) in 10 mM Gomori buffer (pH 7.4). (A, B) Spectra were prepared by setting the excitation wavelength to 270 nm and 339 nm, respectively. The plotted results are averages of triplication analysis.
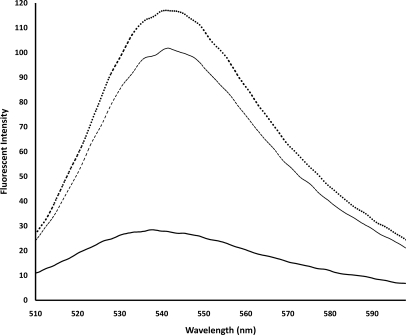
Fluorescence spectra showed lower extrinsic intensity of natural DNA in comparison with cauliflower-like DNAs. In addition, 90 min fabricated, cauliflower-like DNAs demonstrated higher intensities in extrinsic fluorescence than 75 min fabricated DNAs (Fig. 6).
FIGURE 6.
Extrinsic fluorescence spectra of 75 min fabricated, cauliflower-like DNAs (dashed line), 90 min cauliflower-like DNAs (dotted line), and salmon genomic DNA (solid line) with 1× SYBR® Gold in 10 mM Gomori buffer (pH 7.4). The spectra were prepared by setting the excitation wavelength to 495 nm and the emission wavelength to 537 nm. The plotted results are averages of triplication analysis.
DISCUSSION
Top-down and bottom-up fabrications are two approaches for making DNA nanostructures.26–28 Nucleic acid amplifications (nonisothermal and isothermal) have important roles in bottom-up fabrications of two-dimensional DNA nanostructures.29 For instance, RCA has been used in fabrications of DNA nanowires and nanojunctions (cloverleaf-like DNAs)30,31; however, there are no reports of biophysical studies for these new, DNA-based structures.
LAMP process can be used for generation of periodic repetitions of inverted DNAs, which are also called cauliflower-like DNA nanostructures.2,32,33 Like RCA, periodic and very long DNAs are produced in this isothermal reaction, and their complexities are increased by lengthening the process time (Fig. 1).15 It seemed that the more complexity of LAMP-fabricated DNAs modifies their physical characteristics. These periodic DNAs are constructed from repeated sequences of DNA template (dumb-bell-shaped DNAs),1,2,34 which are jointed to each other by stem-loops.35 These loops lead to fabrication of bent and extended, repetitive DNAs, whose sizes are increased periodically and thus, demonstrate a ladder pattern in gel electrophoresis.36 Hence, this study assessed the physical properties of these DNAs using the most common spectroscopic methods (such as UV, CD, and fluorescence spectroscopies) and determined whether cauliflower-like DNAs have the same characteristics as natural dsDNA.
The UV spectra of cauliflower-like DNAs showed smaller intensities at λ = 260 nm relative to natural genomic DNA. Also, the extinction coefficient of 90 min fabricated, cauliflower-like DNA has more similarities to natural B-DNA as a result of increasing UV absorbances at λ = 260 nm. Reduced intensities of the UV spectra indicate that less chromophoric residues (bases) in cauliflower-like DNAs have been exposed to UV light. This may occur as a result of repeated sequences in cauliflower-like DNAs, which have been overwound around themselves, inversely.12 These phenomena are also observed with the calculated extinction coefficients of cauliflower-like DNAs. Moreover, the results suggested the necessity of using colorimetric assays (e.g., Dische method) for determining the concentration of cauliflower-like DNAs rather than UV spectrophotometry of the macromolecules at λ = 260 nm.
CD of nucleic acids is mainly dependent on the stacking geometry of the bases. CD spectra of cauliflower-like DNAs indicated B-isoform structures with smaller molecular ellipticities relative to those of natural B-DNA, which has a conservative CD spectrum above λ = 220 nm, with approximately equal positive (275 nm) and negative (245 nm) components centered around 260 nm.23 Ninety minutes fabricated DNAs had larger negative and positive peaks at 245 nm and 275 nm than those of 75 min fabricated, cauliflower-like DNAs. These results indicated how the time of a LAMP process could affect the structural parameters of the produced DNAs and modify the B-form contents of cauliflower-like DNAs. This may also be the result of inverted DNA repeats of cauliflower-like DNAs, which led to quenching the positive and negative cotton effects in CD spectra.23 On the other hand, the right- and the left-handed rotatory effect of each DNA repeat on polarized light is quenched by another repeat, which has been joined inversely to the previous and the next DNA repeats by stem-loops; thus, lower molecular ellipticities have been demonstrated in CD spectra of cauliflower-like DNAs. Although the exact shapes and magnitudes of the CD spectra will depend on the base sequences, the overall patterns will remain constant.23
Previous studies have reported a weak intrinsic fluorescence for natural dsDNA25 and introduced some procedures to increase the property.37–42 Our results indicated reduced autofluorescence of cauliflower-like DNAs in comparison with natural DNA (Fig. 5). Decreasing of the intrinsic fluorescence may be a result of overwinding of cauliflower-like DNAs relative to natural B-DNA and inverted repeats of DNA sequences in periodic lengths of cauliflower-like DNAs (Scheme 1). These characteristics may be caused by the intrinsic emission of fluorophoric bases of cauliflower-like DNAs, quenched partially in comparison with those in natural DNA.
Using SYBR® Gold staining solution, the extrinsic fluorescence of 90 min fabricated DNAs was higher than that of 75 min fabricated, cauliflower-like DNAs. It seemed that the 90-min fabricated, cauliflower-like DNAs had more capacity for binding the fluorescence dye when compared with the 75-min fabricated DNAs and natural DNAs. Alternatively, more extrinsic fluorescence of 90 min fabricated DNAs may have occurred as a result of expansion of the macromolecules and presence of multiple DNA loops.
In conclusion, our findings confirmed that in vitro fabrication of DNAs by the LAMP process can change some physical characteristics (such as optical properties) of synthesized nanostructures. Results of our experiments demonstrated significant correlation among the results of UV spectroscopy, CD spectropolarimetry, and fluorescence spectrophotometry. For instance, cauliflower-like DNAs with less extinction coefficients and less molecular ellipticities have less B-form DNAs in their contents, lower autofluorescence properties, and lower capabilities for binding an external fluorescence dye in comparison with cauliflower-like DNAs with more fabricating times. Investigations such as this study can reveal new biomolecular properties of LAMP-fabricated DNAs and guide these bioderived nanomaterials for use in biomedicinal and industrial applications in the future.
ACKNOWLEDGMENT
The present study was supported partly by Tarbiat Modares University and Iranian National Science Foundation (INSF). We are also grateful to Negar Naddafi for helping in CD measurements.
REFERENCES
- 1. Notomi T, Okayama H, Masubuchi H, et al. Loop-mediated isothermal amplification of DNA. Nucleic Acids Res 2000;28:E63. [DOI] [PMC free article] [PubMed] [Google Scholar]
- 2. Gill P, Ghaemi A. Nucleic acid isothermal amplification technologies—a review. Nucleosides Nucleotides Nucleic Acids 2008;27:224–243 [DOI] [PubMed] [Google Scholar]
- 3. Nagamine K, Hase T, Notomi T. Accelerated reaction by loop-mediated isothermal amplification using loop primers. Mol Cell Probes 2002;16:223–229 [DOI] [PubMed] [Google Scholar]
- 4. Tomita N, Mori Y, Kanda H, Notomi T. Loop-mediated isothermal amplification (LAMP) of gene sequences and simple visual detection of products. Nat Protoc 2008;3:877–882 [DOI] [PubMed] [Google Scholar]
- 5. Mori Y, Notomi T. Loop-mediated isothermal amplification (LAMP): a rapid, accurate, and cost-effective diagnostic method for infectious diseases. J Infect Chemother 2009;15:62–69 [DOI] [PMC free article] [PubMed] [Google Scholar]
- 6. Misawa Y, Yoshida A, Saito R, et al. Application of loop-mediated isothermal amplification technique to rapid and direct detection of methicillin-resistant Staphylococcus aureus (MRSA) in blood cultures. J Infect Chemother 2007;13:134–140 [DOI] [PubMed] [Google Scholar]
- 7. Hara-Kudo Y, Yoshino M, Kojima T, Ikedo M. Loop-mediated isothermal amplification for the rapid detection of Salmonella. FEMS Microbiol Lett 2005;253:155–161 [DOI] [PubMed] [Google Scholar]
- 8. Ohtsuka K, Yanagawa K, Takatori K, Hara-Kudo Y. Detection of Salmonella enterica in naturally contaminated liquid eggs by loop-mediated isothermal amplification, and characterization of Salmonella isolates. Appl Environ Microbiol 2005;71:6730–6735 [DOI] [PMC free article] [PubMed] [Google Scholar]
- 9. Okamura M, Ohba Y, Kikuchi S, et al. Loop-mediated isothermal amplification for the rapid, sensitive, and specific detection of the O9 group of Salmonella in chickens. Vet Microbiol 2008;132:197–204 [DOI] [PubMed] [Google Scholar]
- 10. Iturriza-Gomara M, Xerry J, Gallimore CI, Dockery C, Gray J. Evaluation of the Loopamp (loop-mediated isothermal amplification) kit for detecting Norovirus RNA in fecal samples. J Clin Virol 2008;42:389–393 [DOI] [PubMed] [Google Scholar]
- 11. Lee SY, Huang JG, Chuang TL, et al. Compact optical diagnostic device for isothermal nucleic acids amplification. Sens Actuators B Chem 2008;133:493–501 [DOI] [PMC free article] [PubMed] [Google Scholar]
- 12. Hataoka Y, Zhang L, Mori Y, Tomita N, Notomi T, Baba Y. Analysis of specific gene by integration of isothermal amplification and electrophoresis on poly (methylmethacrylate) microchips. Anal Chem 2004;76:3689–3693 [DOI] [PubMed] [Google Scholar]
- 13. Marciniak JY, Kummel AC, Esener SC, Heller MJ, Messmer BT. Coupled rolling circle amplification loop mediated amplification for rapid detection of short DNA sequences. BioTechniques 2008;45:275–280 [DOI] [PubMed] [Google Scholar]
- 14. Nagamine K, Watanabe K, Ohtsuka K, Hase T, Notomi T. Loop-mediated isothermal amplification reaction using a nondenatured template. Clin Chem 2001;47:1742–1743 [PubMed] [Google Scholar]
- 15. Gill P, Ranjbar B, Saber R. Scanning tunneling microscopy of cauliflower-like DNA nanostructures synthesized by loop-mediated isothermal amplification. IET Nanobiotechnol 2011;5: 8–13 [DOI] [PubMed] [Google Scholar]
- 16. Tataurov AV, You Y, Owczarzy R. Predicting ultraviolet spectrum of single stranded and double stranded deoxyribonucleic acids. Biophys Chem 2008;133:66–70 [DOI] [PubMed] [Google Scholar]
- 17. Cantor CR, Warshaw MM, Shapiro H. Oligonucleotide interactions. III. Circular dichroism studies of the conformation of deoxyoligonucleotides. Biopolymers 1970;9:1059–1077 [DOI] [PubMed] [Google Scholar]
- 18. Kallansrud G, Ward B. A comparison of measured and calculated single- and double-stranded oligodeoxynucleotide extinction coefficients. Anal Biochem 1996;236:134–138 [DOI] [PubMed] [Google Scholar]
- 19. Danilov VI. On the origin of the hypochromic effect in double-stranded polynucleotides. FEBS Lett 1974;47:155–157 [DOI] [PubMed] [Google Scholar]
- 20. Dische Z. Two characteristic and sensitive color reactions between sulfhydryl compounds and thymonucleic acid. Proc Soc Exptl® Biol Med 1944;55:217–218 [Google Scholar]
- 21. Stumpf PK. A colorimetric method for the determination of deoxyribonucleic acid. J Biol Chem 1974;169:367–371 [PubMed] [Google Scholar]
- 22. Gallagher SR, Desjardins PR. Quantitation of DNA and RNA with absorption and fluorescence spectroscopy. Curr Protoc Protein Sci 2008;52:A. 4K. 1–A. 4K. 21 [DOI] [PubMed] [Google Scholar]
- 23. Ranjbar B, Gill P. Circular dichroism techniques: biomolecular and nanostructural analyses—a review. Chem Biol Drug Des 2009;74:101–120 [DOI] [PubMed] [Google Scholar]
- 24. Protasevich I, Ranjbar B, Lobachov V, et al. Conformation and thermal denaturation of apocalmodulin: role of electrostatic mutations. Biochemistry 1997;36:2017–2024 [DOI] [PubMed] [Google Scholar]
- 25. Pisarevskii N, Cherenkevich SN, Andrianov VT. Fluorescence spectrum and quantum yield of DNA in solution. J Appl Spectroscopy 1966;5:452–454 [Google Scholar]
- 26. LaBean T. Self-assembling DNA nanostructures and DNA-based nanofabrication. Technical Digest, International Electron Devices Meeting, San Francisco, CA, USA 2006;Article number 4154226:1–3 [Google Scholar]
- 27. LaBean TH. Nanotechnology: another dimension for DNA art. Nature 2009;459:331–332 [DOI] [PubMed] [Google Scholar]
- 28. Niemeyer CM. Self-assembled nanostructures based on DNA: towards the development of nanobiotechnology. Curr Opin Chem Biol 2000;4:609–618 [DOI] [PubMed] [Google Scholar]
- 29. Triberis GP, Dimakogianni M. DNA in the material world: electrical properties and nano-applications. Rec Patents Nanotechnol 2009;3:135–153 [DOI] [PubMed] [Google Scholar]
- 30. Lin C, Wang X, Liu Y, Seeman NC, Yan H. Rolling circle enzymatic replication of a complex multi-crossover DNA nanostructure. J Am Chem Soc 2007;129:14475–14481 [DOI] [PMC free article] [PubMed] [Google Scholar]
- 31. Lin C, Xie M, Chen JJL, Liu Y, Yan H. Rolling-circle amplification of a DNA nanojunction. Angew Chem 2006;45:7537–7539 [DOI] [PubMed] [Google Scholar]
- 32. Gill P, Saber R, Tohidi Moghadam T, Ranjbar B. Fabrication of cauliflower-like DNAs by LAMP technology. J Iran Chem Soc 2010;7:S53 [Google Scholar]
- 33. Mori Y, Hirano T, Notomi T. Sequence specific visual detection of LAMP reactions by addition of cationic polymers. BMC Biotechnol 2007;6:1–10 [DOI] [PMC free article] [PubMed] [Google Scholar]
- 34. Kono GT, LaPatra SE, Sakai M. A loop mediated isothermal amplification (LAMP) method for detection of infectious hematopoietic necrosis virus (IHNV) in rainbow trout (Oncorhynchus mykiss). Arch Virol 2005;150:845–1046 [DOI] [PubMed] [Google Scholar]
- 35. Mori Y, Nagamine K, Tomita N, Notomi T. Detection of loop-mediated isothermal amplification by turbidity derived from magnesium pyrophosphate formation. Biochem Biophys Res Commun 2001;289:150–154 [DOI] [PubMed] [Google Scholar]
- 36. Fang X, Liu Y, Kong J, Jiang X. Loop-mediated isothermal amplification integrated on microfluidic chips for point-of-care quantitative detection of pathogens. Anal Chem 2010;82:3002–3006 [DOI] [PubMed] [Google Scholar]
- 37. Ho HA, Doré K, Boissinot M, et al. Direct molecular detection of nucleic acids by fluorescence signal amplification. J Am Chem Soc 2005;127:12673–12676 [DOI] [PubMed] [Google Scholar]
- 38. Lakowicz JR, Shen B, Gryczynski Z, D'Auria S, Gryczynski I. Intrinsic fluorescence from DNA can be enhanced by metallic particles. Biochem Biophys Res Commun 2001;286:875–879 [DOI] [PMC free article] [PubMed] [Google Scholar]
- 39. Sandin P, Wilhelmsson LM, Lincoln P, Powers VEC, Brown T, Albinsson B. Fluorescent properties of DNA base analogue tC upon incorporation into DNA—negligible influence of neighboring bases on fluorescence quantum yield. Nucleic Acids Res 2005;33:5019–5025 [DOI] [PMC free article] [PubMed] [Google Scholar]
- 40. Engman KC, Sandin P, Osborne S, et al. DNA adopts normal B-form upon incorporation of highly fluorescent DNA base analogue tC: NMR structure and UV-Vis spectroscopy characterization. Nucleic Acids Res 2004;32:5087–5095 [DOI] [PMC free article] [PubMed] [Google Scholar]
- 41. Mendez MA, Szalai VA. Fluorescence of unmodified oligonucleotides: a tool to probe G-quadruplex DNA structure. Biopolymers 2009;91:841–850 [DOI] [PubMed] [Google Scholar]
- 42. Zhuang XY, Tang J, Hao Y-H, Tan Z. Fast detection of quadruplex structure in DNA by the intrinsic fluorescence of a single-stranded DNA binding protein. J Mol Recognit 2007;20:386–391 [DOI] [PubMed] [Google Scholar]


