

Abstract
We report the synthesis, one- and two-photon absorption spectroscopy, fluorescence, and electrochemical properties of a series of quadrupolar molecules that feature proquinoidal π-aromatic acceptors. These quadrupolar molecules possess either donor-acceptor-donor (D–A–D) or acceptor-donor-acceptor (A–D–A) electronic motifs, and feature 4-N,N-dihexylaminophenyl, 4-dodecyloxyphenyl, 4-(N,N-dihexylamino)benzo[c][1,2,5]thiadiazolyl or 2,5-dioctyloxyphenyl electron donor moieties and benzo[c][1,2,5]thiadiazole (BTD) or 6,7-bis(3’,7’-dimethyloctyl)[1,2,5]thiadiazolo[3,4-g]quinoxaline (TDQ) electron acceptor units. These conjugated structures are highly emissive in nonpolar solvents and exhibit large spectral red-shifts of their respective lowest energy absorption bands relative to analogous reference compounds that incorporate phenylene components in place of BTD and TDQ moieties. BTD-based D-A-D and A-D-A chromophores exhibit increasing fluorescence emission red-shifts, and a concomitant decrease of the fluorescence quantum yield (Φf) with increasing solvent polarity; these data indicate that electronic excitation augments benzothiadiazole electron density via an internal charge transfer mechanism. The BTD- and TDQ-containing structures exhibit blue-shifted two-photon absorption (TPA) spectra relative to their corresponding one-photon absorption (OPA) spectra, and display high TPA cross-sections (>100 GM) within these spectral windows. D-A-D and A-D-A structures that feature more extensive conjugation within this series of compounds exhibit larger TPA cross-sections consistent with computational simulation. Factors governing TPA properties of these quadrupolar chromophores are discussed within the context of a three-state model.
Introduction
Two-photon absorption (TPA) is the basis for an increasing number of optical and electrooptical applications that include data storage,1–3 3-dimensional microfabrication,4–6 biological imaging,7–12 optical limiting,13–16 and photodynamic therapy.17–21 The potential of these technologies, in turn, continues to drive development of materials with improved two-photon absorption (TPA) properties. For example, TPA-enhanced materials boost absorption efficiency at low excitation intensity, and therefore help minimize damage due to laser irradiation. Therefore, an improved understanding of chromophoric structural factors that may be manipulated to improve TPA will undoubtedly impact a variety of technologies that depend upon this nonlinear optical (NLO) property.
To date, a number of design strategies for materials with large TPA cross-sections (8) have been proposed and demonstrated. d-π-d, D-A-D, and A-D-A structural motifs, where D, π, and A refer, respectively, to electron donor, π-conjugated bridge, and electron acceptor units, have been shown to exhibit exceptionally large TPA cross-sections for many D, π, and A moieties.22–34 Quadrupolar structures, in particular, have experimentally28 and theoretically35,36 demonstrated enhanced TPA cross sections that are approximately an order of magnitude greater than those of dipolar analogues. In addition, quadrupolar compounds have higher fluorescence quantum yields relative to corresponding dipolar compounds, most likely due to cancellation of D-A dipoles which otherwise would tend to induce charge transfer quenching of fluorescence; such augmented fluorescence quantum yields are useful, for example, in imaging technologies that rely on TPA.22,24,28 Corresponding octopolar chromophores,37–42 as well multi-branched conjugated systems that include dendrimers,43–48 can also provide materials with high TPA cross-sections.
Incorporation of proquinoid structures, such as benzothiadiazole and thiadiazoloquinoxaline, into the main chain of π-conjugated oligomers and polymers is an established means to diminish optical and potentiometric band gaps.49–58 π-Conjugated materials that feature benzothiadiazole or thiadiazoloquinoxaline units have been exploited as both emissive and charge transport functional elements for organic light-emitting diodes,54,55,59–63 and as key components of photovoltaic cells60,64–73 and field effect transistors.59,74–76 Since proquinoidal units function as electron accepting moieties in structures having extended conjugation, D–A–D and A–D–A type chromophores that take advantage of benzothiadiazole or thiadiazoloquinoxaline building blocks might be expected to exhibit enhanced TPA properties.
In this paper, we report the synthesis, one- and two-photon absorption spectroscopy, fluorescence, and electrochemical properties of a series of quadrupolar molecules that feature benzothiadiazole or thiadiazoloquinoxaline π-aromatic acceptors, and compute the one- and two-photon absorption spectra for these species, to provide further insight into the origins of the OPA and TPA properties that derive from the presence of the proquinoidal units.
Experimental Section
Materials
Manipulations were carried out under argon previously passed through an O2 scrubbing tower (Schweitzerhall R3–11 catalyst) and a drying tower (Linde 3-Å molecular sieves) unless otherwise stated. Air sensitive solids were handled in a Braun 150-M glove box. Standard Schlenk techniques were employed to manipulate air-sensitive solutions. Tetrahydrofuran (THF) was distilled from K/4-benzoylbiphenyl under N2. Triethylamine, MeOH, and CH2Cl2 were distilled from CaH2 under N2. Pyridine was also dried over CaH2 and distilled under reduced pressure. The catalysts Pd(PPh3)4, tris(dibenzylideneacetone)dipalladium(0) (Pd2dba3), Pd(PhCN)2Cl2, triphenylarsine (AsPh3) and P(t-Bu)3 (10 wt% solution in hexanes) were purchased from Strem Chemicals and used as received. 4-Bromobenzo[c][1,2,5]thiadiazole,77 4,7-dibromobenzo[c][1,2,5]thiadiazole,77 5,6-diamino-4,7-dibromobenzo[c][1,2,5]thiadiazole,78 4,7-bis[(trimethylsilyl)ethynyl]benzo[c][1,2,5]thiadiazole,56 and 4,7-diiodobenzo[c][1,2,5]thiadiazole79 were prepared by literature methods. All NMR solvents were used as received. The supporting electrolyte used in the electrochemical experiments, tetra-n-butylammonium hexafluorophosphate, was recrystallized twice from ethanol and dried under vacuum at 70 °C overnight prior to use. All the other chemicals were used as received.
Chemical shifts for 1H NMR spectra are relative to the tetramethylsilane (TMS) signal in deuterated solvent (TMS, δ = 0.00 ppm). All J values are reported in Hertz. Flash and size exclusion column chromatographic separations were performed on the bench top, using respectively silica gel (EM Science, 230–400 mesh) and Bio-Rad Bio-Beads SX-1 as media. CI mass spectra were acquired at the Mass Spectrometry Center at the University of Pennsylvania. MALDI-TOF mass spectroscopic data were obtained with a PerSeptive Biosystems Voyager-DE RP; samples for these experiments were prepared as micromolar solutions in THF; dithranol (Aldrich) was utilized as the matrix.
Instrumentation
1H NMR spectra were recorded on 360 MHz DMX-360, 300 MHz DMX-300, or 250 MHz AC-250 Brüker spectrometers. Electronic absorption spectra were recorded on a Shimadzu PharmaSpec UV1700 spectrophotometer. Fluorescence spectra were obtained with a Spex Fluorolog-3 spectrophotometer (Jobin Yvon Inc, Edison, NJ) that utilized a PMT detector. These fluorescence spectra were corrected using the spectral output of a calibrated light source supplied by the National Bureau of Standards. Fluorescence quantum yields were measured in argon-purged solutions at room temperature. Quinine sulfate in 1.0 N H2SO4 (Фf = 0.55)80 and rhodamine 101 inner salt in EtOH (Фf = 1.00)81 were used as standards. Time-correlated single-photon counting (TCSPC) experiments that measured fluorescence lifetimes were carried out using an Edinburgh Analytical Instruments FL/FS 900 spectrometer, using either a nanosecond flash lamp operating under an atmosphere of H2 gas (0.50–0.55 bar, 1.2 ns full width at half maximum (fwhm), 40 kHz repetition rate) or a blue (450 ± 15 nm) light-emitting diode (Picoquant PLS 450/PDL 800-B) triggered at a frequency of 100 kHz by a Berkeley Nucleonics 555 pulse generator, as excitation sources.82,83 This diode produced light pulses of 450 ps fwhm with a power of 15 μW. TCSPC data were analyzed by iterative convolution of the fluorescence decay profile with the instrument response function using software provided by Edinburgh Instruments.
Cyclic voltammetric measurements were carried out on an EG&G Princeton Applied Research model 273A Potentiostat/Galvanostat. The electrochemical cell for these experiments utilized a platinum disk working electrode, a platinum wire counter electrode, and a saturated calomel reference electrode (SCE). The reference electrode was separated from the bulk solution by a junction bridge filled with the corresponding solvent/supporting electrolyte solution. The ferrocene/ferrocenium redox couple was utilized as an internal potentiometric standard.
Two-photon Absorption Spectra
The background theory and a detailed experimental description of our TPA spectra measurements were described previously.84,85 The samples were dissolved in toluene at a concentration of 3.8–10.5 × 10⁻⁵ M. The sample cells were degassed by freeze-pump-thaw methods (3 cycles) and filled with argon gas. Throughout our experiments, we used a 100 µM solution of fluorescein in H2O (pH ~ 13) as a standard calibration sample. We assume herein that the one-photon and two-photon fluorescence quantum efficiencies of fluorescein are equal, and that the fluorescence quantum efficiency is constant over the spectral range of the experiment.
Computational Studies
We used time-dependent density-functional theory (TDDFT) within the collective electronic oscillator (CEO) framework recently described by Tretiak et al.86 to calculate one- and two-photon absorption spectra for this series of quadrupolar proquinoid compounds. In our implementation of the CEO framework, frequency-dependent polarizabilities are described by functions that can be obtained from linear-response theory, including corresponding functional derivatives up to third order in the driving field.87 Briefly, the procedure for computing frequency-dependent polarizabilities using TDDFT involved: (1) computing the ground-state density matrix, (2) obtaining a set of transition densities and frequencies (for coupled harmonic oscillators), (3) calculating anharmonicity tensors, and (4) summing over states for the desired response. This method was found to be efficient computationally and accurate for calculating nonlinear polarizabilities of large D-A substituted conjugated molecules.86,88,89 The method typically performs better than semi-empirical methods (such as ZINDO and PM3 methods) and other common ab initio approaches (such as CI singles and time-dependent Hartree-Fock methods) for describing molecular excited states and electronic excitation energies.90,91
All electronic structure and non-linear response calculations were carried out using the GAUSSIAN 9892 and CEO programs,93 while geometry optimization was performed using the Hartree-Fock (HF) method with a 6–31G basis set. In order to maximize computational efficiency, the solubilizing substituents of these proquinoidal chromophores (N,N-dihexylamino, dodecyloxy, octyloxy and 3,7-dimethyloctyl groups) were replaced by structurally simpler analogues (N,N-dimethylamino, methoxy, and methyl groups, respectively)). All molecular geometries were optimized beginning with planar structures with symmetry constraints. The excitation energies, dipole matrices, and Coulomb exchange-interaction matrices were calculated using the TDDFT method in GAUSSIAN 98 with a 6–31G basis set and the B3LYP functional. The energies and corresponding transition densities of the first 10 singlet excited states were calculated. We did not include more excited states in the calculation because it has been reported that increasing the number of excited states from 6 to 30 changes the resulting cross-section by only about 10%.86,89 The CEO program was used to compute first-, second-, and third-order responses based on electronic structure analysis from GAUSSIAN 98.93 These simulations neglected solvation effects. An empirical damping factor Γ = 0.1 eV (obtained from experimental studies of phenylene-vinylene derivatives) was used.22,24
Synthesis and Characterization
A full account of the synthesis and characterization of all new compounds, complete with tabulated spectral data, is provided in the Supporting Information (SI).
Results and Discussion
Synthesis
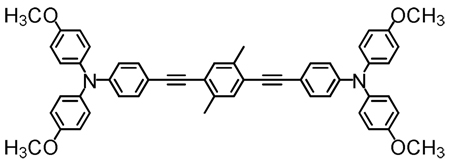
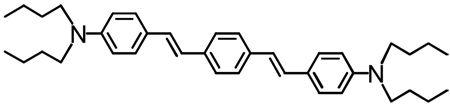
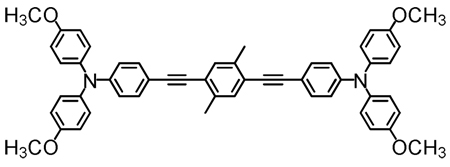
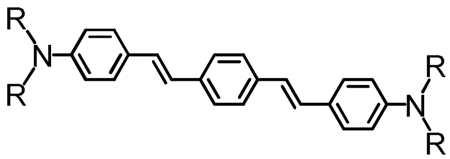
Structures of D-A-D and A-D-A chromophores examined in this study are shown in Figure 1; these molecules were synthesized by Pd-mediated cross-coupling reactions involving substituted aromatic donor and proquinoidal acceptor building blocks (Scheme 1; see Supporting Information for details). 4,7-Diethynylbenzo[c][1,2,5]thiadiazole (BTD) and 4,9-diethynyl-6,7-bis(3’,7’-dimethyloctyl)[1,2,5]thiadiazolo[3,4-g]quinoxaline (TDQ) were selected as proquinodal spacer units. For the thiadiazoloquinoxaline-containing structures, note that 3,7-dimethyloctyl groups serve as 6- and 7-TDQ-ring substituents, which facilitate solubility of these large planar molecules.
Figure 1.

Structures of D-A-D and A-D-A chromophores, along with their respective abbreviations; note that t and d signify connectivities utilizing respectively C-C triple and double bonds.
Scheme 1.


Synthetic routes to D-A-D and A-D-A chromophores and their precursors.
Proquinoidal BTD and TDQ units have been used to drive enhanced conjugation in semiconducting oligomers and polymers, and as electron acceptor moieites;49,51,56,94 these units play a similar role in the Figure 1 chromophores. For these D-A-D and A-D-A structures, aromatic units are connected by either ethyne or ethene linkers, through respective Sonogashira or Heck coupling reactions. These simple, efficient coupling protocols enabled facile synthesis of the Figure 1 compounds (Supporting Information).
One-Photon Absorption Spectra
The linear (one-photon) electronic absorption spectra of the proquinoidal D-A-D and A-D-A molecules, measured in solvents of varying dielectric constant, are displayed in Figure 2. Fluorescence and comparative one-photon absorptive extinction coefficient data acquired in toluene solvent are compiled in Table 1. As highlighted in the Figure 2 spectral data, these chromophores feature excellent solubility in a wide range of solvents, and underscore the chromophoric impact of the proquinoidal components. Notice, for example, that the lowest absorption maxima of (DHAt)2BTD and (DHAd)2BTD are respectively 111 nm (5,681 cm−1) and 131 nm (5,929 cm−1) red-shifted relative to their corresponding reference compounds featuring phenylene spacers (1,4-bis[(4’-N,N-dimethylaminophenyl)ethyn-1’-yl]benzene95 and 1,4-bis[(4’-N,N-di-n-butylaminophenyl)ethen-1’-yl]benzene).24 (ROPht)2TDQ and (ROPhd)2TDQ express similar magnitude spectroscopic red-shifts (10,392 cm−1 (toluene) and ~9,500 cm−1 (CH2Cl2)) of their respective lowest energy absorption maxima, relative to analogous 1,4-bis[(4′-methoxyphenyl)ethyn-1′-yl]benzene95 and 1,4-bis[(4′-n-butoxyphenyl)ethen-1′-ylbenzene96 spectroscopic benchmarks.
Figure 2.

Electronic absorption spectra of: (A) (DHAt)2BTD, (B) (DHAd)2BTD, (C) (ROPht)2TDQ, (D) (ROPhd)2TDQ, (E) (DHA-BTDt)2BTD (F) (BTDt)2ROPh, (G) (DHAtPht)2ROPh, (H) (DHAtBTDt)2ROPh, and (I) (DHAtROPht)2BTD, recorded in cyclohexane, toluene, tetrahydrofuran (THF), CH2Cl2, acetone, and dimethylformamide (DMF) solvents.
Table 1.
The lowest energy linear absorption band maxima, extinction coefficients, and the fluorescence maxima of proquinoidal (DHAt)2BTD, (DHAd)2BTD, (ROPht)2TDQ, (ROPhd)2TDQ, (DHA-BTDt)2BTD, (BTDt)2ROPh, (DHAtPht)2ROPh, (DHAtBTDt)2ROPh, and (DHAtROPht)2BTD chromophores determined in toluene solvent.
| Linear Absorption | Fluorescence Emission | ||||
|---|---|---|---|---|---|
| λabs(nm) | ν(cm−1) | ε(×104 M−1cm−1) | λem(nm) | ν(cm−1) | |
| (DHAt)2BTD | 501 | 19,960 | 3.53 | 598 | 16,722 |
| (DHAd)2BTD | 540 | 18,519 | 3.70 | 651 | 15,361 |
| (ROPht)2TDQ | 562 | 17,794 | 2.04 | 655 | 15,267 |
| (ROPhd)2TDQ | 626 | 15,974 | 2.01 | 727 | 13,755 |
| (DHA-BTDt)2BTD | 549 | 18,215 | 4.61 | 612 | 16,340 |
| (BTDt)2ROPh | 424 | 23,585 | 2.77 | 501 | 19,960 |
| (DHAtPht)2ROPh | 401 | 24,938 | 9.41 | 445 | 22,472 |
| (DHAtBTDt)2ROPh | 515 | 19,417 | 6.96 | 590 | 16,949 |
| (DHAtROPht)2BTD | 494 | 20,243 | 5.64 | 587 | 17,036 |
For systems with identical donor and acceptor units, compounds featuring ethene-based connectivity manifest more substantial low energy absorption band spectroscopic red-shifts relative to corresponding compounds in which ethynyl moieties link aromatic units [λmax((DHAt)2BTD, toluene) = 501 nm < λmax((DHAd)2BTD, toluene) = 540 nm; λmax((ROPht)2TDQ, toluene) = 562 nm < λmax((ROPhd)2TDQ, toluene) = 626 nm)]. While all of these D-A-D and A-D-A chromophores evince only modest solvatochromism of their respective lowest energy absorption band maximum (Figure 2), (DHAt)2BTD, (DHAd)2BTD, (DHA-BTDt)2BTD, (DHAtPht)2ROPh, (DHAtBTDt)2ROPh, and (DHAtROPht)2BTD exhibit systematic red-shifts in their absorption edges with increasing solvent polarity. Note that (ROPht)2TDQ, (ROPhd)2TDQ, and (BTDt)2ROPh do not display similar red-shifts of their long wavelength absorption band edges with increasing solvent polarity, consistent with the diminished electron-releasing character of alkoxyphenyl (ROPh) relative to the dialkylaminophenyl group.
Fluorescence Spectra
In contrast to the linear absorption spectroscopic data, the fluorescence spectra of these proquinoidal D-A-D and A-D-A compounds show a clear dependence on solvent dielectric constant (Figure 3). As the solvent polarity increases, the fluorescence maxima red-shift and the corresponding fluorescence quantum yield decreases (Table 2). Identical spectroscopic trends have been observed in other D-A-D and A-D-A systems, and have been attributed to an S0➔S1 electronic transition having internal charge transfer (ICT) character.39,44,97 For the chromophores featuring dialkylamino electron releasing groups, substantial solvent-dependent Stokes shifts are observed [(DHAt)2BTD (2,176 (cyclohexane) − 4,918 (DMF) cm−1 ); (DHAd)2BTD (2,410 (cyclohexane) − 4,260 (DMF) cm−1 ); (DHA-B Dt)2BD (1,279 (cyclohexane) − 2,985 (DMF) cm−1); (DHAtPht)2ROPh (2,158 (cyclohexane) − 7,209 (DMF) cm−1); (DHAtBTDt)2ROPh (1,123 (cyclohexane) − 5,243 (acetone) cm−1 ); (DHAtROPht)2BTD (2,316 (cyclohexane) − 5,688 (CH2Cl2) cm−1)]; at the other extreme lie the (ROPht)2TDQ and (ROPhd)2TDQ chromophores, which evince only modest solvent-dependent Stokes shifts (ROPht)2TDQ (2,046 (cyclohexane) − 3,068 (acetone) cm−1); (ROPhd)2TDQ (1,969 (cyclohexane) − 2,468 (CH2Cl2) cm−1)], suggesting a diminished degree of ICT character to their respective S0➔S1 and S1➔S0 electronic transitions.
Figure 3.

Fluorescence spectra of: (A) (DHAt)2BTD, (B) (DHAd)2BTD, (C) (ROPht)2TDQ, (D) (ROPhd)2TDQ, (E) (DHA-BTDt)2BTD, (F) (BTDt)2ROPh, (G) (DHAtPht)2ROPh, (H) (DHAtBTDt)2ROPh, and (I) (DHAtROPht)2BTD, recorded in cyclohexane, toluene, THF, CH2Cl2, acetone, and DMF solvents. Sharp peaks evident at ~500 and 800 nm derive from scattered light from the excitation source.
Table 2.
Fluorescence Quantum Yields of Proquinoidal D-A-D and A-D-A Chromophores Determined in Cyclohexane, Toluene, THF, CH2Cl2, Acetone, and DMF Solvents.
| Cyclohexane | Toluene | THF | CH2Cl2 | Acetone | DMF | |
|---|---|---|---|---|---|---|
| (DHAt)2BTD | 0.87 | 0.84 | 0.31 | 0.25 | 0.011 | 0.0031 |
| (DHAd)2BTD | 0.75 | 0.42 | 0.13 | 0.037 | 0.031 | 0.0083 |
| (ROPht)2TDQ | 0.48 | 0.42 | 0.27 | 0.27 | 0.25 | |
| (ROPhd)2TDQ | 0.054 | 0.034 | 0.017 | 0.013 | ||
| (DHA-BTDt)2BTD | 0.13 | 0.088 | 0.11 | 0.095 | 0.014 | 0.0034 |
| (BTDt)2ROPh | 0.59 | 0.66 | 0.48 | 0.37 | 0.15 | |
| (DHAtPht)2ROPh | 0.86 | 0.89 | 0.88 | 0.78 | 0.35 | 0.13 |
| (DHAtBTDt)2ROPh | 0.65 | 0.80 | 0.14 | 0.080 | 0.0012 | <0.001 |
| (DHAtROPht)2BTD | 0.59 | 0.56 | 0.0097 | 0.0013 | <0.001 | <0.001 |
Solvent-polarity-dependent fluorescence spectra can be interpreted in terms of the Lippert equation (eq. (1)), which expresses the magnitude of the Stokes shift in terms of changes in the molecular dipole moment that occur concomitantly with electronic excitation.
| (1) |
Here ṽa and ṽf are the respective peak absorption and emission energies expressed in wavenumbers, ε is the dielectric constant, n is the refractive index of the solvent, εE and εG correspond respectively to the magnitudes of the excited- and ground-state dipole moments, h is Planck’s constant, c is the speed of light, and a is the radius of the solute spherical cavity.
The bracketed term in eq. 1 is often referred to as the orientational polarizability (Δf; eq. 2).
| (2) |
Plots of the magnitude of the Stokes shift (ṽa – ṽf) versus the orientational polarizability are displayed in Figure 4. This analysis highlights the fact that the slopes of the Lippert plots for the TDQ-containing chromophores are smaller than those of the D-A-D and A-D-A structures that are based on the BTD unit. This result likely derives from (i) the reduced electron-releasing character of alkoxyphenyl relative to the dialkylaminophenyl group, which leads to smaller magnitude εE –εG values, and (ii) the fact that TDQ possesses a larger solute spherical cavity radius relative to BTD. Likewise, it is interesting that the observed Lippert plot slopes for the longer (DHAtBTDt)2ROPh and (DHAtROPht)2BTD molecules are similar in magnitude to the slope for the shorter (BTDt)2ROPh chromophore; this effect is consistent with the expectation that while (DHAtBTDt)2ROPh and (DHAtROPht)2BTD should possess larger (μE–μG) values relative to that for (BTDt)2ROPh, the solvent spherical cavity sizes for these species are also correspondingly larger.
Figure 4.

Lippert plots determined for the (DHAt)2BTD, (DHAd)2BTD, (ROPht)2TDQ, (ROPhd)2TDQ, (DHA-BTDt)2BTD, (BTDt)2ROPh, (DHAtPht)2ROPh, (DHAtBTDt)2ROPh, and (DHAtROPht)2BTD chromophores.
Electrochemical properties
Figure 5 shows the potentiometrically determined E1/20/+ and E1/2−/0 valuesfor these proquinoidal D-A-D and A-D-A chromophores; these electrochemical data are tabulated in Table 3. The Figure 5 potentiometric data highlight a number of key electronic structural features of these compounds. For example, replacing ethyne by ethene in the spacer structure [(DHAt)2BTD, (DHAd)2BTD; (ROPht)2TDQ, (ROPhd)2TDQ] lowers the first oxidation and reduction potentials by ~350 and ~150 mV, respectively, in these BTD- and TDQ-based chromophores and therefore leads to a correspondingly smaller potentiometrically determined HOMO–LUMO gap (Ep), mirroring the trend observed for the optical band gaps (Eop) of these species (Figure 2).
Figure 5.

Potentiometrically determined E1/20/+ and E1/2−/0 values measured in CH2Cl2 solvent for: (A) (DHAt)2BTD, (B) (DHAd)2BTD, (C) (ROPht)2TDQ, (D) (ROPhd)2TDQ, (E) (DHA-BTDt)2BTD, (F) (BTDt)2ROPh, (G) (DHAtPht)2ROPh, (H) (DHAtBTDt)2ROPh, and (I) (DHAtROPht)2BTD. Experimental conditions are described in Table 3. Redox potentials shown are relative to the ferrocene/ferrocenium (Fc/Fc+) redox couple, which was used as an internal standard in these experiments.
Table 3.
Comparative Potentiometric Data Acquired for Proquinoidal D-A-D and A-D-A Chromophores.a
| E1/20/+ (Epa)b | E1/2−/0 | |
|---|---|---|
| (DHAt)2BTD | ----- (0.40) | −1.74 |
| (DHAd)2BTD | 0.04 (0.12) | −1.92 |
| (ROPht)2TDQ | 0.76c (0.80) | −1.28 |
| (ROPhd)2TDQ | ----- (0.38) | −1.39 |
| (DHA-BTDt)2BTD | ----- (0.36) | −1.70 |
| (BTDt)2ROPh | 0.91 (0.98) | −1.84 |
| (DHAtPht)2ROPh | ----- (0.43) 0.46d (0.57) |
----- −2.54d |
| (DHAtBTDt)2ROPh | ----- (0.46) 0.36e (0.44) |
−1.72 −1.66e |
| (DHAtROPht)2BTD | 0.32 (0.41) | −1.66 |
Cyclic voltammetric experimental conditions: [chromophore] = ~1 mM; solvent = CH2Cl2; [TBAPF6] = 0.10 M; scan rate = 200 mV/s; reference electrode = SCE; working electrode = Pt disk or glassy carbon. All potentials are reported relative to the ferrocene/ferrocenium redox couple, which was used as an internal standard in these experiments.
Anodic peak potential
Scan rate = 400 or 500 mV/s
in THF
in PhCN
The structures of (DHA-BTDt)2BTD and (DHAt)2BTD are closely related; (DHA-BTDt)2BTD features terminal dihexylamino groups directly attached to benzothiadiazole rather than phenyl groups. Figure 5 data suggest that replacement of the terminal phenyl by BTD destabilizes the HOMO level by 0.04 V, while stabilizing the LUMO to a similar degree; these data thus indicate that (DHA-BTDt)2BTD and (DHAt)2BTD possess comparable extents of electronic delocalization and ICT character in their respective ground and low energy excited states.
Note that the reduction potential of (BTDt)2ROPh (−1.84 V vs. Fc/Fc+) is shifted cathodically relative to that for 4,7-bis[(trimethylsilyl)ethynyl]benzo[c][1,2,5]thiadiazole (BTD(E-TMS)2) (−1.66 V). Since the ethyne group typically acts as a weak acceptor, the higher reduction potential of BTD(E-TMS)2 compared to (BTDt)2ROPh suggests that the two terminal benzothiadiazole groups in (BTDt)2ROPh are not strongly conjugated to the central dialkoxyphenyl unit in the LUMO level.
Finally, Figure 5 shows that the reduction potential of (DHAtBTDt)2ROPh (−1.72 V) is ~ 100 mV stabilized relative to that determined for (BTDt)2ROPh, as expected due its expanded conjugation. In contrast, note that the oxidation potential of (DHAtBTDt)ROPh is similar to that of (DHAtPht)ROPh, suggesting that the HOMO is localized extensively on the dihexylaminophenyl groups, or only weakly delocalized with the remainder of linear π-conjugated system. Likewise, these potentiometric data indicate that the reduction potential of (DHAtROPht)2BTD (−1.66 V) resembles that of BTD(E-TMS)2, suggesting a LUMO localized primarily on the diethynylbenzothiadiazole unit; this trend is evident in the Figure 5 data, which shows clearly that the BTD and TDQ units play a dominant role in determining the potentiometrically determined LUMO levels.
Two-photon absorption spectra
Two-photon absorption cross-sections were determined by measurements of two-photon fluorescence excitation spectra98,99 with femtosecond laser pulses in the spectral range between 750 and 960 nm. The two-photon induced fluorescence excitation spectra are shown in Figure 6. TPA cross-sections (δ values; expressed in Göppert-Mayer or GM units), where 1 GM = 1×10−50 cm4 s molecule−1 photon−1), and maxima, are given in Table 4.
Figure 6.

Two-photon fluorescence excitation spectra determined in toluene solvent for: (A) (DHAt)2BTD, (B) (DHAd)2BTD, (C) (ROPht)2TDQ, (D) (ROPhd)2TDQ, (E) (DHA-BTDt)2BTD, (F) (BTDt)2ROPh, (G) (DHAtPht)2ROPh, (H) (DHAtBTDt)2ROPh, and (I) (DHAtROPht)2BTD. Systematic error for δ is ±30% for each point.
Table 4.
TPA Data Acquired for Proquinoidal D-A-D and A-D-A Chromophores Along with those for Reference Compounds in Toluene Solvent.
| Egea (eV) |
εmaxb (M−1cm−1) |
Mgec (D) |
TPA maxima (nm) |
ħωd (eV) |
(Ege–ħω) (eV) |
δe(GM) | Mee’f (D) |
|
|---|---|---|---|---|---|---|---|---|
| (DHAt)2BTD | 2.47 | 35,300 | 8.00 | 850 | 1.46 | 1.01 | 230 | 6.9 |
| (DHAd)2BTD | 2.30 | 37,000 | 8.53 | 890 | 1.39 | 0.91 | 270 | 6.5 |
| (ROPht)2TDQ | 2.21 | 20,400 | 6.39 | g | g | g | g | g |
| (ROPhd)2TDQ | 1.98 | 20,100 | 6.62 | g | g | g | g | g |
| (DHA-BTDt)2BTD | 2.26 | 46,100 | 9.19 | 910 | 1.36 | 0.90 | 100 | 3.7 |
| (BTDt)2ROPh | 2.92 | 27,700 | 6.96 | 780 | 1.59 | 1.33 | 120 | 6.9 |
| (DHAtPht)2ROPh | 3.09 | 94,100 | 12.66 | 760 | 1.63 | 1.46 | 630 | 9.2 |
| (DHAtBTDt)2ROPh | 2.41 | 69,600 | 11.41 | 830 | 1.49 | 0.92 | 330 | 5.1 |
| (DHAtROPht)2BTD | 2.51 | 56,400 | 10.30 | 890 | 1.39 | 1.12 | 390 | 8.0 |
| Reference Ah | 3.19 | 11.4 | 712 | 1.74 | 1.45 | 980 | 12.4 | |
| Reference Bi | 3.03 | 10.7 | 730 | 1.70 | 1.33 | 995 | 12.1 |
S0➔S1 electronic transition.
Extinction coefficient.
S0➔S1 transition dipole moment.
Excitation energy.
Two photon absorption cross section.
Transition dipole moment between the S1 state and two-photon allowed higher-lying excited states.
These parameters were not evaluated for TDQ derivatives due to possible mixing of OP A and TPA.
The values were extracted from ref. 102.
The values were extracted from ref. 24.
Based on their spectral shapes (Figure 6), the actual TPA peaks of (DHA-BTDt)BTD, (BTDt)ROPh, (DHAtPht)ROPh, and (DHAtROPht)BTD may lie outside of the spectral window analyzed in the present study; otherwise, the peak TPA cross-sections for all of the present compounds are comparable to those of similar benzothiadiazole derivatives reported recently.100,101 To facilitate comparison with the corresponding OPA spectra, TPA spectra are plotted as a function of λex/2 (Figure 7). All of the compounds showed TPA maxima higher in energy than the corresponding OPA maxima.
Figure 7.

Normalized one-photon absorption and two-photon excitation spectra of: (A) (DHAt)2BTD, (B) (DHAd)2BTD, (C) (ROPht)2TDQ, (D) (ROPhd)2TDQ, (E) (DHA-BTDt)2BTD, (F) (BTDt)2ROPh, (G) (DHAtPht)2ROPh, (H) (DHAtBTDt)2ROPh, and (I) (DHAtROPht)2BTD. The solid line represents the one-photon absorption spectrum. The two-photon fluorescence excitation spectral data are displayed as solid circles (the dotted line serves only as a guide to the eye). Except for (ROPhd)2TDQ (D), the two-photon fluorescence excitation spectral data are plotted as a function of the total transition energy (twice the photon energy). Note that the (ROPhd)2TDQ fluorescence excitation data is plotted as a function of the photon energy to highlight the extent to which the TPA magnitude rises near the low energy absorption edge.
Linearity tests of power-squared fluorescence dependence were performed at varying laser excitation wavelengths for selected samples and are shown in Figure 8; the corresponding magnitudes of these slopes are given in Table 5. While the large TPA cross-sections below 800 nm for (ROPht)2TDQ may arise from residual OPA, it is important to note that the slope (1.82) of the two-photon excited fluorescence intensity as a function of the logarithm of the laser power at 780 nm indicates significant TPA. Note that the available spectral window for (ROPhd)2TDQ (Figure 7D) was mostly dominated by OPA; all other compounds showed pure TPA within the spectral window interrogated.
Figure 8.

The dependence of the two-photon excited fluorescence intensity, plotted logarithmically as a function of the logarithm of the laser power P, for chromophores (A) (DHAt)2BTD, (B) (DHAd)2BTD, (C) (ROPht)2TDQ, and (D) (DHAtPht)2ROPh.
Table 5.
Linearity Tests for Power-Squared Fluorescence Dependence of Proquinoid D-A-D and A-D-A Chromophores in Toluene Solvent.
| Compounds | λ(nm) | Slope a,b |
|---|---|---|
| (DHAt)2BTD | 850 | 2.06 |
| (DHAd)2BTD | 900 | 1.89 |
| (ROPht)2TDQ | 780 | 1.82 |
| (BTDt)2ROPh | 810 | 1.65 |
| (DHAtPht)2ROPh | 830 | 1.86 |
| (DHAtBTDt)2ROPh | 870 | 1.77 |
| (DHAtROPht)2BTD | 900 | 2.07 |
Values displayed are the slopes of the linear regression fits to logarithmic plots of fluorescence intensity versus incident excitation laser intensity.
Estimated uncertainty of the slope is ±0.1.
The TPA cross-section δ is related to the imaginary part of the second-order hyperpolarizability γ through eq. (3):
| (3) |
where ħ is Planck’s constant divided by 2π, ω is the excitation frequency, n is the refractive index of the medium, c is the speed of light, L is the local field factor (L = (n2+2)/3), and Im indicates the imaginary part of the complex quantity <γ>, the orientational average of γ.
| (4) |
Here Mge is the transition dipole moment between the ground state (S0) and the first excited state (S1), Δμge is the difference in dipole moments between S0 and S1, Ege is the transition energy between S0 and S1, ħω is the excitation energy, Г is a damping factor, Mee’ is the transition dipole moment between S1 and two-photon allowed higher excited states.
The first term in eq. (4) is the dipolar term, which is absent for quadrupolar compounds because Δμge vanishes. The third term is related to one-photon resonance and has no contribution to the TPA. Therefore, eq. (4) is dominated by the second term for quadrupolar compounds. Despite cancellation of the dipolar term, TPA cross sections of quadrupolar structures have been demonstrated to be higher than those of dipolar analogues; note that the Mee, term similarly vanishes for corresponding dipolar chromophores.28 The three-state TPA cross-section for quadrupolar compounds with electronic states g,e, and e′ is
| (5) |
The transition moments Mge are obtained from the area under the lowest energy absorption band. The energy difference (Ege – ħω) is a detuning factor. Γge’ was assumed to be 0.1 eV in all cases.22,24,28 Mee’ was derived using eq. (5), along with the other experimental parameters. Each parameter of eq. (5) is tabulated in Table 4.
As expected from eq. (5), the TPA cross-section of quadrupolar compounds can be enhanced (within a three-state ansatz) by (i) increasing the transition dipole moment between the ground state and the first excited state, (ii) increasing the transition dipole moment between the first and higher excited states, and (iii) decreasing the detuning factor. Since δ is proportional to the square of these quantities, the magnitude of the TPA response can be very sensitive to small changes in electronic structure.
The Mge values of (DHAt)2BTD (8.00 D) and (DHAd)2BTD (8.53 D) are slightly smaller than those of the corresponding reference compounds (11.4 and 10.7 D, respectively, for 1,4-bis[(4′-N,N-bis(4″-methoxyphenyl)aminophenyl)ethyn-1′-yl]-2,3-dimethylbenzene (Reference A in Table 4)102 and 1,4-bis[(4′-N,N-dibutylaminophenyl)ethen-1′ -yl] benzene (Reference B in Table 4),24 in which the BTD moiety is replaced by phenyl. As the radiative rate constant (kr) is proportional to the square of Mge,103 these proquinoidal D-A-D and A-D-A molecules manifest diminished kr values with respect to these phenylene-based reference compounds (Table 6).102,104 Radiative rate constants were determined from the fluorescence quantum yields and fluorescence lifetimes using:
| (6) |
| (7) |
In these equations, Φf is the fluorescence quantum yield, kr and knr are radiative and nonradiative rate constants, respectively, and τf is the fluorescence lifetime. Radiative rate constants for these chromophores were also estimated from Strickler-Berg relation and their corresponding absorption and fluorescence spectra.103 The experimental and calculated radiative rate constants matched well for these BTD- and TDQ-based chromophores, and are smaller than those determined previously for their corresponding phenylene-based reference compounds (see Table 6 references). Note as well that the detuning factors of these proquinoidal chromophores are smaller than those determined previously for their respective corresponding reference compounds (Table 4), in which the BTD and TDQ units are replaced by simple aryl structures. Since smaller detuning factors increase TPA cross-sections, measured decreases of TPA cross-sections in these proquinoidal chromophores relative to their respective phenylene analogues would therefore be expected to derive from smaller Mee’ values for these species, consistent with the data in Table 4. Note that (DHAtBTDt)2ROPh and (DHAtROPht)2BTD, which have extended π-conjugated structures relative to (DHAt)2BTD, evince higher TPA cross-sections, suggesting that increased conjugation length is an important factor to enhance TPA, consistent with other reports.24,32,105
Table 6.
Fluorescence Lifetime Data for Proquinoidal D-A-D and A-D-A Chromophores Determined in Toluene Solvent.
| τf (ns)a | kr (× 107 s−1) | knr (× 107 s−1) | kr (calc) (× 107 s−1) |
|
|---|---|---|---|---|
| (DHAt)2BTD | 4.40 | 19.1 | 3.63 | 19.1 |
| (DHAd)2BTD | 4.71 | 8.92 | 12.3 | 17.6 |
| (ROPht)2TDQ | 6.63 | 6.33 | 8.75 | 9.68 |
| (ROPhd)2TDQ | 3.55 | 0.958 | 27.2 | 7.94 |
| (DHA-BTDt)2BTD | 0.78 | 11.3 | 117 | 23.3 |
| (BTDt)2ROPh | 3.13 | 21.1 | 10.8 | 23.5 |
| (DHAtPht)2ROPh | 0.73 | 122 | 15.0 | 109 |
| (DHAtBTDt)2ROPh | 3.10 | 25.8 | 6.46 | 40.0 |
| (DHAtROPht)2BTD | 2.80 | 20.0 | 15.7 | 33.0 |
| Reference A’b | 0.74 | 104 | 31.1 | |
| Reference B’c | 1.1 | 84.5 | 6.4 |
Theoretical Analysis
In order to provide further insight into the origins of the OPA and TPA properties of these proquinoidal D-A-D and A-D-A quadrupolar chromophores, the one- and two-photon absorption spectra for these species were computed. Each structure was simplified and optimized using HF/6–31G methods for structures with π-systems constrained to remain planar; time-dependent density-functional theory (TDDFT) with the collective electronic oscillator (CEO) framework86 was used to compute the one- and two-photon absorption spectra for these structures (see Experimental Section). Data obtained from these calculations are tabulated in Table 7.
Table 7.
Calculated OPA and TPA Band Maxima, and TPA Cross Sections (δ), of Proquinoidal D-A-D and A-D-A Chromophores, Along with Corresponding Experimental Data Obtained in Toluene Solvent.a
| OPA(calc) | TPA(calc) | δ(calc) | OPA(expt) | TPA(expt) | δ(expt) | |
|---|---|---|---|---|---|---|
| λ(nm) | λ(nm) | GM | λ(nm) | λ(nm) | GM | |
| (DHAt)2BTD | 599 | 969 | 504 | 501 | 850 | 230 |
| (DHAd)2BTD | 633 | 990 | 464 | 540 | 890 | 270 |
| (ROPht)2TDQ | 679 | 966 | 487 | 562 | b | b |
| (ROPhd)2TDQ | 772 | 1,033 | 598 | 626 | b | b |
| (DHA-BTDt)2BTD | 608 | 981 | 652 | 549 | 910 | 100 |
| (BTDt)2ROPh | 523 | 992 | 114 | 424 | 780 | 120 |
| (DHAtPht)2ROPh | 430 | 783 | 1,308 | 401 | 760 | 630 |
| (DHAtBTDt)2ROPh | 633 | 1,093 | 1,725 | 515 | 830 | 330 |
| (DHAtROPht)2BTD | 659 | 1,181 | 1,200 | 494 | 890 | 390 |
Computational values were determined for vacuum.
These parameters were not evaluated for TDQ derivatives due to possible mixing of OPA and TPA.
For OPA, these TDDFT calculations provided qualitative agreement with experimental excitation frequencies and transition intensities. Note that the calculated frequencies of the lowest energy excitations are red-shifted by ~100 – 200 nm (about 0.2– 0.6 eV) relative to that determined by experiment for all of the molecules studied. Such transition energy discrepancies between theory and experiment have been noted previously,86 and has been ascribed to several sources; these include: 1) solute-solvent interactions, not accounted for computationally, that lead to geometrical distortions and shortening of the effective conjugation length or localization of charge, and 2) the fact that the TDDFT approach overestimates the extent of exciton delocalization.106,107
For TPA spectra, the simulations revealed that compounds with increased conjugation length (e.g., (DHAtPht)2ROPh, (DHAtBTDt)2ROPh, and (DHAtROPht)2BTD) relative to (DHAt)2BTD exhibit stronger TPA, consistent with experiment. Note that these calculated cross-sections are about 2 – 5 times larger than the experimental values. Such overestimation of calculated TPA cross-sections relative to those determined experimentally is a common artifact of this computational approach and can be ascribed to several factors. Foremost, the conventional exchange-correlation functionals employed in these simulations often fail to effectively describe charge transfer.89,108,109 Further, the molecular structures were optimized using symmetry constraints described above; this simplification neglects the rotational degrees of freedom between the donor and acceptor units of these chromophores and access to other lower symmetry species in the ensemble). To test this hypothesis, we calculated TPA spectra for nonplanar (DHAt)2BTD structures. In this set of simulations, the dihedral angles between the phenylene and BTD ring systems were varied, and TPA spectra were calculated for multiple combinations of twist angles (data not shown). These studies found that the calculated TPA values were strongly influenced by the planarity of the structure, and that the absorption cross-section decreased dramatically with the increasing twist-angle magnitude; the calculated minimum TPA cross-section was found to be less than one fifth of the maximum cross-sectional value determined for the planar structure.
The agreement between calculation and experiment was closest for (DHAt)2BTD, (DHAd)2BTD, and (DHAtPht)2ROPh, which evinced a factor of two difference between the measured and computed TPA cross-sections, and computed red-shifts of the lowest absorption maxima within 100 nm of the respective experimental values). The discrepancy between measured and computed values of δ and the TPA band maximum was larger for the more conjugated ((DHAtPht)2ROPh, (DHAtBTDt)2ROPh, and (DHAtROPht)2BTD) chromophores; this result is consistent with the expectation that these species likely access a range of structures having varying degrees of conjugation in solution. The calculated δ values for (DHAtPht)2ROPh, (DHAtBTDt)2ROPh, and (DHAtROPht)2BTD) exceed those computed for (DHAt)2BTD, consistent both with experiment and the expectation that increasing conjugation length in these proquinoidal quadrupolar chromophores is an important contributor to enhance TPA cross-section.
Conclusion
π-Conjugated proquinoidal quadrupolar chromophores that feature either donor-acceptor-donor (D–A–D) or acceptor-donor-acceptor (A–D–A) electronic motifs and utilize benzo[c][1,2,5]thiadiazole (BTD) or 6,7-bis(3′,7′-dimethyloctyl)[1,2,5]thiadiazolo[3,4-g]quinoxaline (TDQ) electron acceptor units were designed and synthesized. The lowest energy absorption bands of these proquinoidal compounds are red-shifted ~100 nm relative to the transitions of corresponding reference chromophores that incorporate phenylene components in place of BTD and TDQ moieties. These chromophores exhibit large fluorescence spectral red-shifts and concomitant decreases of fluorescence quantum yield with increasing solvent polarity, indicating that these species possess relaxed singlet excited states having significant internal charge transfer (ICT) character. These proquinoidal species manifest blue-shifted two-photon absorption (TPA) spectra relative to their corresponding one-photon absorption (OPA) spectrum, and display high TPA cross-sections (>100 GM) within these spectral windows. D-A-D and A-D-A structures within this series that feature more extensive conjugation exhibit larger TPA cross-sections; theoretical analysis of these spectral properties are consistent with this trend. Two proquinoidal quadrupolar chromophores, (DHAtBTDt)2ROPh and (DHAtROPht)2BTD, showed TPA cross-sections over 150 GM in the spectral region between 750 and 960 nm. This optical excitation window is easily achieved with a mode-locked femtosecond titanium-sapphire laser, which is most frequently used for two-photon-excited fluorescence imaging. Proquinoidal D-A-D and A-D-A chromophores that feature BTD components manifest high fluorescence quantum yields (0.6 < Φf <0.9) in environments with low solvent polarity. This property makes these species attractive dopants in nanoscale matrices, such as polymersomes,110–112 as the combination of large TPA cross-section and substantial fluorescence emission provides added imaging utility; as the nonlinear properties of dipolar and quadrupolar compounds are governed by different parameters, such D-A-D and A-D-A chromophores compliment the orthogonal imaging utility of D-A structures, that include applications such as second harmonic generation imaging.113–115
Supplementary Material
Acknowledgments
The authors thank Professor Felix N. Castellano and Dr. Radiy Islangulov for their assistance with fluorescence lifetime measurements. DNB is grateful to Dr. Sergei Tretiak for providing the CEO program, and to Professor Artëm Masunov and Dr. Xiangqian Hu for helpful discussion. The authors thank the National Institutes of Health (R01CA115229; RO1GM48043) and the MRSEC Program of the National Science Foundation (DMR0520020) for supporting this work; J.A.N.F. is grateful to Bristol-Myers Squibb for a Basic Neurosciences Postdoctoral Fellowship. D.N.B. thanks the National Science Foundation (CHE-1012357) for support.
Footnotes
Supporting Information Available: Detailed synthetic procedures; tabulated absorption and fluorescence data. This material is available free of charge via the Internet at http://pubs.acs.org.
References
- 1.Parthenopoulos DA, Rentzepis PM. Science. 1989;245:843–845. doi: 10.1126/science.245.4920.843. [DOI] [PubMed] [Google Scholar]
- 2.Strickler JH, Webb WW. Adv. Mater. 1993;5:479–481. [Google Scholar]
- 3.Dvornikov AS, Walker EP, Rentzepis PM. J. Phys. Chem. A. 2009;113:13633–13644. doi: 10.1021/jp905655z. [DOI] [PubMed] [Google Scholar]
- 4.Zhou W, Kuebler SM, Braun KL, Yu T, Cammack JK, Ober CK, Perry JW, Marder SR. Science. 2002;296:1106–1109. doi: 10.1126/science.296.5570.1106. [DOI] [PubMed] [Google Scholar]
- 5.Pruzinsky SA, Braun PV. Adv. Funct. Mater. 2005;15:1995–2004. [Google Scholar]
- 6.Lee KS, Yang DY, Park SH, Kim RH. Polym. Adv. Technol. 2006;17:72–82. [Google Scholar]
- 7.Denk W, Strickler JH, Webb WW. Science. 1990;248:73–76. doi: 10.1126/science.2321027. [DOI] [PubMed] [Google Scholar]
- 8.Xu C, Zipfel W, Shear JB, Williams RM, Webb WW. Proc. Natl. Acad. Sci. USA. 1996;93:10763–10768. doi: 10.1073/pnas.93.20.10763. [DOI] [PMC free article] [PubMed] [Google Scholar]
- 9.Cahalan MD, Parker I, Wei SH, Miller MJ. Nat. Rev. Immun. 2002;2:872–880. doi: 10.1038/nri935. [DOI] [PMC free article] [PubMed] [Google Scholar]
- 10.Zipfel WR, Williams RM, Webb WW. Nat. Biotechnol. 2003;21:1368–1376. doi: 10.1038/nbt899. [DOI] [PubMed] [Google Scholar]
- 11.Krishna TR, Parent M, Werts MHV, Moreaux L, Gmouh S, Charpak S, Caminade AM, Majoral JP, Blanchard-Desce M. Angew. Chem. Int. Ed. 2006;45:4645–4648. doi: 10.1002/anie.200601246. [DOI] [PubMed] [Google Scholar]
- 12.Zheng QD, Xu GX, Prasad PN. Chem. Eur. J. 2008;14:5812–5819. doi: 10.1002/chem.200800309. [DOI] [PubMed] [Google Scholar]
- 13.Spangler CW. J. Mater. Chem. 1999;9:2013–2020. [Google Scholar]
- 14.Oliveira SL, Corrêa DS, Misoguti L, Constantino CJL, Aroca RF, Zilio SC, Mendonça CR. Adv. Mater. 2005;17:1890–1893. [Google Scholar]
- 15.Charlot M, Izard N, Mongin O, Riehl D, Blanchard-Desce M. Chem. Phys. Lett. 2006;417:297–302. [Google Scholar]
- 16.Zheng QD, Gupta SK, He GS, Tan LS, Prasad PAN. Adv. Funct. Mater. 2008;18:2770–2779. [Google Scholar]
- 17.Frederiksen PK, Jørgensen M, Ogilby PR. J. Am. Chem. Soc. 2001;123:1215–1221. doi: 10.1021/ja003468a. [DOI] [PubMed] [Google Scholar]
- 18.Liu J, Zhao YW, Zhao JQ, Xia AD, Jiang LJ, Wu S, Ma L, Dong YQ, Gu YH. J. Photochem. Photobiol. B: Biol. 2002;68:156–164. doi: 10.1016/s1011-1344(02)00379-2. [DOI] [PubMed] [Google Scholar]
- 19.McIlroy SP, Clo E, Nikolajsen L, Frederiksen PK, Nielsen CB, Mikkelsen KV, Gothelf KV, Ogilby PR. J. Org. Chem. 2005;70:1134–1146. doi: 10.1021/jo0482099. [DOI] [PubMed] [Google Scholar]
- 20.Oar MA, Serin JA, Dichtel WR, Frechet JMJ. Chem. Mater. 2005;17:2267–2275. [Google Scholar]
- 21.Beverina L, Crippa M, Landenna M, Ruffo R, Salice P, Silvestri F, Versari S, Villa A, Ciaffoni L, Collini E, Ferrante C, Bradamante S, Mari CM, Bozio R, Pagani GA. J. Am. Chem. Soc. 2008;130:1894–1902. doi: 10.1021/ja075933a. [DOI] [PubMed] [Google Scholar]
- 22.Albota M, Beljonne D, Brédas J-L, Ehrlich JE, Fu J-Y, Heikal AA, Hess SE, Kogej T, Levin MD, Marder SR, McCord-Maughon D, Perry JW, Röckel H, Rumi M, Subramaniam G, Webb WW, Wu X-L, Xu C. Science. 1998;281:1653–1656. doi: 10.1126/science.281.5383.1653. [DOI] [PubMed] [Google Scholar]
- 23.Ventelon L, Moreaux L, Mertz J, Blanchard-Desce M. Chem. Commun. 1999:2055–2056. [Google Scholar]
- 24.Rumi M, Ehrlich JE, Heikal AA, Perry JW, Barlow S, Hu Z, McCord-Maughon D, Parker TC, Röckel H, Thayumanavan S, Marder SR, Beljonne D, Brédas J-L. J. Am. Chem. Soc. 2000;122:9500–9510. [Google Scholar]
- 25.Ventelon L, Charier S, Moreaux L, Mertz J, Blanchard-Desce M. Angew. Chem. Int. Ed. 2001;40:2098–2101. [PubMed] [Google Scholar]
- 26.Pond SJK, Rumi M, Levin MD, Parker TC, Beljonne D, Day MW, Brédas J-L, Marder SR, Perry JW. J. Phys. Chem. A. 2002;106:11470–11480. [Google Scholar]
- 27.Iwase Y, Kamada K, Ohta K, Kondo K. J. Mater. Chem. 2003;13:1575–1581. [Google Scholar]
- 28.Strehmel B, Sarker AM, Detert H. ChemPhysChem. 2003;4:249–259. doi: 10.1002/cphc.200390041. [DOI] [PubMed] [Google Scholar]
- 29.Yang WJ, Kim CH, Jeong M-Y, Lee SK, Piao MJ, Jeon S-J, Cho BR. Chem. Mater. 2004;16:2783–2789. [Google Scholar]
- 30.Belfield KD, Morales AR, Kang B-S, Hales JM, Hagan DJ, Van Stryland EW, Chapela VM, Percino J. Chem. Mater. 2004;16:4634–4641. [Google Scholar]
- 31.Yang WJ, Kim DY, Jeong M-Y, Kim HM, Lee YK, Fang X, Jeon S-J, Cho BR. Chem. Eur. J. 2005;11:4191–4198. doi: 10.1002/chem.200401134. [DOI] [PubMed] [Google Scholar]
- 32.Chung S-J, Rumi M, Alain V, Barlow S, Perry JW, Marder SR. J. Am. Chem. Soc. 2005;127:10844–10845. doi: 10.1021/ja052926i. [DOI] [PubMed] [Google Scholar]
- 33.Terenziani F, Katan C, Badaeva E, Tretiak S, Blanchard-Desce M. Adv. Mater. 2008;20:4641–4678. [Google Scholar]
- 34.Kim HM, Cho BR. Chem. Commun. 2009:153–164. [Google Scholar]
- 35.Barzoukas M, Blanchard-Desce M. J. Chem. Phys. 2000;113:3951–3959. [Google Scholar]
- 36.Barzoukas M, Blanchard-Desce M. Proc. SPIE. 2001;4461:78–89. [Google Scholar]
- 37.Cho BR, Son KH, Lee SH, Song Y-S, Lee Y-K, Jeon S-J, Choi JH, Lee H, Cho M. J. Am. Chem. Soc. 2001;123:10039–10045. doi: 10.1021/ja010770q. [DOI] [PubMed] [Google Scholar]
- 38.Beljonne D, Wenseleers W, Zojer E, Shuai Z, Vogel H, Pond SJK, Perry JW, Marder SR, Brédas J-L. Adv. Funct. Mater. 2002;12:631–641. [Google Scholar]
- 39.Le Droumaguet C, Mongin O, Werts MHV, Blanchard-Desce M. Chem. Commun. 2005:2802–2804. doi: 10.1039/b502585k. [DOI] [PubMed] [Google Scholar]
- 40.Bhaskar A, Ramakrishna G, Lu ZK, Twieg R, Hales JM, Hagan DJ, Van Stryland E, Goodson T. J. Am. Chem. Soc. 2006;128:11840–11849. doi: 10.1021/ja060630m. [DOI] [PubMed] [Google Scholar]
- 41.Terenziani F, Le Droumaguet C, Katan C, Mongin O, Blanchard-Desce M. ChemPhysChem. 2007;8:723–734. doi: 10.1002/cphc.200600689. [DOI] [PubMed] [Google Scholar]
- 42.Collings JC, Poon SY, Le Droumaguet C, Charlot M, Katan C, Palsson LO, Beeby A, Mosely JA, Kaiser HM, Kaufmann D, Wong WY, Blanchard-Desce M, Marder TB. Chem. Eur. J. 2009;15:198–208. doi: 10.1002/chem.200801719. [DOI] [PubMed] [Google Scholar]
- 43.Chung S-J, Kim K-S, Lin T-C, He GS, Swiatkiewicz J, Prasad PN. J. Phys. Chem. B. 1999;103:10741–10745. [Google Scholar]
- 44.Katan C, Terenziani F, Mongin O, Werts MHV, Porrés L, Pons T, Mertz J, Tretiak S, Blanchard-Desce M. J. Phys. Chem. A. 2005;109:3024–3037. doi: 10.1021/jp044193e. [DOI] [PubMed] [Google Scholar]
- 45.Drobizhev M, Karotki A, Rebane A, Spangler CW. Opt. Lett. 2001;26:1081–1083. doi: 10.1364/ol.26.001081. [DOI] [PubMed] [Google Scholar]
- 46.Wei P, Bi XD, Wu Z, Xu Z. Org. Lett. 2005;7:3199–3202. doi: 10.1021/ol050905n. [DOI] [PubMed] [Google Scholar]
- 47.Varnavski O, Yan XZ, Mongin O, Blanchard-Desce M, Goodson T. J. Phys. Chem. C. 2007;111:149–162. [Google Scholar]
- 48.Ramakrishna G, Bhaskar A, Bauerle P, Goodson T. J. Phys. Chem. A. 2008;112:2018–2026. doi: 10.1021/jp076048h. [DOI] [PubMed] [Google Scholar]
- 49.Kitamura C, Tanaka S, Yamashita Y. Chem. Mater. 1996;8:570–578. [Google Scholar]
- 50.van Mullekom HAM, Vekemans JAJM, Meijer EW. Chem. Eur. J. 1998;4:1235–1243. [Google Scholar]
- 51.Raimundo J-M, Blanchard P, Brisset H, Akoudad S, Roncali J. Chem. Commun. 2000:939–940. [Google Scholar]
- 52.Morikita T, Yamaguchi I, Yamamoto T. Adv. Mater. 2001;13:1862–1864. [Google Scholar]
- 53.Bangcuyo CG, Evans U, Myrick ML, Bunz UHF. Macromolecules. 2001;34:7592–7594. [Google Scholar]
- 54.Justin Thomas KR, Lin JT, Velusamy M, Tao Y-T, Chuen C-H. Adv. Funct. Mater. 2004;14:83–90. [Google Scholar]
- 55.Chen M, Perzon E, Andersson MR, Marcinkevicius S, Jönsson SKM, Fahlman M, Berggren M. Appl. Phys. Lett. 2004;84:3570–3572. [Google Scholar]
- 56.Susumu K, Duncan TV, Therien MJ. J. Am. Chem. Soc. 2005;127:5186–5195. doi: 10.1021/ja040243h. [DOI] [PubMed] [Google Scholar]
- 57.Pai CL, Liu CL, Chen WC, Jenekhe SA. Polymer. 2006;47:699–708. [Google Scholar]
- 58.Bundgaard E, Krebs FC. Macromolecules. 2006;39:2823–2831. [Google Scholar]
- 59.Chen MX, Perzon E, Robisson N, Joensson SKM, Andersson MR, Fahlman M, Berggren M. Synth. Met. 2004;146:233–236. [Google Scholar]
- 60.Yang RQ, Tian RY, Yan JG, Zhang Y, Yang J, Hou Q, Yang W, Zhang C, Cao Y. Macromolecules. 2005;38:244–253. [Google Scholar]
- 61.Chuang CY, Shih PI, Chien CH, Wu FI, Shu CF. Macromolecules. 2007;40:247–252. [Google Scholar]
- 62.Liu J, Guo X, Bu LJ, Xie ZY, Cheng YX, Geng YH, Wang LX, Jing XB, Wang FS. Adv. Funct. Mater. 2007;17:1917–1925. [Google Scholar]
- 63.Qian G, Zhong Z, Luo M, Yu D, Zhang Z, Ma D, Wang ZY. J. Phys. Chem. C. 2009;113:1589–1595. [Google Scholar]
- 64.Velusamy M, Justin Thomas KR, Lin JT, Hsu Y-C, Ho K-C. Org. Lett. 2005;7:1899–1902. doi: 10.1021/ol050417f. [DOI] [PubMed] [Google Scholar]
- 65.Perzon E, Wang X, Zhang F, Mammo W, Delgado JL, de la Cruz P, Inganäs O, Langa F, Andersson MR. Synth. Met. 2005;154:53–56. [Google Scholar]
- 66.Wang X, Perzon E, Mammo W, Oswald F, Admassie S, Persson N-K, Langa F, Andersson MR, Inganäs O. Thin Solid Films. 2006;511–512:576–580. [Google Scholar]
- 67.Zhu Z, Waller D, Gaudiana R, Morana M, Muhlbacher D, Scharber M, Brabec C. Macromolecules. 2007;40:1981–1986. [Google Scholar]
- 68.Shin WS, Kim SC, Lee SJ, Jeon HS, Kim MK, Naidu BVK, Jin SH, Lee JK, Lee JW, Gal YS. J. Polym. Sci., Part A: Polym. Chem. 2007;45:1394–1402. [Google Scholar]
- 69.McNeill CR, Abrusci A, Zaumseil J, Wilson R, McKiernan MJ, Burroughes JH, Halls JJM, Greenham NC, Friend RH. Appl. Phys. Lett. 2007;90:193506. [Google Scholar]
- 70.Bundgaard E, Krebs FC. Sol. Energy Mater. Sol. Cells. 2007;91:1019–1025. [Google Scholar]
- 71.Sun ML, Wang L, Zhu XH, Du B, Liu R, Yang W, Cao Y. Sol. Energy Mater. Sol. Cells. 2007;91:1681–1687. [Google Scholar]
- 72.Hou JH, Chen HY, Zhang SQ, Li G, Yang Y. J. Am. Chem. Soc. 2008;130:16144–16145. doi: 10.1021/ja806687u. [DOI] [PubMed] [Google Scholar]
- 73.Zoombelt AP, Fonrodona M, Wienk MM, Sieval AB, Hummelen JC, Janssen RAJ. Org. Lett. 2009;11:903–906. doi: 10.1021/ol802839z. [DOI] [PubMed] [Google Scholar]
- 74.Zaumseil J, Donley CL, Kim J-S, Friend RH, Sirringhaus H. Adv. Mater. 2006;18:2708–2712. [Google Scholar]
- 75.Chen M, Crispin X, Perzon E, Andersson MR, Pullerits T, Andersson M, Inganäs O, Berggren M. Appl. Phys. Lett. 2005;87:252105. [Google Scholar]
- 76.Zhang M, Tsao HN, Pisula W, Yang CD, Mishra AK, Mullen K. J. Am. Chem. Soc. 2007;129:3472–3473. doi: 10.1021/ja0683537. [DOI] [PubMed] [Google Scholar]
- 77.Pilgram K, Zupan M, Skiles R. J. Heterocycl. Chem. 1970;7:629–633. [Google Scholar]
- 78.Tsubata Y, Suzuki T, Yamashita Y, Mukai T, Miyashi T. Heterocycles. 1992;33:337–348. [Google Scholar]
- 79.Therien MJ, Susumu K. PCT Int. Appl. 2007 p WO 2007/081991 A2. [Google Scholar]
- 80.Demas JN, Crosby GA. J. Phys. Chem. 1971;75:991–1024. [Google Scholar]
- 81.Karstens T, Kobs K. J. Phys. Chem. 1980;84:1871–1872. [Google Scholar]
- 82.Tyson DS, Luman CR, Zhou X, Castellano FN. Inorg. Chem. 2001;40:4063–4071. doi: 10.1021/ic010287g. [DOI] [PubMed] [Google Scholar]
- 83.Luman CRL, Castellano FN. Photochem. Photobiol. 2003;77:510–514. doi: 10.1562/0031-8655(2003)077<0510:loflis>2.0.co;2. [DOI] [PubMed] [Google Scholar]
- 84.Fisher JAN, Salzberg BM, Yodh AG. J. Neuorosci. Meth. 2005;148:94–102. doi: 10.1016/j.jneumeth.2005.06.027. [DOI] [PubMed] [Google Scholar]
- 85.Fisher JAN, Susumu K, Therien MJ, Yodh AG. J. Chem. Phys. 2009;130:134506. doi: 10.1063/1.3089795. [DOI] [PMC free article] [PubMed] [Google Scholar]
- 86.Masunov A, Tretiak S. J. Phys. Chem. B. 2004;108:899–907. [Google Scholar]
- 87.Tretiak S, Chernyak V. J. Chem. Phys. 2003;119:8809–8823. [Google Scholar]
- 88.Day PN, Nguyen KA, Pachter R. J. Phys. Chem. B. 2005;109:1803–1814. doi: 10.1021/jp047511i. [DOI] [PubMed] [Google Scholar]
- 89.Bartholomew GP, Rumi M, Pond SJK, Perry JW, Tretiak S, Bazan GC. J. Am. Chem. Soc. 2004;126:11529–11542. doi: 10.1021/ja038743i. [DOI] [PubMed] [Google Scholar]
- 90.Fabian J, Diaz LA, Seifert G, Niehaus T. THEOCHEM. 2002;594:41–53. [Google Scholar]
- 91.Andreu R, Garín J, Orduna J. Tetrahedron. 2001;37:7883–7892. [Google Scholar]
- 92.Frisch MJ, Trucks GW, Schlegel HB, Scuseria GE, Robb MA, Cheeseman JR, Zakrzewski VG, Montgomery JA, Stratmann RE, Burant JC, Dapprich S, Millam JM, Daniels AD, Kudin KN, Strain MC, Farkas O, Tomasi J, Barone V, Cossi M, Cammi R, Mennucci B, Pomelli C, Adamo C, Clifford S, Ochterski J, Petersson GA, Ayala PY, Cui Q, Morokuma K, Malick DK, Rabuck AD, Raghavachari K, Foresman JB, Cioslowski J, Ortiz JV, Stefanov BB, Liu G, Liashenko A, Piskorz P, Komaromi I, Gomperts R, Martin RL, Fox DJ, Keith T, Al-Laham MA, Peng CY, Nanayakkara A, Gonzalez C, Challacombe M, Gill PMW, Johnson BG, Chen W, Wong MW, Andres JL, Head-Gordon M, Replogle ES, Pople JA. Revision A.9 ed. Pittsburgh, PA: Gaussian, Inc; 1998. [Google Scholar]
- 93.Tretiak S, Mukamel S. Chem. Rev. 2002;102:3171–3212. doi: 10.1021/cr0101252. [DOI] [PubMed] [Google Scholar]
- 94.van Mullekom HAM, Vekemans JAJM, Havinga EE, Meijer EW. Mater. Sci. Eng. 2001;32:1–40. [Google Scholar]
- 95.Nguyen P, Yuan Z, Agocs L, Lesley G, Marder TB. Inorg. Chim. Acta. 1994;220:289–296. [Google Scholar]
- 96.Ndayikengurukiye H, Jacobs S, Tachelet W, Van Der Looy J, Pollaris A, Geise HJ, Claeys M, Kauffmann JM, Janietz S. Tetrahedron. 1997;53:13811–13828. [Google Scholar]
- 97.Woo HY, Liu B, Kohler B, Korystov D, Mikhailovsky A, Bazan GC. J. Am. Chem. Soc. 2005;127:14721–14729. doi: 10.1021/ja052906g. [DOI] [PubMed] [Google Scholar]
- 98.Xu C, Webb WW. J. Opt. Soc. Am. B. 1996;13:481–491. [Google Scholar]
- 99.Albota MA, Xu C, Webb WW. Appl. Opt. 1998;37:7352–7356. doi: 10.1364/ao.37.007352. [DOI] [PubMed] [Google Scholar]
- 100.Kato S-i, Matsumoto T, Ishi-i T, Thiemann T, Shigeiwa M, Gorohmaru H, Maeda S, Yamashita Y, Mataka S. Chem. Commun. 2004:2342–2343. doi: 10.1039/b410016f. [DOI] [PubMed] [Google Scholar]
- 101.Kato S-i, Matsumoto T, Shigeiwa M, Gorohmaru H, Maeda S, Ishi-i T, Mataka S. Chem. Eur. J. 2006;12:2303–2317. doi: 10.1002/chem.200500921. [DOI] [PubMed] [Google Scholar]
- 102.Strehmel B, Amthor S, Schelter J, Lambert C. ChemPhysChem. 2005;6:893–896. doi: 10.1002/cphc.200400538. [DOI] [PubMed] [Google Scholar]
- 103.Strickler SJ, Berg RA. J. Chem. Phys. 1962;37:814–822. [Google Scholar]
- 104.Hong JW, Woo HY, Liu B, Bazan GC. J. Am. Chem. Soc. 2005;127:7435–7443. doi: 10.1021/ja044326+. [DOI] [PubMed] [Google Scholar]
- 105.Najechalski P, Morel Y, Stéphan O, Baldeck PL. Chem. Phys. Lett. 2001;343:44–48. [Google Scholar]
- 106.Grimme S, Parac M. ChemPhysChem. 2003;4:292–295. doi: 10.1002/cphc.200390047. [DOI] [PubMed] [Google Scholar]
- 107.Cai Z-L, Sendt K, Reimers JR. J. Chem. Phys. 2002;117:5543–5549. [Google Scholar]
- 108.Tozer DJ, Amos RD, Handy NC, Roos BO, Serrano-Andres L. Mol. Phys. 1999;97:859–868. [Google Scholar]
- 109.Neiss C, Saalfrank P, Parac M, Grimme S. J. Phys. Chem. A. 2003;107:140–147. [Google Scholar]
- 110.Ghoroghchian PP, Frail PR, Susumu K, Blessington D, Brannan AK, Bates FS, Chance B, Hammer DA, Therien MJ. Proc. Natl. Acad. Sci. USA. 2005;102:2922–2927. doi: 10.1073/pnas.0409394102. [DOI] [PMC free article] [PubMed] [Google Scholar]
- 111.Ghoroghchian PP, Frail PR, Susumu K, Park T-H, Wu SP, Uyeda HT, Hammer DA, Therien MJ. J. Am. Chem. Soc. 2005;127:15388–15390. doi: 10.1021/ja055571b. [DOI] [PubMed] [Google Scholar]
- 112.Ghoroghchian PP, Frail PR, Li G, Zupancich JA, Bates FS, Hammer DA, Therien MJ. Chem. Mater. 2007;19:1309–1318. doi: 10.1021/cm062427w. [DOI] [PMC free article] [PubMed] [Google Scholar]
- 113.Moreaux L, Sandre O, Blanchard-Desce M, Mertz J. Opt. Lett. 2000;25:320–322. doi: 10.1364/ol.25.000320. [DOI] [PubMed] [Google Scholar]
- 114.Reeve JE, Collins HA, De Mey K, Kohl MM, Thorley KJ, Paulsen O, Clays K, Anderson HL. J. Am. Chem. Soc. 2009;131:2758–2759. doi: 10.1021/ja8061369. [DOI] [PubMed] [Google Scholar]
- 115.Therien MJ. Nature. 2009;458:716–717. doi: 10.1038/458716b. [DOI] [PMC free article] [PubMed] [Google Scholar]
- 116.Beverina L, Fu J, Leclercq A, Zojer E, Pacher P, Barlow S, Van Stryland EW, Hagan DJ, Brédas J-L, Marder SR. J. Am. Chem. Soc. 2005;127:7282–7283. doi: 10.1021/ja050688l. [DOI] [PubMed] [Google Scholar]
Associated Data
This section collects any data citations, data availability statements, or supplementary materials included in this article.