A modified Laue technique suitable for time-resolved diffraction is described in which profile-independent integration is used, the RATIO method is applied and multi-crystal data are normalized to a common scale. The method is applied in single-pulse pump–probe studies of a binuclear Rh complex, showing Rh—Rh bond shortening of 0.136 (8) Å on excitation.
Keywords: Laue techniques, single-pulse diffraction, quantum-mechanical/molecular-mechanics calculations, QM/MM calculations, time-resolved X-ray crystallography
Abstract
A modified Laue method is shown to produce excited-state structures at atomic resolution of a quality competitive with those from monochromatic experiments. The much faster data collection allows the use of only one or a few X-ray pulses per data frame, which minimizes crystal damage caused by laser exposure of the samples and optimizes the attainable time resolution. The method has been applied to crystals of the α-modification of Rh2(μ-PNP)2(PNP)2 (BPh4)2 [PNP = CH3N(P(OCH3)2)2, Ph = phenyl]. The experimental results show a shortening of the Rh—Rh distance in the organometallic complex of 0.136 (8) Å on excitation and are quantitatively supported by quantum-mechanical (QM)/molecular-mechanics (MM) theoretical calculations which take into account the confining effect of the crystal environment, but not by theoretical results on the isolated complex, demonstrating the defining effect of the crystal matrix.
1. Introduction
Time-resolved (TR) X-ray crystallography at advanced light sources is a frontier area bound to undergo dramatic new developments with the advent of ultrabright X-ray free-electron lasers (XFELs). Earlier TR studies of chemical systems in which atomic resolution was reached have used monochromatic radiation for which methods are well developed and a reasonable accuracy can be achieved (Coppens, Benedict et al., 2010 ▶; Cailleau et al., 2010 ▶). The use of monochromatic data avoids the wavelength dependence of both the scattering process and the detector response and does not suffer from the broadening of the reflection maxima inherent in the Laue technique. However, with a narrow bandwidth of monochromatic radiation only a very small fraction of the photons in the synchrotron beam are productively used, even at undulator-equipped beamlines. Thus a longer exposure time and therefore more pulses are required, which limits the time resolution that can be achieved. Furthermore, the longer exposure time implies more extensive laser exposure, thereby enhancing the temperature increase of the sample due to light absorption.
It follows that for picosecond-timescale TR diffraction at synchrotron sources the use of polychromatic radiation is imperative. To achieve this goal we have developed a number of methods to improve the accuracy and interpretation of Laue measurements. They include the RATIO technique in which the measured I ON/I OFF ratios are used in combination with a set of monochromatic data collected at the same temperature (Coppens et al., 2009 ▶), photo-Wilson plots to estimate the temperature increase due to the laser exposure of the sample (Schmøkel et al., 2010 ▶), the definition of R factors specific for dynamic structure crystallography (Coppens, Kamiński & Schmøkel, 2010 ▶), and a scaling technique for relative scaling within multi-crystal data sets collected on the same substance. The scaling is required for calculation of the photodifference maps using all available reflections. The technique is based on the moduli of the absolute fractional intensity change and is described in §2.3. We describe a single-pulse Laue diffraction experiment of a binuclear RhI complex in which the techniques summarized above have been applied and a comparison of the results with theoretical calculations. A preliminary account of the results of this study has been published (Benedict et al., 2011 ▶).
2. The experiment
2.1. Crystal structure and photochemical properties
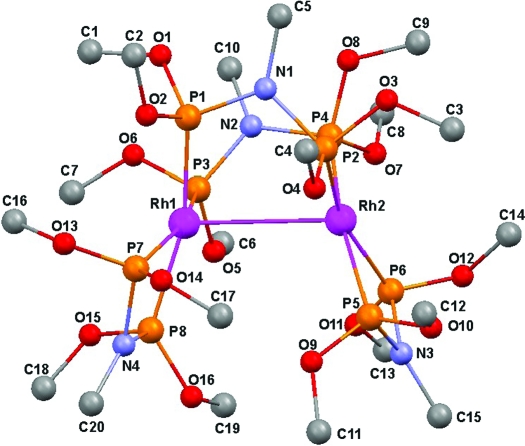
The crystal structures of the three polymorphs of Rh2(μ-PNP)2(PNP)2(BPh4)2, (1), where PNP = CH3N(P(OCH3)2)2 and Ph = phenyl (Fig. 1 ▶), and related salts were reported by Mague and coworkers (Blakley et al., 1989 ▶; Mague, 1995 ▶). On excitation of the α form with 337 nm light at 10 K a strong emission band was observed at 730 nm, but at ∼ 50 K a second band develops at 780 nm, while the band at 730 nm weakens and disappears at 80 K. The change is attributed to a thermal transition to a second triplet state of somewhat lower energy, separated from the higher state by an activation barrier (Blakley et al., 1989 ▶). The large Stokes shift observed indicates a significant structural rearrangement on excitation. Owing to a broadening of the spot shape in the Laue patterns on cooling attributed to strain induced in the specimen crystals, the current experiment was performed at 225 K by cooling in a nitrogen stream. Unit-cell information from the monochromatic experiment and luminescence properties are summarized in Table 1 ▶. Full crystallographic information on the ground-state structure is given in the supplementary material.1 The 225 K temperature of the experiment reported here implies that the excited state with the 780 nm emission was studied. The resulting shortening of the emission lifetime from the value of 46.5 (3) µs reported at 10 K (Blakley et al., 1989 ▶) does not affect the current experiment as the delay between the 35 ps pump and 100 ps probe pulses was only 100 ps.
Figure 1.
Molecular diagram of (1) and labeling of atoms.
Table 1. Cell dimensions and emission properties.
| Compound | Space group | Cell dimensions (Å) 225 K, Z = 4 | Excitation wavelength (nm) | Lifetime (µs) (Blakley et al., 1989 ▶) | Emission wavelength† (nm) (Blakley et al., 1989 ▶) |
|---|---|---|---|---|---|
| [Rh2PNP4][BPh4]2 | P21/n | a = 13.9783 (3) | 337 | 35.3 (10 K) | 718 (10 K) |
| α modification | b = 20.2046 (5) | 46.5 (10 K) | 790 (10 K) | ||
| c = 28.1465 (7) | |||||
| β = 90.8420 (10) |
Wavelength at which the emission was monitored.
2.2. Data collection
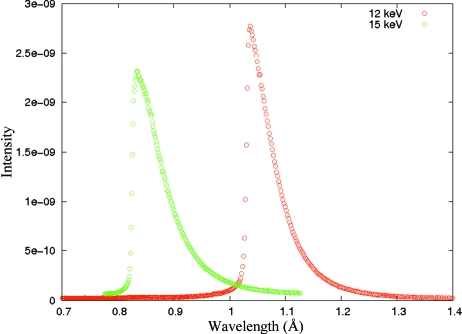
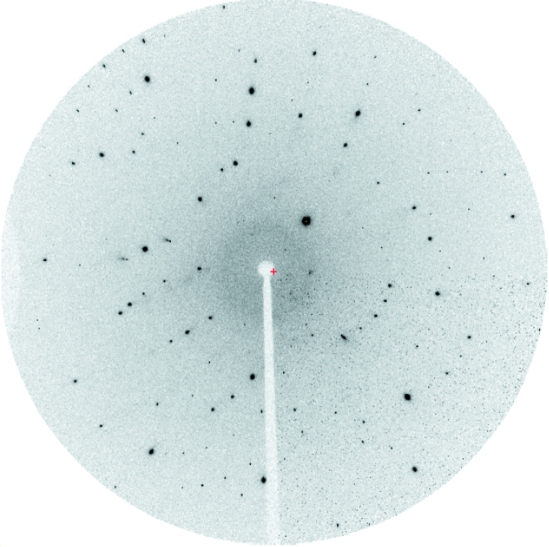
Time-resolved intensity data were collected at the 14-ID BioCARS station at the Advanced Photon Source. Two different undulator settings were used with peak energies at 12 and 15 keV, respectively. The corresponding spectral distributions are illustrated in Fig. 2 ▶. Use of the polychromatic beam (ΔE/E = ∼ 8%) allows collection of a frame of data with a single 100 ps synchrotron pulse (Fig. 3 ▶). The samples were pumped with 35 ps pulses of a Ti:sapphire laser tuned to a wavelength of 390 nm. The laser power varied between 0.45 and 0.6 mJ mm−2. It is noteworthy that laser powers beyond 0.6 mJ mm−2 led to a decrease in the ON/OFF intensity changes, an effect attributed to secondary excitation of the photo-induced excited state possibly creating on a non-radiative relaxation pathway. To maximize the number of weak reflections observed, the pump–probe cycle for each frame was repeated three times before detector read-out. The pump–probe delay time was set at 100 ps. Much longer delay times caused spot extension in the ON frames, as observed in earlier experiments (Coppens, Benedict et al., 2010 ▶). Laser-OFF and Laser-ON frames were collected in immediate succession to minimize the effect of long-range fluctuations in the beam parameters. The OFF/ON pump–probe cycle was repeated ten times for each frame to allow subsequent statistical filtering of the data. This redundancy is made possible by the extremely fast data collection, limited essentially by the ∼ 4 s read-out time used with the MAR detector. Six sufficiently large data sets covering at least half of the reciprocal space within the resolution limit, totaling three each at 12 and 15 keV, were collected each at successive values of the ϕ angle of the diffractometer with Δϕ = 5° and were used in the subsequent analysis. Other runs had to be aborted because of premature laser damage of the samples as evident from pronounced weakening of the diffraction pattern and smearing of the diffraction spots. Details of the six data sets are summarized in Table 2 ▶ and Table S1 of the supplementary material.
Figure 2.
Experimental spectral distribution at BIOCARS beamline 14-ID prior to the experiments.
Figure 3.
Single-pulse Laue image collected at the APS ID-14, BIOCARS beamline.
Table 2. Description of the data sets.
The last three columns are defined in equations (1)–(4)
| Data set | No. of reflections after merging | Undulator setting (keV) | Sample size (µm) | Laser power (mJ mm−2) | 〈|η|〉 | k(η) | kB from Wilson plots |
|---|---|---|---|---|---|---|---|
| 19 | 1196 | 12 | ∼ 30 × 20 × 20 | 0.60 | 0.056 | 1.061 | 1.112 |
| 20 | 588 | 12 | 30 × 20 × 10 | 0.60 | 0.089 | 0.667 | 1.258 |
| 24 | 540 | 12 | 30 × 40 × 10 | 0.55 | 0.096 | 0.619 | 1.310 |
| 27 | 760 | 15 | 42 × 22 × 8 | 0.45 | 0.060 | 0.990 | 1.081 |
| 28 | 1281 | 15 | 43 × 27 × 12 | 0.45 | 0.048 | 1.238 | 1.068 |
| 29 | 1150 | 15 | 37 × 32 × 12 | 0.45 | 0.043 | 1.381 | 1.065 |
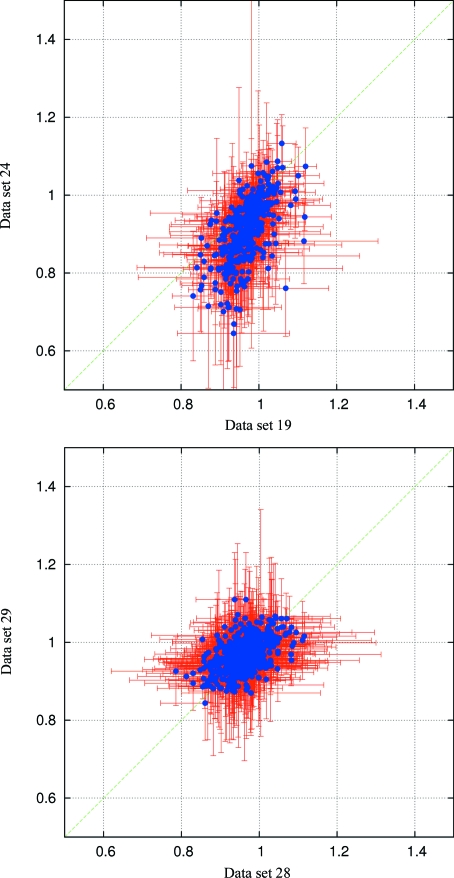
The mutual consistence of the data sets was examined by the construction of correlation plots (Coppens et al., 2005 ▶), two of which are shown in Fig. 4 ▶.
Figure 4.
Examples of plots showing the correlation between ON/OFF ratios of individual hkls in different data sets. Red lines correspond to ±1σ(R). The green line represents a trend line for an ideal correlation ( ). The data in the upper figure do not follow this trend, indicating a stronger overall response of data set 24.
2.3. Data processing
The reflections were indexed using the program PRECOGNITION (Ren, 2010 ▶), as well as using a new program LAUEUTIL currently being developed in our laboratory (to be published). Spot integration was performed by the program LAUEGUI (Messerschmidt & Tschentscher, 2008 ▶; Peters, 2003 ▶). The program is based on the seed–skewness method (Bolotovsky & Coppens, 1997 ▶), which does not require profile fitting. Only reflections with I > 10σ(I), where σ(I) is the statistical standard deviation of the measured intensity I, were considered in the calculation of the ON/OFF ratios R and related response ratios η, respectively defined as
and
Several filtering steps were applied. For each hkl on a frame the ten repeated ratio measurements were rejected whenever the standard deviation for the sample was larger than 0.5. Reflections with less than ten repeated measurements were also rejected. The resulting ratios were averaged over repeated and symmetry-equivalent measurements with the program SORTAV (Blessing, 1997 ▶). Outliers were down-weighted by the use of the robust/resistant Tukey biweighting criterion based on the deviation of individual measurements from the median (Blessing, 1997 ▶). Details are given in Table S2. The ten individual intensities of two reflections with I ON > I OFF are shown in Fig. S1.
2.4. Preliminary scaling of the data sets collected on different crystals
To obtain a photodifference map for visualization of the light-induced changes and for extraction of initial atomic positions for the excited-state least-squares refinement, it is necessary to combine the data sets, as reliable Fourier maps essentially require a complete set of terms in the Fourier summation. In the RATIO method the ON data are obtained by multiplication of the monochromatic intensities by the synchrotron-determined ratios R,
For multi-sample data sets with different fractional excitation the ratios must be reduced to a common scale before the Fourier summation is performed. To accomplish this the η values of individual reflections are scaled in SORTAV (Blessing, 1997 ▶) by 〈|η|〉set/〈|η|〉all, in which 〈|η|〉all and 〈|η|〉set are the averages over all measured reflections and over the reflections in the specific set respectively. Corrected values of R are obtained from
 |
The scaled and merged ratios are then used in equation (2) to generate uniform I ON values for the calculation of photodifference maps.
2.5. Analysis of the sample temperature during the ON measurements
An estimate of the temperature increase caused by the laser pulse can be obtained from a photo-Wilson plot (Schmøkel et al., 2010 ▶; Vorontsov & Coppens, 2005 ▶). The plot gives an estimate of ΔB, which with the value of 〈B〉 from the monochromatic data measured at the same temperature can be converted to a temperature scale factor representing the relative temperature increase with the equation
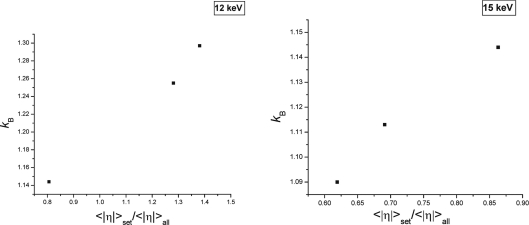
As may be expected, the values of kB for each set are correlated with 〈|η|〉set as shown in Fig. 5 ▶. However, they become almost equal after the scaling according to equations (3c) and (2) is implemented.
Figure 5.
Relation between the temperature scale factor k B and 1/k(η), the inverse of the response ratio scale factor for the 12 and the 15 keV data sets.
The value of k B for the set of combined data equals 1.07.
2.6. Least-squares refinement
The data were refined with the program LASER, which is based on the refinement of the response ratios (Vorontsov et al., 2010 ▶). The program assumes a random spatial distribution of the excited-state species with a scattering formalism
and
in which F
ON and F
OFF are the structure factors for the light-ON and light-OFF measurements, GS and ES are the ground and excited state, respectively, and P is the percentage conversion to the light-induced state. An alternative algorithm assuming clustering of the light-induced species leads to quite different calculated values of the ON structure factors and has not been successful in any of our previous studies (Vorontsov & Coppens, 2005 ▶). Differences between  and
and  , which would imply a motion or deformation of the GS molecules in the light-exposed crystal are expected to be minimal in this work because of the low conversion percentages achieved (Table S3). The LASER program allows for the refinement of up to six different data sets with individual values of the conversion percentage P and the temperature scale factor kB and calculates R factors specifically designed for photocrystallographic experiments (Vorontsov et al., 2010 ▶; Coppens, Kamiński & Schmøkel, 2010 ▶).
Refinement was performed on the six data sets listed in Table 2 ▶. Only data with |η|/σ(η) > 1 were used in the refinement giving a total of 2256 independent reflections for the refinement of 42 excited-state structure parameters. They included the six positional parameters of the two Rh atoms, temperature scale factors kB, and the excited-state occupancies for each of six experimental runs plus three rotational and translational parameters of the four rigid PNP groups. The ground-state Rh positions were taken as starting points in the excited-state refinement of the Rh atoms. The ligands pivoted around anchor atoms, the positions of which were allowed to translate. For the two terminal ligands the initial positions of the anchor atoms were the locations of the excited-state Rh atoms to which the ligands were attached, obtained in a preliminary refinement of the Rh positions only. For the bridging ligands the midpoint of the Rh atoms was used as the starting position in the subsequent refinement. Structural results are presented in Tables 3 ▶ and 4 ▶ and S2–S4. Final agreement factors, defined elsewhere (Coppens, Kamiński & Schmøkel, 2010 ▶), are R(η) = 0.342 and R(R) = 0.034. Further numerical details on the refinement are given in Tables S5–S7.
Table 3. Shifts of the Rh and P atoms on excitation and standard deviations (Å).
| Atom | Shift | σ |
|---|---|---|
| Rh1 | 0.139 | 0.007 |
| Rh2 | 0.134 | 0.005 |
| P1 | 0.068 | 0.031 |
| P2 | 0.099 | 0.035 |
| P3 | 0.159 | 0.030 |
| P4 | 0.112 | 0.029 |
| P5 | 0.108 | 0.027 |
| P6 | 0.067 | 0.027 |
| P7 | 0.115 | 0.031 |
| P8 | 0.105 | 0.026 |
Table 4. Experimental excited-state (ES) and ground-state (GS) bond lengths and their differences (Å).
| ES geometry | GS geometry | Nature | |||||
|---|---|---|---|---|---|---|---|
| Atom 1 | Atom 2 | Distance | σ | Distance | σ | Difference | of ligand |
| Rh1 | Rh2 | 3.045 | 0.008 | 3.1805 | 0.0002 | −0.136 | |
| Rh1 | P1 | 2.269 | 0.033 | 2.2512 | 0.0006 | 0.018 | Bridging |
| Rh2 | P2 | 2.236 | 0.028 | 2.2631 | 0.0006 | −0.027 | |
| Rh1 | P3 | 2.256 | 0.029 | 2.2736 | 0.0006 | −0.018 | Bridging |
| Rh2 | P4 | 2.249 | 0.030 | 2.2552 | 0.0006 | −0.006 | |
| Rh2 | P5 | 2.314 | 0.028 | 2.2796 | 0.0006 | 0.035 | Terminal |
| Rh2 | P6 | 2.280 | 0.030 | 2.2606 | 0.0006 | 0.020 | |
| Rh1 | P7 | 2.322 | 0.022 | 2.2769 | 0.0006 | 0.045 | Terminal |
| Rh1 | P8 | 2.217 | 0.022 | 2.2746 | 0.0006 | −0.058 | |
3. Discussion of results
3.1. Photodifference maps
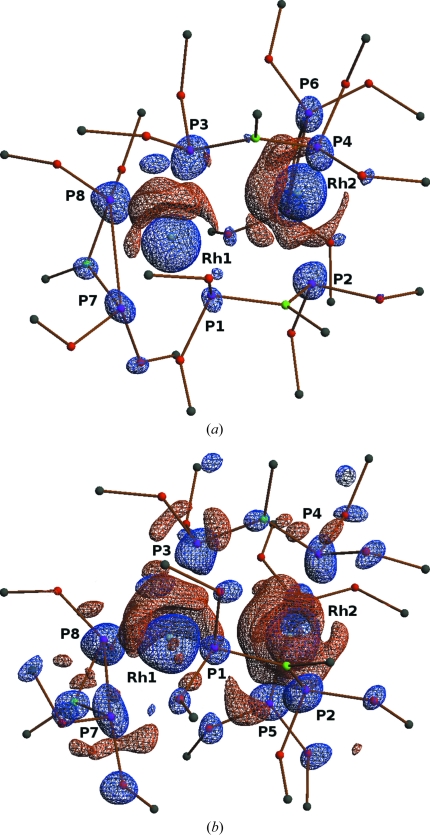
The photodifference map based on all independent reflections, calculated at isosurfaces of ± 0.25 e Å−3, is shown in Fig. 6 ▶(a). The map indicates a sideward displacement of Rh1 and a displacement of Rh2 towards Rh1, thus suggesting both a rotation and a shortening of the Rh—Rh vector. In addition it shows a depletion of the electron density in the regions of P atoms. The compensating positive electron density at these atoms becomes visible when contours are drawn at the lower 0.175 e Å−3. One of these maps is shown in Fig. 6 ▶(b).
Figure 6.
Photodifference maps with isosurfaces (red positive, blue negative) of ±0.25 e Å−3 (a) and ±0.175 e Å−3 (b) (calculated with XDGRAPH of the XD program set; Volkov et al., 2006 ▶).
3.2. The least-squares results
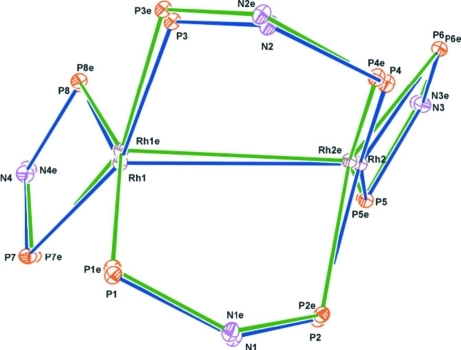
The results of the refinement on the excited-state Rh atom positions and the ligand translations and rotations are listed in Table 3 ▶. In agreement with the photodifference maps a significant change in the positions of the Rh atoms is observed. As Rh2 moves towards Rh1, but the latter is displaced in a perpendicular direction, the resulting bond shortening of 0.136 (8) Å (Table 4 ▶) is essentially a result of the Rh2 shift. The displacements of the P atoms are generally significant, but hardly affect the Rh—P distances, indicating that the ligands follow the metal atoms. The rigid-body rotations do not exceed 2.5°, but are more pronounced for the terminal ligand attached to Rh1 than for that linked to Rh2 as may be expected from the shift perpendicular to the Rh—Rh bond of the former atom.
A diagram of the molecule illustrating the atomic displacements on excitation is shown in Fig. 7 ▶.
Figure 7.
Molecular diagram indicating atomic shifts on laser excitation. Blue lines: ground state; green lines: excited state. The excited-state atoms are marked with ‘e’ after the label. Ellipsoids are drawn at the 5% probability level for the sake of clarity.
3.3. Comparison with theory
Theoretical DFT calculations were performed both with GAUSSIAN09 (Frisch et al., 2009 ▶) and with the Amsterdam Density Functional program (Velde et al., 2001 ▶). Two different functionals BP86 and B3LYP were used with a number of different basis functions. It is noticeable that even the isolated molecule Rh—Rh distance, determined as 3.183 Å, is calculated considerably longer by all theoretical isolated molecule treatments as shown in Tables 5 ▶ and 6 ▶. The results are slightly better with the BP86 functional applied with both programs (Table 6 ▶), but the bond length and its shortening of 0.136 (8) Å on transition to the triplet state are not well reproduced with either functional, independent of the basis set used. The large discrepancies are at least in part attributed to the effect of the crystal environment on the geometry of both the ground and excited states.
Table 5. Isolated-molecule theoretical bond lengths obtained with GAUSSIAN09 B3LYP functional (Å).
| Basis set | GS | ES | Δ |
|---|---|---|---|
| LANL2DZ | 3.670 | 3.031 | 0.639 |
| 6-31G* | 3.620 | 3.138 | 0.482 |
| 6-311G* | 3.667 | 3.115 | 0.552 |
| WTBS for Rh+ 6-311G* | 3.774 | 3.268 | 0.506 |
Table 6. Isolated-molecule theoretical bond lengths obtained with the BP86 functional.
DZ: double zeta, DZP: double zeta+ polarization functions, QZ4P: coreTZ, Valence 4Z + 4 polarization functions.
| Basis set | GS | ES | Δ |
|---|---|---|---|
| Gaussian | |||
| LANL | 3.364 | 2.941 | 0.423 |
| 6-31G* | 3.386 | 3.057 | 0.329 |
| 6-311G* | 3.439 | 3.069 | 0.370 |
| WTBS for Rh+6-311G* | 3.650 | 3.186 | 0.464 |
| ADF | |||
| TZP | 3.453 | 3.079 | 0.374 |
| QZ4P | 3.403 | – | – |
In an earlier study we applied the mixed quantum-mechanical (QM)/molecular-mechanics (MM) technique to explore the effect of the crystalline environment on the molecular dimensions. In our application the crystal environment is kept constant at the experimental values, while the complex in the crystalline cavity is optimized subject to the constraint imposed by the neighboring atoms (Kaminski et al., 2010 ▶). Results of the QM/MM optimization for the cation of (1) performed with the ADF program using the BP86 functional with different basis sets are tabulated in Table 7 ▶.
Table 7. Theoretical results (BP86 functional, ADF program) for (1) confined in a crystal cavity as calculated with the QM/MM method (Å).
| Basis set | GS | ES | Δ | Experimental Δ |
|---|---|---|---|---|
| DZ | 3.209 | 2.995 | −0.214 | −0.136 (8) |
| TZP | 3.336 | 3.179 | −0.157 |
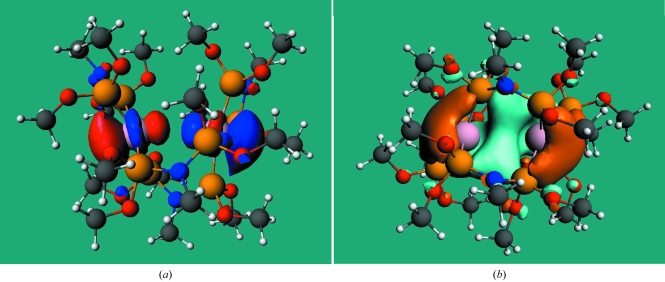
The results confirm that the molecule in the crystal is severely constrained by its crystalline environment, even in the ground state. The ground-state Rh—Rh bond length is best approximated by the smaller basis set DZ (double zeta) calculation, but this result is likely to be fortuitous as the HOMO and LUMO diagrams obtained with this basis set significantly deviate from those from the more advanced calculations. The contraction calculated with the larger TZP basis is within three standard deviations from the experimental result. The HOMO and LUMO orbital diagrams shown in Fig. 8 ▶ indicate an antibonding-to-bonding transition. They are remarkably similar to the diagrams observed in the time-resolved study of the [RhII 2(1,8-diisocyano-p-menthane)4]2+ ion (2). However, in the latter case a much larger contraction of 0.85 (5) Å was observed in crystals of the PF6 − salt. We note that the ground-state Rh—Rh bond length of (2) at 4.496 (1) Å is much longer than that of (1), leaving room for a much larger contraction.
Figure 8.
The HOMO (a) and the LUMO (b) of the title complex (TZP basis, BP86 functional, QM/MM results, isolated-molecule orbitals are essentially identical). Isovalue surfaces at ±0.0275 a.u. Blue/blue–grey positive, red/orange negative.
The experimental changes in the Rh—P distance as determined by the rigid-body refinement of the PNP ligands are listed in Table 8 ▶. The changes are of the same magnitude as the standard deviations derived from those of the rotation and translation parameters of the refinement. Nevertheless, except for the Rh1—P8 distance there seems to be a clear correlation with the changes determined theoretically with the QM/MM method.
Table 8. Calculated (QM/MM) and observed changes in the Rh—P distances Δ on excitation (Å).
| QM/MM TZP | Ground | Excited | Δ(theory) | Δ(experimental) | σ(experimental) | |
|---|---|---|---|---|---|---|
| Rh1—P1 | 2.285 | 2.295 | 0.010 | 0.018 | 0.033 | Bridging 1 |
| Rh2—P2 | 2.297 | 2.276 | −0.021 | −0.027 | 0.028 | |
| Rh1—P3 | 2.307 | 2.281 | −0.026 | −0.018 | 0.029 | Bridging 2 |
| Rh2—P4 | 2.281 | 2.284 | 0.003 | −0.006 | 0.030 | |
| Rh2—P5 | 2.324 | 2.320 | −0.004 | 0.035 | 0.028 | Terminal 1 |
| Rh2—P6 | 2.311 | 2.339 | 0.028 | 0.020 | 0.030 | |
| Rh1—P7 | 2.333 | 2.370 | 0.037 | 0.045 | 0.022 | Terminal 2 |
| Rh1—P8 | 2.330 | 2.338 | 0.008 | −0.058 | 0.022 |
4. Conclusions
We conclude that the improved Laue method is capable of producing excited-state structures at atomic resolution of a quality at least comparable with those of monochromatic experiments. The much faster data collection allows the use of one of a few X-ray pulses per frame of data, and thus minimizes crystal damage caused by laser exposure of the samples. Equally important, the shorter exposure time optimizes the attainable time resolution. The experimental results are quantitatively supported by the QM/MM calculations which take into account the confining effect of the crystal environment, but not by theoretical results on the isolated complex. This effect has to be taken into account in the interpretation of photochemical properties of molecules in the solid state.
Supplementary Material
Crystal structure: contains datablock(s) I. DOI: 10.1107/S0108767311011883/sh5129sup1.cif
Structure factors: contains datablock(s) I. DOI: 10.1107/S0108767311011883/sh5129Isup2.hkl
Supplementary material file. DOI: 10.1107/S0108767311011883/sh5129sup3.pdf
Acknowledgments
We would like to thank Robert Henning and Tim Graber of BioCARS for assistance and advice with the data collection. This work was funded by the Division of Chemical Sciences, Geosciences, and Biosciences, Office of Basic Energy Sciences of the US Department of Energy, through grant DEFG02-ER15372. Use of the BioCARS Sector 14 was supported by the National Institutes of Health, National Center for Research Resources, under grant number RR007707. The time-resolved facility at Sector 14 was funded in part through a collaboration with Philip Anfinrud (NIH/NIDDK). The Advanced Photon Source is supported by the US Department of Energy, Office of Basic Energy Sciences, under Contract No. W-31-109-ENG-38.
Footnotes
Crystallographic information on the ground-state structure discussed in this paper is available from the IUCr electronic archives (Reference: SH5129). Services for accessing these data are described at the back of the journal.
References
- Benedict, J. B., Makal, A., Sokolow, J. D., Trzop, E., Scheins, S., Henning, R., Graber, T. & Coppens, P. (2011). Chem. Commun. 47, 1704–1706. [DOI] [PMC free article] [PubMed]
- Blakley, R. L., Yin, Y., Lloyd, C., Mague, J. T. & McPherson, G. L. (1989). Chem. Phys. Lett. 157, 398–402.
- Blessing, R. H. (1997). J. Appl. Cryst. 30, 421–426.
- Bolotovsky, R. & Coppens, P. (1997). J. Appl. Cryst. 30, 244–253.
- Cailleau, H., Lorenc, M., Guérin, L., Servol, M., Collet, E. & Buron-Le Cointe, M. (2010). Acta Cryst. A66, 189–197. [DOI] [PubMed]
- Coppens, P., Benedict, J., Messerschmidt, M., Novozhilova, I., Graber, T., Chen, Y.-S., Vorontsov, I., Scheins, S. & Zheng, S.-L. (2010). Acta Cryst. A66, 179–188. [DOI] [PMC free article] [PubMed]
- Coppens, P., Kamiński, R. & Schmøkel, M. S. (2010). Acta Cryst. A66, 626–628. [DOI] [PubMed]
- Coppens, P., Pitak, M., Gembicky, M., Messerschmidt, M., Scheins, S., Benedict, J., Adachi, S., Sato, T., Nozawa, S., Ichiyanagi, K., Chollet, M. & Koshihara, S. (2009). J. Synchrotron Rad. 16, 226–230. [DOI] [PMC free article] [PubMed]
- Coppens, P., Vorontsov, I. I., Graber, T., Gembicky, M. & Kovalevsky, A. Y. (2005). Acta Cryst. A61, 162–172. [DOI] [PubMed]
- Frisch, M. J. et al. (2009). GAUSSIAN09, Revision A.1. Gaussian Inc., Pittsburgh, Pennsylvania, USA.
- Kaminski, R., Schmøkel, M. S. & Coppens, P. (2010). J. Phys. Chem. Lett. 1, 2349–2353.
- Mague, J. T. (1995). Inorg. Chim. Acta, 229, 17–25.
- Messerschmidt, M. & Tschentscher, T. (2008). Acta Cryst. A64, C611.
- Peters, J. (2003). J. Appl. Cryst. 36, 1475–1479.
- Ren, Z. (2010). Precognition User Guide RenZ Research, Inc, Illinois, USA.
- Schmøkel, M. S., Kamiński, R., Benedict, J. B. & Coppens, P. (2010). Acta Cryst. A66, 632–636. [DOI] [PubMed]
- Velde, G. T., Bickelhaupt, F. M., Baerends, E. J., Guerra, C. F., Gisbergen, S. J. A. V., Snijders, J. G. & Ziegler, T. (2001). J. Comput. Chem. 22, 931–967.
- Volkov, A., Macchi, P., Farrugia, L. J., Gatti, C., Mallinson, P. R., Richter, T. & Koritsanszky, T. (2006). XD2006. Middle Tennessee State University, USA, Università di Milano and CNR-ISTM Milano, Italy, University of Glasgow, Scotland, State University of New York at Buffalo, USA, and Freie Universität Berlin, Germany.
- Vorontsov, I. I. & Coppens, P. (2005). J. Synchrotron Rad. 12, 488–493. [DOI] [PubMed]
- Vorontsov, I., Pillet, S., Kamiński, R., Schmøkel, M. S. & Coppens, P. (2010). J. Appl. Cryst. 43, 1129–1130.
Associated Data
This section collects any data citations, data availability statements, or supplementary materials included in this article.
Supplementary Materials
Crystal structure: contains datablock(s) I. DOI: 10.1107/S0108767311011883/sh5129sup1.cif
Structure factors: contains datablock(s) I. DOI: 10.1107/S0108767311011883/sh5129Isup2.hkl
Supplementary material file. DOI: 10.1107/S0108767311011883/sh5129sup3.pdf


