

Abstract
The primate superior colliculus (SC) is important for the winner-take-all selection of targets for orienting movements. Such selection takes time, however, and the earliest motor responses typically are guided by a weighted vector average of the visual stimuli, before the winner-take-all selection of a single target. We tested whether SC activity plays a role in this initial stage of orienting by inactivating the SC in two macaques (Macaca mulatta) with local muscimol injections. After SC inactivation, initial orienting responses still followed a vector average, but the contribution of the visual stimulus inside the affected field was decreased, and the contribution of the stimulus outside the affected field was increased. These results demonstrate that the SC plays an important role in the weighted integration of visual signals for orienting, in addition to its role in the winner-take-all selection of the target.
Introduction
The winner-take-all selection of a single visual target in the presence of distracters is a time-consuming process that can significantly delay the onset of eye movements (Ferrera and Lisberger, 1997; Chou et al., 1999; Krauzlis et al., 1999). The earliest tracking response is to smoothly pursue a weighted average of the motion from the potential targets (Lisberger and Ferrera, 1997). The weighted integration of the visual signals evolves over time toward a winner-take-all outcome (Case and Ferrera, 2007), and the final choice is typically solidified by a saccade to the chosen target (Lisberger, 1998; Gardner and Lisberger, 2001; Liston and Krauzlis, 2003, 2005).
The intermediate and deep layers of the superior colliculus (SC) are known to play a prominent role in the winner-take-all selection of single targets for eye movements. The SC forms a topographic map of visual space important for the execution of saccades (Robinson, 1972; Schiller and Stryker, 1972; Wurtz and Albano, 1980). In addition, some neurons in the SC elevate their firing rate when the target of an impending saccade or pursuit eye movement is within their response field (Glimcher and Sparks, 1992; Horwitz and Newsome, 1999; Krauzlis and Dill, 2002; McPeek and Keller, 2002), and manipulation of SC activity has demonstrated a causal contribution to target selection. Microstimulation of the SC biases eye movements to select the stimulus at the corresponding site (Carello and Krauzlis, 2004; Dorris et al., 2007) and inactivation of the SC biases eye movements to select stimuli outside the affected portion of the visual field (McPeek and Keller, 2004; Nummela and Krauzlis, 2010).
Before the selection of a single target, SC activity shows graded selectivity. In some neurons, SC activity is related to the likelihood of choosing a potential target for eye movement (Basso and Wurtz, 1997, 1998), and SC activity becomes more predictive of the target selection at time points closer to movement onset (Krauzlis and Dill, 2002). However, it is unknown whether activity before winner-take-all selection contributes to the integration of visual signals that occurs during the earliest tracking response.
In this paper we focally inactivated the SC to test whether SC activity is important for the integration of visual signals for orienting, before selection of a single target. One of two potential targets was placed inside the visual field affected by the inactivation and one was placed outside the affected field. Inactivating the SC reduced the contribution of motion from the potential target placed inside the affected visual field. This effect was observed from the initiation of the eye movement, indicating that SC activity affects how visual signals are combined even during the earliest stages of tracking eye movement, in addition to its subsequent role in the winner-take-all selection of the target.
Materials and Methods
Our experiments were controlled by a computer using the Tempo software package (Reflective Computing), and a second computer running the Psychophysics Toolbox (Brainard, 1997; Pelli, 1997) in Matlab (MathWorks) acted as a server device for presenting the visual stimuli. Stimuli were presented with a video monitor (75 Hz, ∼20 pixels/degree) at a viewing distance of 41 cm. Eye movements were recorded using scleral search coils (Judge et al., 1980) and the electromagnetic induction technique (Fuchs and Robinson, 1966) using standard phase detector circuits (Riverbend Instruments). All data and events related to the onset of stimuli were stored on disk during the experiment (1 kHz sampling rate) for additional offline analysis.
Animal preparation.
We collected data from two adult male rhesus monkeys (Macaca mulatta) ages 8 and 9, weighing 9–11 kg. All experimental protocols for the monkeys were approved by the Institute Animal Care and Use Committee and complied with Public Health Service policy on the humane care and use of laboratory animals. The monkeys were prepared and studied using standard surgical techniques that have been described in detail previously (Basso et al., 2000; Krauzlis, 2003).
SC inactivation.
We inactivated portions of each SC in both monkeys using local muscimol injections (0.5 μl, 5 μg/μl; see Table 1). The day before each inactivation experiment, we identified an injection site and depth within the SC using single-unit recording and electrical microstimulation to evoke saccades consistent with metrics encoded by the visited site (microstimulation parameters: 400 ms, 500 Hz, 10–30 μA, biphasic pulses). During the experiment, we usually confirmed our site by observing multiunit or single-unit saccade-related activity and/or evoking saccades with microstimulation. Finally, after injecting muscimol, using a custom-made apparatus modified from Chen et al. (2001), we verified our site by observing reductions in peak velocity of visually guided saccades (Hikosaka and Wurtz, 1985a,b) that were localized to the region of retinotopic space affected by muscimol injection (see Fig. 2A).
Table 1.
Summary of injection experiments
| Subject | Injection number | Injection volume | Injection depth | Injection site |
Stimulus location |
Stimulus velocity | Strength of inactivation |
|||
|---|---|---|---|---|---|---|---|---|---|---|
| (μl) | (mm) | H (°) | V (°) | H (°) | V (°) | (°/s) | S1 | S2 | ||
| V | 1* | 0.5 | 2.7 | −3.7 | −1.6 | −2.4 | 0 | 17.6 | 0.85 | 0.74 |
| 2 | 0.5 | 1.9 | 1.1 | 1.1 | 2.4 | 0 | 17.6 | 0.97 | 0.87 | |
| 3* | 0.5 | 2.5 | 0.6 | −0.1 | 2.6 | 0 | 17.6 | 0.90 | 0.70 | |
| 4 | 0.5 | 2.0 | −4.4 | −0.5 | −2.6 | 0 | 17.6 | 0.88 | 0.71 | |
| 5* | 0.5 | 2.0 | 1.9 | 2.2 | 2.6 | 0 | 17.6 | 0.99 | 0.78 | |
| 6* | 0.5 | 2.1 | 1.5 | 0.5 | 2.6 | 0 | 17.6 | 0.92 | 0.77 | |
| 7 | 0.5 | 1.8 | −4.5 | −0.3 | −2.6 | 0 | 17.6 | 0.86 | 0.66 | |
| 8 | 0.5 | 2.0 | −2.9 | −0.3 | −2.6 | 0 | 17.6 | 0.80 | 0.69 | |
| 9* | 0.5 | 2.2 | 0.2 | 0.8 | 2.6 | 0 | 17.6 | 1.03 | 0.84 | |
| 10a | 0.5 | 2.1 | −4.8 | 0.5 | −2.6 | 0 | 17.6 | 1.07 | 1.10 | |
| 11 | 0.5 | 2.6 | −14 | −2.7 | −5.3 | −5.3 | 37.3 | 0.91 | 0.78 | |
| 12* | 0.45 | 2.3 | 1.2 | −2.0 | 3.5 | −3.5 | 24.9 | 0.99 | 0.80 | |
| 13 | 0.5 | 2.1 | −1.6 | 5.0 | −5.3 | 5.3 | 37.3 | 0.70 | 0.58 | |
| 14 | 0.5 | 2.0 | −11 | −5.2 | −5.3 | −5.3 | 37.3 | 0.65 | 0.59 | |
| P | 15 | 0.5 | 1.5 | 6.7 | 6.9 | 4.4 | 4.4 | 31.2 | 0.56 | 0.62 |
| 16 | 0.5 | 2.0 | −4.9 | 2.3 | −4.4 | 4.4 | 31.2 | 0.55 | 0.55 | |
| 17 | 0.5 | 3.0 | −2.3 | 0.1 | −4.4 | 4.4 | 31.2 | 0.54 | 0.69 | |
| 18 | 0.5 | 2.0 | 0.6 | −0.4 | 4.4 | 0 | 22.1 | 0.71 | 0.58 | |
| 19 | 0.5 | 2.5 | 2.5 | 0.2 | 3.5 | 0 | 17.6 | 0.73 | ||
| 20 | 0.5 | 1.5 | 1.0 | −0.7 | 3.5 | 0 | 17.6 | 0.51 | 0.49 | |
| 21 | 0.5 | 1.8 | −2.3 | 0.5 | −3.5 | 3.5 | 24.9 | 0.59 | 0.59 | |
| 22 | 0.5 | 1.8 | 0.7 | 1.1 | 3.5 | 0 | 17.6 | 0.61 | 0.57 | |
| 23a | 0.5 | 2.5 | 1.4 | −0.7 | 3.5 | 0 | 17.6 | 0.94 | 1.04 | |
The injection site was measured by the mean horizontal (H) and vertical (V) amplitude of evoked saccades at the injection depth. The location of the stimulus targeted by each injection is provided, and the strength of inactivation is given by the peak velocity of saccades to that location shortly after injection (S1) and after finishing data collection (S2), normalized to preinjection saccades.
*The injection site was measured from the same site and depth on the previous day because of failure to evoke saccades with the injectrode.
aSaline was injected instead of muscimol.
Figure 2.

Sample injection experiment (number 12) demonstrating the effect of focal SC inactivation on pursuit of two stimuli. A, The extent of SC inactivation is indicated by plotting the peak velocity of visually guided saccades after injection, normalized to the peak velocity of saccades made before inactivation. This was done shortly after muscimol injection (data not shown) and immediately after collection of pursuit data (shown). The amplitudes of the visually guided saccades are indicated by the small circles. The white diamonds indicate the starting configuration of a sample two-stimuli trial. B, The mean trajectory of smooth pursuit is plotted for single stimuli (light blue) and two stimuli (blue) before muscimol injection, and single stimuli (light red) and two stimuli (red) after injection in steps of 3 ms for the first 50 ms from pursuit onset. C, Horizontal and vertical eye velocities for single-stimulus trials (black) and two-stimuli trials (red), after SC inactivation, from smooth pursuit onset (vertical gray line). Conventions are the same as in Figure 1C.
Preinjection data were collected with our injection apparatus resting >2 mm above our estimate of SC surface from the previous day. Parameters for the behavioral task were identical for preinjection and postinjection datasets, although we rewarded the subjects somewhat more generously as the session progressed to maintain motivation. Recovery data were collected on the day following each inactivation experiment to confirm that the monkeys' preinjection behavior remained stationary; recovery data did not show significant changes in weight from preinjection data (p > 0.2, t tests, n = 13 for monkey V, n = 8 for monkey P).
Behavioral tasks.
We collected pursuit responses at the onset of two moving stimuli or a single moving stimulus (Fig. 1A). At the start of each trial, the subjects were required to fix gaze on a white 0.2° × 0.2° spot (130 cd/m2) at the center of visual display, with gray background (16 cd/m2) for 0.5–1 s. Following the fixation period, one or two 0.2° × 0.2° (130 cd/m2) spots appeared and moved at constant velocity toward the center of the screen. On two-stimuli trials, upon reaching the center of the screen, one stimulus disappeared, leaving a single target which continued on for another 500 ms. The monkey was given a small juice reward for tracking the target during the final 250 ms. For a single experiment, stimuli were placed at a fixed eccentricity (2.4–7.5°) and velocity (17.6–37.3°/s) that were matched to minimize the occurrence of corrective saccades within the first 100 ms of pursuit initiation (Rashbass, 1961). Stimuli were placed along either cardinal or diagonal axes depending on the site of SC inactivation. Single-stimulus and two-stimuli trials were interleaved. For single-stimulus trials all four stimulus onset locations, and for two-stimuli trials all four combinations of two adjacent stimuli (moving in orthogonal directions), were interleaved with equal probability.
Figure 1.

Schematic of pursuit tasks and sample behavior. A, Each box depicts the monitor display at an important point in the trial for two-stimuli (top) and single-stimulus (bottom) trials. In a single experiment, stimuli moved along either the cardinal axes or diagonal axes (shown). For single-stimulus trials, stimuli that moved in each of the four directions were presented with equal probability, and for two-stimuli trials any two adjacent stimuli were presented on a given trial. B, The trajectory of smooth pursuit is plotted for single stimuli moving toward the upper right or lower right quadrant (gray) and, for both stimuli presented together (blue), in steps of 3 ms for the first 50 ms from pursuit onset. C, Horizontal and vertical eye velocities for single-stimulus trials (black) and two-stimuli trials (blue) from smooth pursuit onset (vertical gray line), averaged over ∼36 (single-stimulus) or 72 (two-stimuli) trials. Saccades have been removed for clarity. The first 50 ms of pursuit, used to calculate the initial pursuit response, are highlighted by the yellow shading. D, The mean horizontal and vertical velocities during the first 50 ms of smooth pursuit, shown in B and C, are plotted as vectors for single-stimulus trials (solid black) and for two-stimuli trials (solid blue). The weights for each stimulus are given and plotted as scaled vectors (dashed blue), which sum up to the response for the two-stimuli trials.
Monkeys also performed a visually guided saccade task to measure the spatial extent of each SC inactivation. In this task, monkeys were required to fixate a centrally located 0.2° × 0.2° white spot for 500–1000 ms, after which the spot stepped to another location on the display. The monkeys were given a small juice reward for making a saccade to the white spot within 500 ms.
Data analysis.
Eye movements were sampled at 1 kHz. The onset of pursuit was estimated from traces of radial eye velocity on individual trials using a linear regression technique described previously (Adler et al., 2002), using modifications detailed by Nummela and Krauzlis (2010). Saccades were detected using 40°/s velocity and 800°/s2 acceleration thresholds (Krauzlis and Miles, 1996), except before pursuit onset, when we used more stringent thresholds of 8°/s velocity and 250°/s2 acceleration. All markings of saccades were manually inspected and verified. If a saccade occurred after motion onset and before 50 ms from pursuit onset, the trial was discarded from further analysis.
Pursuit responses were characterized by measuring the mean horizontal and vertical velocity over many trials with the same stimulus configuration. The contribution, or weight, of each moving stimulus on two-stimuli trials was calculated by decomposing the pursuit response to both stimuli, R⃗12, into the pursuit responses of the individual stimuli, R⃗1 and R⃗2, by solving Equation 1:
where w1 and w2 are the weights for each stimulus. It is important to note that pursuit responses are a function of time and that the latency of pursuit can depend on the number and configuration of stimuli present (Ferrera, 2000). We measured responses using two methods. One method measured the pursuit response over a fixed interval from pursuit onset, resulting in a measurement that varies in time from motion onset depending on pursuit latency. The other method measured the pursuit response over a fixed interval from stimulus motion onset, which introduced more variability in response velocity. Both methods provided similar results.
Comparisons within individual experiments were made using Wilcoxon rank sum tests because the data were often not normally distributed. Almost all comparisons within groups of inactivation experiments were made using Student's t tests, justified by Lilliefors' tests. In the case where the data were found to be different from a normal distribution, we used a nonparametric sign test. We corrected for multiple comparisons using the Holm-Sidak step-down procedure (Ludbrook, 1998). The changes in stimulus weight were averaged over both stimulus configurations, before making group comparisons, to provide a single value for the weight of stimuli inside the affected field and a single value for the weight of stimuli outside the affected field for each experiment. For some inactivation experiments, we were not able to calculate the changes in weight from stimulus motion onset (see Fig. 6F) because the pursuit signal was overwhelmed by noise. Only experiments that were not contiguous in a histogram of stimulus weights (bin width 0.5) were omitted, and these deviations in the histogram were typically outliers (e.g., a weight of −12 or 79 compared with most weights clustering around 0.5).
Figure 6.

Time course of the change in stimulus weight. A, B, The ratio of postinjection weight to preinjection weight is plotted in 20 ms bins from smooth pursuit onset (A) and from stimulus motion onset (B) for a sample SC inactivation (number 19). C, D, Mean radial eye velocity aligned to pursuit onset (C) and stimulus motion onset (D) shows the time course of the pursuit eye movement. E, F, The ratio of postinjection weight to preinjection weight is plotted in 20 ms bins from smooth pursuit onset (E) and from motion onset (F), averaged across the set of 21 SC inactivations. Blue points indicate the change in weight for the stimuli placed inside the affected visual field and green points indicate the change for stimuli placed outside the affected visual field. Error bars are 95% confidence intervals.
Results
We measured the initial smooth pursuit eye movement tracking of a single target or two potential targets (Fig. 1A) in two monkeys, V and P. On two-stimuli trials, the stimuli moved in orthogonal directions toward the center of the screen. Upon reaching the center, one stimulus disappeared, and the subject was rewarded for tracking the remaining target. The subjects were given no reason to prioritize one stimulus over another; they were identical in appearance and were equally likely to become the rewarded target.
Initially, smooth pursuit of two stimuli was a weighted average of the pursuit response to the individual stimuli. Figure 1B shows the trajectory of the first 50 ms of smooth pursuit, averaged over ∼50 trials, to single stimuli (gray) and two stimuli (blue). Tracking two stimuli uses motion signals from both of the diagonally moving stimuli, resulting in horizontal pursuit. To quantify this response, we took the mean horizontal and vertical eye velocities over the first 50 ms from pursuit onset, which is indicated by the yellow shaded region in Figure 1C. The mean horizontal and vertical pursuit eye velocities can then be plotted as vectors (Fig. 1D) for the one-stimulus trials (solid black) and two-stimuli trials (solid blue). Stimulus weights were calculated by decomposing the response to both stimuli, R⃗12, into the responses to the individual stimuli, R⃗1 and R⃗2, by solving Equation 1: R⃗12(t) = w1R⃗1(t) + w2R⃗2(t), in which w1 and w2 indicate the weights of each stimulus. For the sample pursuit in Figure 1D, the weights of each stimulus, which scale the responses to the individual stimuli, are also plotted as vectors (dashed blue) and were 0.72 for each stimulus.
To test whether SC activity is important for the weighted integration of visual motion that initially occurs on two-stimuli trials, smooth pursuit during the single- and two-stimuli tasks was recorded before and after focal muscimol injection to SC sites that corresponded to the starting position of one of the pursuit stimuli. A total of 21 muscimol injections were performed (Table 1), 13 in subject V and 8 in subject P, spanning both colliculi. Additionally, saline was injected, in place of muscimol, for one experiment in each subject.
Sample SC inactivation experiment
The visual field affected by a representative muscimol injection (injection 12, Fig. 2A) is indicated by the reduction in peak velocity of visually guided saccades. The small circles indicate the end-points of saccades made after muscimol injection. The white diamonds indicate the starting position and motion direction for two of the pursuit stimuli, illustrating one of the stimulus configurations for the two-stimuli task. For this injection, the stimulus located in the upper left visual field, which moved diagonally down and right, was located inside the affected visual field.
The sample SC inactivation caused small shifts in pursuit to single stimuli and a larger upward shift in pursuit to both stimuli together, shown by the pursuit trajectories (Fig. 2B) and pursuit eye velocity (Fig. 2C). As indicated by Equation 1, the change in pursuit to both stimuli could be caused either by changes to pursuit of individual stimuli or by changes in the weighting of those responses. We will summarize how SC inactivation affected the responses to single stimuli, and then we will summarize how SC inactivation affected the weighting of each stimulus.
SC inactivation affected smooth pursuit on single-stimulus trials
SC inactivation affected the initial pursuit of single stimuli placed inside the affected visual field, as has been reported previously (Basso et al., 2000). Figure 3A plots the mean velocity over the first 50 ms of smooth pursuit to single stimuli placed inside the affected visual field before inactivation against the velocity after inactivation. In 9 of the 21 SC inactivations, the initial pursuit velocity of the stimulus within the affected visual field was significantly reduced (p < 0.05, rank sum tests), mostly (7 of 9) in subject V. There was no consistent trend for single stimuli placed adjacent to, and outside, the affected visual field, with 3 experiments showing a significant decrease in initial pursuit velocity and 3 showing a significant increase (p < 0.05, rank sum tests, Fig. 3B). Group comparisons by monkey, shown in Figure 3C, found that only subject V had a significant decrease in velocity, by 19%, for single stimuli placed inside the affected visual field (p < 0.001, t test, n = 13), whereas there was no decrease for subject P (p = 0.53, t test, n = 13). There was no significant increase in weight for the stimuli adjacent to the affected field for subject V (p = 0.86, t test, n = 8), but there was a small, significant increase in velocity, by 7%, for subject P (p = 0.02, t test, n = 8).
Figure 3.

The effects of SC inactivation on single-stimulus trials. A, B, For single-stimuli trials, changes in the initial pursuit response are illustrated by plotting the mean initial eye velocity before muscimol injection against the mean initial eye velocity after muscimol injection. The change in eye velocity is plotted separately for stimuli placed inside the affected visual field (A) and stimuli placed adjacent to the affected visual field (B). The changes in velocity are indicated by diamonds for subject P and circles for subject V. Filled symbols indicate a significant difference at the 0.05 level, and the red symbol indicates the sample inactivation from Figure 2. C, The mean change in eye velocity for the group of experiments is summarized for each subject by plotting the ratio of the initial pursuit velocity after injection to the velocity before injection (n = 13 for V, n = 8 for P). Error bars are SDs; *significant change in weight at the 0.05 level.
These changes in pursuit to individual stimuli in each monkey would be expected to shift pursuit on two-stimuli trials to more strongly follow the stimulus outside the affected visual field. In monkey V, this would be primarily from a reduced response to the stimulus inside the affected field, and for monkey P this would be primarily from an increased response to the stimulus outside the affected field. Thus, the upward shift in pursuit seen in the sample SC inactivation (Fig. 2C) may partly be due to changes in the responses to single stimuli.
SC inactivation changed the weighting of stimuli
To see whether SC inactivation changed the weighting of stimuli, in addition to the changes in pursuit of single stimuli, we calculated the weights of each stimulus using Equation 1 with pursuit collected after SC inactivation. The calculation for the sample inactivation from Figure 2 is illustrated in Figure 4A, which shows a larger weight of 0.85 for the stimulus moving up and to the right and a smaller weight of 0.47 for the stimulus moving down and to the right. Figure 4B shows that the weight of the stimulus inside the affected field was significantly decreased following SC inactivation (p < 0.001, rank sum test, n = 69 trials preinjection, n = 84 trials postinjection), and the weight of the stimulus outside the affected field was significantly increased (p = 0.04, rank sum test) following this sample SC inactivation.
Figure 4.
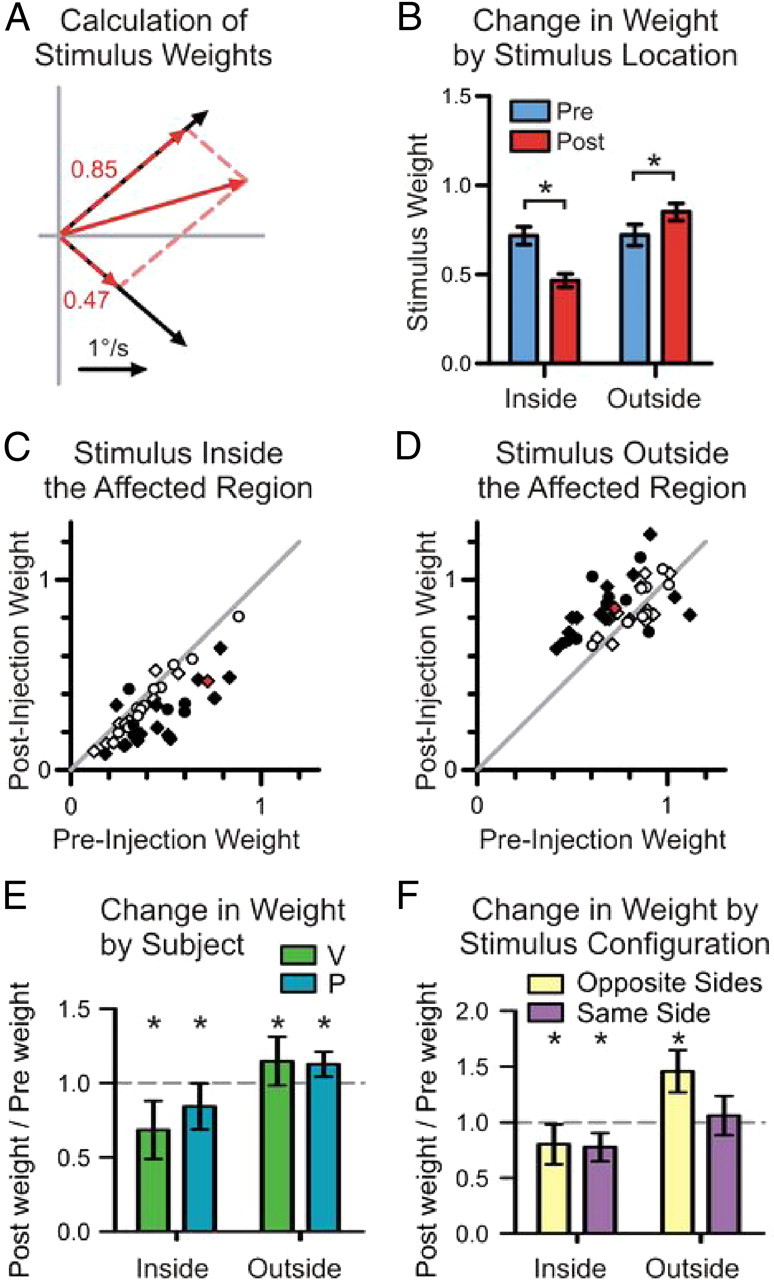
The effects of SC inactivation on stimulus weight. A, The mean horizontal and vertical velocities during the first 50 ms of smooth pursuit are plotted as vectors for single-stimulus trials (solid black) and for the two-stimulus trials after SC inactivation (solid red). The weights for each stimulus are given and plotted as scaled vectors (dashed red), which sum up to the response for the two-stimuli trials. B, The stimulus weights calculated in Figures 1D and 4A are plotted separately for the stimulus that started inside the affected visual field and for the stimulus that started outside the affected visual field before (blue) and after (red) SC inactivation. Error bars are SEM; *significant difference at the 0.05 level. C, D, For two-stimuli trials, changes in stimulus weight are illustrated by plotting the weight before muscimol injection against the weight after muscimol injection. The change in weight is plotted separately for the stimulus placed inside the affected visual field (C) and the accompanying stimulus placed outside the affected visual field (D). The changes in weight are indicated by diamonds for subject P and circles for subject V. Filled symbols indicate a significant difference at the 0.05 level, and the sample SC inactivation from Figure 2 is red. E, The mean change in weight for the group of experiments is summarized for each subject by plotting the ratio of the weight after injection to the weight before injection (n = 13 for V, n = 8 for P). Error bars are SDs; *significant change in mean weight at the 0.05 level. F, For experiments with stimuli moving along diagonal axes (n = 8), the change in stimulus weight is plotted separately for trial configurations with both stimuli placed in the same visual hemifield (purple) and for trial configurations with each stimulus placed in opposite hemifields (yellow). Error bars and * follow the same convention as in E.
SC inactivation consistently decreased the weight of moving stimuli placed inside the affected visual field across the set of 21 experiments. This is summarized in Figure 4C by plotting the stimulus weight after muscimol injection against the stimulus weight before muscimol injection. There are two data points for each SC inactivation, one for each configuration of two stimuli in which one stimulus was placed inside the affected field. Filled symbols indicate a significant change in weight (p < 0.05), and the red symbol indicates the sample from Figure 4B. There was a significant decrease in the weight of stimuli placed inside the affected field in 22 of the 42 configurations (p < 0.05, rank sum tests).
SC inactivation also tended to increase the weight of the stimulus placed outside the affected visual field (Fig. 4D), with a significant increase in weight measured in 21 of the 42 configurations (p < 0.05, rank sum tests).
A decrease in weight for the stimulus inside the affected field and an increase in weight for the stimulus outside the affected field were observed in both monkeys. Figure 4E plots the mean change in weight by stimulus location (in or out of the affected field) and subject (V or P) for all 21 muscimol injections. For subject V, SC inactivation caused a highly significant decrease in weight for stimuli placed inside the affected field, by 32% on average (p < 0.001, t test, n = 13), and a significant 15% increase in weight for stimuli placed outside the affected field (p = 0.01, t test, n = 13). For subject P, SC inactivation caused a significant decrease in weight by 16% for stimuli placed inside the affected field (p = 0.047, t test, n = 8) and a significant increase in weight by 13% for stimuli placed outside the affected field (p = 0.004, t test, n = 8). Although SC inactivation caused a larger decrease in weight for stimuli inside the affected field for monkey V, we pooled data from both monkeys for further analyses because both monkeys showed the same qualitative changes in stimulus weighting.
The decrease in stimulus weight was restricted to the affected field
SC inactivation affected the weight of stimuli similarly, whether they were both in the same visual hemifield (and thus represented by the same colliculus) or in opposite visual hemifields. A summary of the change in weight for the eight experiments with stimuli moving in diagonal directions is given in Figure 4F. The weight of the stimulus inside the affected field was significantly decreased by ∼20% whether it was accompanied by a stimulus in the same hemifield (p = 0.002, t test, n = 8) or in the opposite hemifield (p = 0.025, t test, n = 8), and there was no difference in how much the weight decreased (p = 0.7, t test, n = 8). There was an accompanying increase in weight by 46% for stimuli placed in the hemifield opposite the affected visual field (p < 0.001, t test, n = 8), whereas the weight of stimuli outside the affected field, but in the same hemifield, had a much smaller increase in weight of 6%, which did not reach significance (p = 0.18, t test, n = 8).
SC inactivation affected response latency
In addition to changing the initial velocity of pursuit and changing the weighting of the stimuli, SC inactivation also altered pursuit latency. Figure 5A shows the mean changes in pursuit latency for each monkey over all SC inactivation experiments. For monkey V, pursuit latency was increased by 13 ms for single stimuli placed in the affected field (p < 0.001, t test, n = 13) and virtually unchanged (1 ms difference) for single stimuli placed out of the affected field (p = 0.33, t test, n = 13). Pursuit latency was increased an intermediate amount of 5 ms for two-stimuli trials, which did not reach significance after corrections for multiple comparisons (p = 0.05, t test, n = 13). For monkey P, latency was increased, but not significantly, by 6 ms for single stimuli inside the affected field (p = 0.05, t test, n = 8), increased by 8 ms for single stimuli outside the affected field (p < 0.001, t test, n = 8), and increased by 7 ms for two-stimuli trials (p = 0.003, t test, n = 8).
Figure 5.

The effects of SC inactivation on pursuit latency. A, The mean changes in pursuit velocity are shown for single-stimulus trials with the stimulus inside the affected visual field, with the stimulus outside the affected visual field, and for two-stimuli trials for monkey V (n = 13) and P (n = 8), separately. Error bars are SDs; *significant change in mean latency at the 0.05 level. B, Recalculation of the changes in stimulus weight using a fixed interval from stimulus motion onset (135–185 ms) instead of the first 50 ms from pursuit onset. Conventions are the same as in Figure 4E.
In general, SC inactivation tended to increase the latency of pursuit. Although it is possible this is a genuine delay in pursuit onset, one other possibility is that the observed decreases in pursuit velocity (especially in response to stimuli placed in the affected visual field, Fig. 3A) made it harder to detect the onset of pursuit, and introduced a systematic bias for marking pursuit onset later. One way to ensure our results are not dependent on the method of marking pursuit is to measure pursuit responses from a fixed time after stimulus onset. We recalculated the change in stimulus weights using the pursuit response from 135 to 185 ms after stimulus onset (50 ms from the mean pursuit latency on preinactivation trials), and the results, plotted in Figure 5B, are similar to the change in weights calculated in Figure 4E. The weight of stimuli inside the affected visual field was decreased by 16% for monkey V (p = 0.03, sign test, n = 13) and 17% for monkey P (p = 0.004, t test, n = 8), whereas the weight of stimuli outside the affected field was increased by 8% for monkey V (p = 0.11, t test, n = 13) and 18% for monkey P (p < 0.001, t test, n = 8).
SC inactivation affected stimulus weight from the initiation of pursuit
We examined the effect of SC inactivation on stimulus weight at a finer timescale during pursuit initiation by calculating the mean change in stimulus weight in 20 ms blocks from pursuit onset. Figure 6A shows the change in stimulus weight from pursuit onset for stimuli placed inside (blue) and outside (green) the affected visual field for a sample SC inactivation. Qualitatively, the weight of the stimulus inside the affected field was reduced at the onset of pursuit, and this decrease in weight was sustained over the initiation of pursuit. Similarly, there was an increase in the weight of the stimulus placed outside the affected field. Figure 6C provides an accompanying plot of the radial eye velocity indicating the time course of the pursuit eye movement. The mean result, over all 21 SC inactivation experiments, was a significant decrease in weight for stimuli placed inside the affected field (Fig. 6E, t tests) and increase in weight for stimuli placed outside the affected field, which was sustained throughout the first 200 ms of pursuit.
We measured a mean pursuit latency of 135 ms for both one- and two-stimulus trials, even though pursuit was initiated by 100 ms on some trials. Another way to analyze the data, independent of marking the initiation of pursuit, is to calculate the change in stimulus weight from the stimulus onset. This method results in noisier weight measurements because eye velocity was not significantly different from eye velocity at fixation (see Materials and Methods) on many trials for time points before 140 ms from motion onset. A sample of stimulus weights calculated from stimulus onset is shown in Figure 6B, with an accompanying plot of mean radial eye velocity (Fig. 6D). The mean result over the set of 21 experiments still showed a significant and sustained decrease in weight of the stimulus inside the affected visual field, as soon as 100–120 ms from stimulus motion onset (Fig. 6F, t tests). The size of the error bars indicating the 95% confidence intervals from 100 to 140 ms reflects the noisier measurement of stimulus weight. Aligned on stimulus onset, the increase in weight of the stimulus outside the affected field first became apparent after 140 ms and sustained significance after 180 ms from stimulus motion onset.
Saline experiments
Two injections were performed with saline instead of muscimol, one in each monkey. Neither injection caused a significant change in the weight of stimuli placed inside or outside the affected field (p > 0.05). If anything, the weights trended slightly in the opposite direction after saline injection compared with muscimol injection. These experiments indicate that the changes in stimulus weight were caused by the action of muscimol inactivating neurons in the SC and not any other factor related to performing an injection on the subjects.
Discussion
The primary finding of this study is that SC inactivation reduces the contribution of potential targets placed inside the affected visual field to the earliest smooth pursuit eye movement. There was also an increase in the contribution of potential targets placed outside the affected visual field. These results demonstrate that the SC is important for the weighted integration of visual signals from potential targets, before the winner-take-all selection of a single target.
To our knowledge, this is the first demonstration that the primate SC is involved in how visual signals are processed and combined to produce eye movement, before selection of a single target. This result is in stark contrast to the traditional view of the SC as a motor map for saccadic eye movement (Wurtz and Albano, 1980). The SC has previously been implicated in vector averaging for saccades. Populations of neurons that have a coarse spatial tuning for the saccade end-point are combined as a vector average to produce the eye movement (Robinson, 1972; Lee et al., 1988). However, those findings point toward a role in the SC for integrating saccade motor plans, not the visual signals used to construct those motor plans. An important feature of our task is that the visual signals being integrated are located in the opposite direction from the resulting eye movement (Rashbass, 1961). This dissociation of motor plan from the sensory signals unambiguously demonstrates that SC activity is important for integrating the visual signals, not the motor plans built from those visual signals.
Of particular importance is that SC inactivation affected the weighting of potential targets from the very start of the eye movement, showing significant effects as early as 100–120 ms from stimulus motion onset (Fig. 6). This influence on the earliest sensorimotor processing for smooth pursuit bolsters the view of smooth pursuit and saccadic eye movement as being different outcomes from a shared cascade of sensorimotor functions (Krauzlis, 2004). It has previously been shown that the SC is important for pursuit target selection from observations that the target of a saccade is also selected by smooth pursuit (Lisberger, 1998; Gardner and Lisberger, 2001, 2002; Schoppik and Lisberger, 2006) and demonstration that SC activity is important for the winner-take-all selection of pursuit targets in the absence of saccades (Carello and Krauzlis, 2004; Nummela and Krauzlis, 2010). Together, these studies show that the SC imposes a winner-take-all target selection on the smooth pursuit system. By demonstrating that the SC is also involved in the weighted integration of visual signals at the initiation of pursuit, we have shown that the SC is actually an integral part of the sensorimotor processing for both pursuit and saccades. These results also implicate the SC as a source of the shared target selection for pursuit and saccades found in behavioral studies (Liston and Krauzlis, 2003, 2005; Case and Ferrera, 2007).
The SC has been previously implicated in vector averaging for saccades (Robinson, 1972; Lee et al., 1988; Edelman and Keller, 1998), but the underlying mechanisms appear to be different from what we have observed. In particular, Edelman and Keller (1998) found that during short-latency saccades evoked by two visual targets, the activity of SC visuomotor neurons tends to match the location of the visual stimulus rather than the saccade vector. This implies that for vector-averaging saccades, the computation of the saccade vector is not complete at the level of the SC, and involves merging of saccade motor commands downstream. This type of explanation does not apply to our finding that SC inactivation alters vector averaging for pursuit, because the SC does not produce the pursuit motor commands. Instead, our results imply that SC activity influences how sensory signals are integrated in forming the pursuit motor commands.
Our results provide a novel interpretation for the role of low-frequency activity of SC “buildup” neurons that occurs before the bursts of activity important for generating saccades (Munoz and Wurtz, 1995; Krauzlis et al., 2000). Because the firing rate of buildup neurons is correlated to reaction time of the eye movement (Basso and Wurtz, 1998; Dorris and Munoz, 1998), this activity has previously been interpreted as motor preparation for the orienting response. In contrast, our results suggest an alternative, though not mutually exclusive function—that buildup activity is important for determining the weight, or contribution, of visual signals used for tracking eye movement. Buildup activity is well suited for such a role because it increases upon stimulus onset and discriminates the visual stimulus that will be selected as the target of eye movement from distracter stimuli, even in the absence of saccades (Krauzlis and Dill, 2002). Also, buildup activity is related to the probability that a stimulus within the response field will be selected as the target of eye movement (Basso and Wurtz, 1998; Dorris and Munoz, 1998). These prior studies indicate that buildup activity should be present during the tracking tasks we used, and furthermore, that the activity should be lower on two-stimuli trials than on single-stimulus trials, reflecting the reduced stimulus weights that results in tracking a vector average of the motion signals rather than the vector sum.
Although we injected muscimol into the SC layers known to contain buildup neurons, our experiments cannot rule out the possibility that inhibition of other types of neurons are responsible for the effects on the integration of visual stimuli. One practical way to further test this candidate role of buildup neurons would be to record their activity during the two-stimuli tracking task. Buildup activity should be correlated to stimulus weight on a trial-by-trial basis if the activity is important for determining that weight.
We found that SC inactivation only decreased the weight of stimuli targeted by muscimol injection, whether the stimuli were presented in opposite visual hemifields or in the same visual hemifield (Fig. 4F), in which case both stimuli are represented by only the right or left SC. This indicates that the mechanism responsible for decreasing stimulus weight operates on a finer spatial scale than left versus right visual hemifields. However, the increase in weight for the stimuli outside the affected visual field did depend on the hemifield, with larger increases for stimuli that appeared in the opposite hemifield. One possibility is that stimuli outside the affected field, but in the same hemifield, would have showed a comparable increase except that muscimol spread to partially affect the stimulus location. Another possibility is that the increase in stimulus weight, unlike the decrease, depends on the overall activity level of the left versus right SC, perhaps due to competition between the colliculi. Our experiments cannot clearly distinguish between these two explanations, but either case is entirely consistent with the SC having an important role in determining the contributions of visual stimuli to smooth pursuit.
The superior colliculus has been hypothesized to contain a salience or priority map important for the selection of behaviorally relevant stimuli (Fecteau and Munoz, 2006; Mysore et al., 2010). Recent inactivation experiments have extended the scope of behaviors that rely on SC activity, showing results consistent with the SC acting as a priority map for eye movements (Nummela and Krauzlis, 2010) and perceptual judgments (Lovejoy and Krauzlis, 2010). So far, experiments that have causally tested whether the SC activity is consistent with a priority map have used behaviors that required selection of only a single visual stimulus, and recent work has indicated mechanisms by which the SC may develop the winner-take-all selectivity important for these behaviors (Asadollahi et al., 2010). Nevertheless, many behaviors require using more than one stimulus. Our results demonstrate that this concept of the SC as a priority map generalizes to behaviors that require the integration of multiple visual stimuli.
Footnotes
This research was funded by the National Institutes of Health (Grant EY012212) and the Aginsky Estate.
References
- Adler SA, Bala J, Krauzlis RJ. Primacy of spatial information in guiding target selection for pursuit and saccades. J Vis. 2002;2:627–644. doi: 10.1167/2.9.5. [DOI] [PubMed] [Google Scholar]
- Asadollahi A, Mysore SP, Knudsen EI. Stimulus-driven competition in a cholinergic midbrain nucleus. Nat Neurosci. 2010;13:889–895. doi: 10.1038/nn.2573. [DOI] [PMC free article] [PubMed] [Google Scholar]
- Basso MA, Wurtz RH. Modulation of neuronal activity by target uncertainty. Nature. 1997;389:66–69. doi: 10.1038/37975. [DOI] [PubMed] [Google Scholar]
- Basso MA, Wurtz RH. Modulation of neuronal activity in superior colliculus by changes in target probability. J Neurosci. 1998;18:7519–7534. doi: 10.1523/JNEUROSCI.18-18-07519.1998. [DOI] [PMC free article] [PubMed] [Google Scholar]
- Basso MA, Krauzlis RJ, Wurtz RH. Activation and inactivation of rostral superior colliculus neurons during smooth pursuit eye movements in monkeys. J Neurophysiol. 2000;84:892–908. doi: 10.1152/jn.2000.84.2.892. [DOI] [PubMed] [Google Scholar]
- Brainard DH. The Psychophysics Toolbox. Spat Vis. 1997;10:433–436. [PubMed] [Google Scholar]
- Carello CD, Krauzlis RJ. Manipulating intent: evidence for a causal role of the superior colliculus in target selection. Neuron. 2004;43:575–583. doi: 10.1016/j.neuron.2004.07.026. [DOI] [PubMed] [Google Scholar]
- Case GR, Ferrera VP. Coordination of smooth pursuit and saccade target selection in monkeys. J Neurophysiol. 2007;98:2206–2214. doi: 10.1152/jn.00021.2007. [DOI] [PubMed] [Google Scholar]
- Chen LL, Goffart L, Sparks DL. A simple method for constructing microinjectrodes for reversible inactivation in behaving monkeys. J Neurosci Methods. 2001;107:81–85. doi: 10.1016/s0165-0270(01)00354-5. [DOI] [PubMed] [Google Scholar]
- Chou IH, Sommer MA, Schiller PH. Express averaging saccades in monkeys. Vision Res. 1999;39:4200–4216. doi: 10.1016/s0042-6989(99)00133-9. [DOI] [PubMed] [Google Scholar]
- Dorris MC, Munoz DP. Saccadic probability influences motor preparation signals and time to saccadic initiation. J Neurosci. 1998;18:7016–7026. doi: 10.1523/JNEUROSCI.18-17-07015.1998. [DOI] [PMC free article] [PubMed] [Google Scholar]
- Dorris MC, Olivier E, Munoz DP. Competitive integration of visual and preparatory signals in the superior colliculus during saccadic programming. J Neurosci. 2007;27:5053–5062. doi: 10.1523/JNEUROSCI.4212-06.2007. [DOI] [PMC free article] [PubMed] [Google Scholar]
- Edelman JA, Keller EL. Dependence on target configuration of express saccade-related activity in the primate superior colliculus. J Neurophysiol. 1998;80:1407–1426. doi: 10.1152/jn.1998.80.3.1407. [DOI] [PubMed] [Google Scholar]
- Fecteau JH, Munoz DP. Salience, relevance, and firing: a priority map for target selection. Trends Cogn Sci. 2006;10:382–390. doi: 10.1016/j.tics.2006.06.011. [DOI] [PubMed] [Google Scholar]
- Ferrera VP. Task-dependent modulation of the sensorimotor transformation for smooth pursuit eye movements. J Neurophysiol. 2000;84:2725–2738. doi: 10.1152/jn.2000.84.6.2725. [DOI] [PubMed] [Google Scholar]
- Ferrera VP, Lisberger SG. The effect of a moving distractor on the initiation of smooth-pursuit eye movements. Vis Neurosci. 1997;14:323–338. doi: 10.1017/s0952523800011457. [DOI] [PubMed] [Google Scholar]
- Fuchs AF, Robinson DA. A method for measuring horizontal and vertical eye movement chronically in the monkey. J Appl Physiol. 1966;21:1068–1070. doi: 10.1152/jappl.1966.21.3.1068. [DOI] [PubMed] [Google Scholar]
- Gardner JL, Lisberger SG. Linked target selection for saccadic and smooth pursuit eye movements. J Neurosci. 2001;27:2075–2084. doi: 10.1523/JNEUROSCI.21-06-02075.2001. [DOI] [PMC free article] [PubMed] [Google Scholar]
- Gardner JL, Lisberger SG. Serial linkage of target selection for orienting and tracking eye movements. Nat Neurosci. 2002;5:892–899. doi: 10.1038/nn897. [DOI] [PMC free article] [PubMed] [Google Scholar]
- Glimcher PW, Sparks DL. Movement selection in advance of action in the superior colliculus. Nature. 1992;355:542–545. doi: 10.1038/355542a0. [DOI] [PubMed] [Google Scholar]
- Hikosaka O, Wurtz RH. Modification of saccadic eye movements by GABA-related substances. I. Effect of muscimol and bicuculline in monkey superior colliculus. J Neurophysiol. 1985a;53:266–291. doi: 10.1152/jn.1985.53.1.266. [DOI] [PubMed] [Google Scholar]
- Hikosaka O, Wurtz RH. Modification of saccadic eye movements by GABA-related substances. II. Effects of muscimol in monkey substantia nigra pars reticulate. J Neurophysiol. 1985b;53:292–308. doi: 10.1152/jn.1985.53.1.292. [DOI] [PubMed] [Google Scholar]
- Horwitz GD, Newsome WT. Separate signals for target selection and movement specification in the superior colliculus. Science. 1999;284:1158–1161. doi: 10.1126/science.284.5417.1158. [DOI] [PubMed] [Google Scholar]
- Judge SJ, Richmond BJ, Chu FC. Implantation of magnetic search coils for measurement of eye position: an improved method. Vision Res. 1980;20:535–538. doi: 10.1016/0042-6989(80)90128-5. [DOI] [PubMed] [Google Scholar]
- Krauzlis R, Dill N. Neural correlates of target choice for pursuit and saccades in the primate superior colliculus. Neuron. 2002;35:355–363. doi: 10.1016/s0896-6273(02)00756-0. [DOI] [PubMed] [Google Scholar]
- Krauzlis RJ. Neuronal activity in the rostral superior colliculus related to the initiation of pursuit and saccadic eye movements. J Neurosci. 2003;23:4333–4344. doi: 10.1523/JNEUROSCI.23-10-04333.2003. [DOI] [PMC free article] [PubMed] [Google Scholar]
- Krauzlis RJ. Recasting the smooth pursuit eye movement system. J Neurophysiol. 2004;91:591–603. doi: 10.1152/jn.00801.2003. [DOI] [PubMed] [Google Scholar]
- Krauzlis RJ, Miles FA. Release of fixation for pursuit and saccades in humans: evidence for shared inputs acting on different neural substrates. J Neurophysiol. 1996;76:2822–2833. doi: 10.1152/jn.1996.76.5.2822. [DOI] [PubMed] [Google Scholar]
- Krauzlis RJ, Zivotofsky AZ, Miles FA. Target selection for pursuit and saccadic eye movements in humans. J Cogn Neurosci. 1999;11:641–649. doi: 10.1162/089892999563706. [DOI] [PubMed] [Google Scholar]
- Krauzlis RJ, Basso MA, Wurtz RH. Discharge properties of neurons in the rostral superior colliculus of the monkey during smooth-pursuit eye movements. J Neurophysiol. 2000;84:876–891. doi: 10.1152/jn.2000.84.2.876. [DOI] [PubMed] [Google Scholar]
- Lee C, Rohrer WH, Sparks DL. Population coding of saccadic eye movements by neurons in the superior colliculus. Nature. 1988;332:357–360. doi: 10.1038/332357a0. [DOI] [PubMed] [Google Scholar]
- Lisberger SG. Postsaccadic enhancement of initiation of smooth pursuit eye movements in monkeys. J Neurophysiol. 1998;79:1918–1930. doi: 10.1152/jn.1998.79.4.1918. [DOI] [PubMed] [Google Scholar]
- Lisberger SG, Ferrera VP. Vector averaging for smooth pursuit eye movements initiated by two moving targets in monkeys. J Neurosci. 1997;17:7490–7502. doi: 10.1523/JNEUROSCI.17-19-07490.1997. [DOI] [PMC free article] [PubMed] [Google Scholar]
- Liston D, Krauzlis RJ. Shared response preparation for pursuit and saccadic eye movements. J Neurosci. 2003;23:11305–11314. doi: 10.1523/JNEUROSCI.23-36-11305.2003. [DOI] [PMC free article] [PubMed] [Google Scholar]
- Liston D, Krauzlis RJ. Shared decision signal explains performance and timing of pursuit and saccadic eye movements. J Vis. 2005;5:678–689. doi: 10.1167/5.9.3. [DOI] [PubMed] [Google Scholar]
- Lovejoy LP, Krauzlis RJ. Inactivation of primate superior colliculus impairs covert selection of signals for perceptual judgments. Nat Neurosci. 2010;13:261–266. doi: 10.1038/nn.2470. [DOI] [PMC free article] [PubMed] [Google Scholar]
- Ludbrook J. Multiple comparison procedures updated. Clin Exp Pharmacol Physiol. 1998;25:1032–1037. doi: 10.1111/j.1440-1681.1998.tb02179.x. [DOI] [PubMed] [Google Scholar]
- McPeek RM, Keller EL. Saccade target selection in the superior colliculus during a visual search task. J Neurophysiol. 2002;88:2019–2034. doi: 10.1152/jn.2002.88.4.2019. [DOI] [PubMed] [Google Scholar]
- McPeek RM, Keller EL. Deficits in saccade target selection after inactivation of superior colliculus. Nat Neurosci. 2004;7:757–763. doi: 10.1038/nn1269. [DOI] [PubMed] [Google Scholar]
- Munoz DP, Wurtz RH. Saccade-related activity in monkey superior colliculus I. Characteristics of burst and buildup cells. J Neurophysiol. 1995;73:2313–2333. doi: 10.1152/jn.1995.73.6.2313. [DOI] [PubMed] [Google Scholar]
- Mysore SP, Asadollahi A, Knudsen EI. Global inhibition and stimulus competition in the owl optic tectum. J Neurosci. 2010;30:1727–1738. doi: 10.1523/JNEUROSCI.3740-09.2010. [DOI] [PMC free article] [PubMed] [Google Scholar]
- Nummela SU, Krauzlis RJ. Inactivation of primate superior colliculus biases target choice for smooth pursuit, saccades, and button press responses. J Neurophysiol. 2010;104:1538–1548. doi: 10.1152/jn.00406.2010. [DOI] [PMC free article] [PubMed] [Google Scholar]
- Pelli DG. The VideoToolbox software for visual psychophysics: transforming numbers into movies. Spat Vis. 1997;10:437–442. [PubMed] [Google Scholar]
- Rashbass C. The relationship between saccadic and smooth tracking eye movements. J Physiol. 1961;159:326–338. doi: 10.1113/jphysiol.1961.sp006811. [DOI] [PMC free article] [PubMed] [Google Scholar]
- Robinson DA. Eye movements evoked by collicular stimulation in the alert monkey. Vision Res. 1972;12:1795–1808. doi: 10.1016/0042-6989(72)90070-3. [DOI] [PubMed] [Google Scholar]
- Schiller PH, Stryker M. Single-unit recording and stimulation in superior colliculus of the alert rhesus monkey. J Neurophysiol. 1972;35:915–924. doi: 10.1152/jn.1972.35.6.915. [DOI] [PubMed] [Google Scholar]
- Schoppik D, Lisberger SG. Saccades exert spatial control of motion processing for smooth pursuit eye movements. J Neurosci. 2006;26:7607–7618. doi: 10.1523/JNEUROSCI.1719-06.2006. [DOI] [PMC free article] [PubMed] [Google Scholar]
- Wurtz RH, Albano JE. Visual-motor function of the primate superior colliculus. Annu Rev Neurosci. 1980;3:189–226. doi: 10.1146/annurev.ne.03.030180.001201. [DOI] [PubMed] [Google Scholar]