

Abstract
Mathematical and computer models can provide guidance to public health officials by projecting the course of an epidemic and evaluating control measures. The authors built upon an existing collaboration between an academic research group and the Los Angeles County, California, Department of Public Health to plan for and respond to the first and subsequent years of pandemic influenza A (H1N1) circulation. The use of models allowed the authors to 1) project the timing and magnitude of the epidemic in Los Angeles County and the continental United States; 2) predict the effect of the influenza mass vaccination campaign that began in October 2009 on the spread of pandemic H1N1 in Los Angeles County and the continental United States; and 3) predict that a third wave of pandemic influenza in the winter or spring of 2010 was unlikely to occur. The close collaboration between modelers and public health officials during pandemic H1N1 spread in the fall of 2009 helped Los Angeles County officials develop a measured and appropriate response to the unfolding pandemic and establish reasonable goals for mitigation of pandemic H1N1.
Keywords: communicable disease control; influenza, human; influenza vaccines; mass vaccination
Pandemic influenza A (H1N1) emerged in Mexico in April 2009 and spread worldwide in less than a year. After causing intense but limited outbreaks, primarily among children, in the United States during the late spring of 2009, the virus caused sporadic outbreaks throughout the summer of 2009. Following the opening of US schools in the late summer of 2009 (1), the epidemic peaked in early October among children, with limited spread of the infection to adults. Vaccination began in the United States in early October 2009, and by December 2009 approximately 20% of the US population had been vaccinated with pandemic H1N1 vaccine (2). As of December 2009, an estimated 28% of the US population had been infected with pandemic influenza H1N1 (3).
In the winter of 2007, an applied research collaboration between the Center for Statistical and Quantitative Infectious Diseases at the Fred Hutchinson Cancer Research Center/University of Washington (FHCRC/UW) (Seattle, Washington) and the Los Angeles County (LA County), California, Department of Public Health (DPH) was established with the goal of planning for an influenza pandemic using mathematical modeling. At the outset, the primary aim was to develop a simulation model for the county to assist the LA County DPH in planning for the mitigation and control of an avian influenza A (H5N1) pandemic should a reassorted or mutated virus demonstrate the capacity for widespread transmission between humans (4). As in other local health jurisdictions, planning for a pandemic without clear information about the timing, severity, extent, and duration of such an event was a challenge for the LA County DPH. The use of mathematical and computer models adapted to local conditions provided the ability to conceptualize the potential spread and impact of the disease, as well as to quantify the expected effectiveness of the available mitigation strategies. The project was initially conceived as a more measured approach to planning based on the projected effects of various control measures on H5N1, rather than worst-case projections based on 1918-like scenarios. Specifically, the goal was to focus on the potential use of H5N1 vaccines, antiviral agents, and nonpharmaceutical interventions such as school closures for early mitigation of pandemic influenza spread. By January of 2009, the initial groundwork for the LA County H5N1 model had been set, and this preparation proved to be fortuitous.
When pandemic H1N1 emerged in late spring 2009, the FHCRC/UW group had already created a computer simulation model, utilizing demographic and transportation data specific to LA County. The model was capable of predicting both pandemic influenza activity and the strength of potential interventions in mitigating spread of the disease. With the emergence of pandemic H1N1, the model presented the opportunity to evaluate specific actions the department could take to slow the spread of this new strain. In close collaboration with the LA County DPH, the FHCRC/UW group immediately began to adapt the original H5N1 model to the emerging H1N1 situation and adjusted the parameters as information about the transmissibility and case fatality ratios of pandemic H1N1 became available. In this paper, we summarize the results of planning for the control of H1N1 with vaccines in LA County. Furthermore, we generalize the results in LA County, which has a population of approximately 11 million people and represents approximately 3% of the US population, to the rest of the United States. After the peak of the pandemic in the United States had passed in the fall of 2009, we also estimated the fraction of the population that needed to be protected by either vaccination or prior infection to prevent a third wave of pandemic influenza in the spring of 2010.
MATERIALS AND METHODS
Stochastic epidemic simulation model
We used a previously described epidemic simulation model (5) to estimate the timing and magnitude of the pandemic H1N1 epidemic in LA County and the United States during the 2009–2010 influenza season. Using the initial conditions and vaccine distribution described in this article and in the accompanying Web Appendix (http://aje.oxfordjournals.org/), the results presented here can be reproduced with version 1.15 of the software, available at http://www.csquid.org/software. In brief, the model generates a synthetic population to represent every person in LA County or the continental United States. For LA County simulations, the populations were based on a more recent estimate from 2007 (6) and augmented with an additional 776,000 persons to account for the estimated size of the undocumented immigrant population in the county (7). For simulations of the United States, the populations were based on US Census data from 2000 (http://www.census.gov/geo/www/cenpop/tract/tract_pop.txt). In the model, individuals interact in a variety of social mixing groups, including households, schools, workplaces, and neighborhoods. In these mixing groups, infected persons can transmit influenza to susceptible persons. Once infected, people are infected and infectious for 6 days, with infectiousness being proportional to the person's viral load; this relation is described in detail elsewhere (5). The case generation interval is 3.4 days, which is consistent with our published estimate for pandemic H1N1 (8).
We ran the analyses with a range of values of R0, the basic reproduction number, based on estimates from the previously published research (5, 9). R0 is the average number of persons a typical infected individual infects in a fully susceptible population. We report the results from simulations in which R0 = 1.3, because these were most consistent with estimated cumulative illness levels (Figure 1A and Web Table 1). We incorporated preexisting immunity from H1N1 outbreaks occurring before the fall of 2009 into the simulations by giving a fraction of the population immunity, as described in the Web Appendix (Web Table 1). We measured transmissibility, or R, in the partially immune population by infecting a single individual at the start of a simulation and counting the number of persons he or she infected. The number of secondary infections produced depends upon the age of the initial case; infected school-age children generate more cases per infection than persons in other age groups. School-age children also had the highest influenza attack rate. To account for these characteristics, the average R is approximated by weighting the age-specific R’s by the proportion of cases in each age group at the end of the season. For R0 = 1.30, we observed R to be 1.26 in the unvaccinated population.
Figure 1.
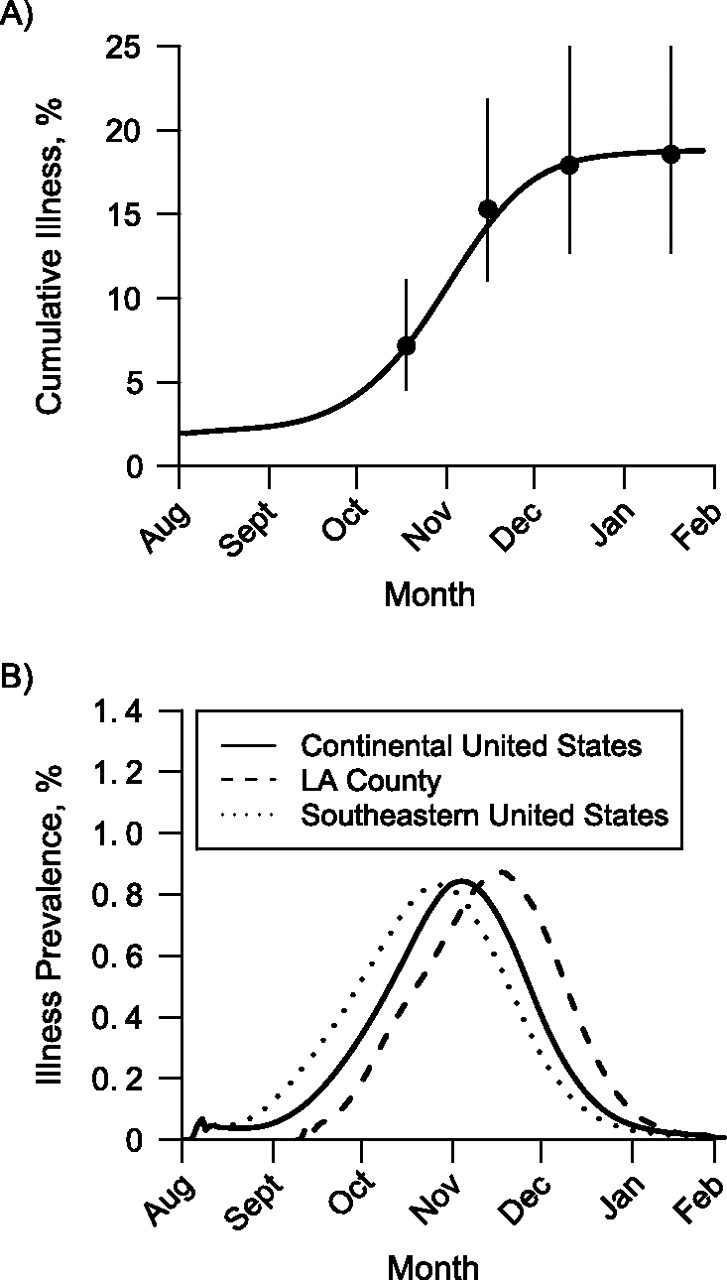
Timing of the 2009–2010 influenza A (H1N1) epidemic in the continental United States and Los Angeles (LA) County, California. A) Simulated cumulative incidence of pandemic H1N1 illness versus observed incidence for the United States. The solid black line shows the simulated cumulative illness in the continental United States. The dots show estimates of numbers of cases obtained from the Centers for Disease Control and Prevention at 4 time points, and the vertical lines show the ranges of the estimates (3). B) Timing of the simulated pandemic H1N1 epidemic for the 2009–2010 influenza season in the continental United States, LA County, and the southeastern United States. In these simulations, vaccine was distributed according to availability in the United States (11).
Simulated epidemics were seeded with infected persons to represent the widespread prevalence of pandemic H1N1 before the usual influenza season. An estimated 3 million persons were infected in the United States during the 6-week period between late July and early September (see Web Appendix and Web Table 1), implying that approximately 71,000 persons were infected each day. Because influenza has a 6-day infectious period in our model, we seeded the simulation of the continental United States with 3 times this figure, or 213,000 persons, which is less than 0.1% of the population. Assuming that LA County had the same proportion of infected persons, simulations of LA County were initialized with 7,700 infected persons.
In the simulations, vaccines reduce susceptibility to infection, infectiousness, and progression to disease (10), as described in the Web Appendix (Web Table 2 and Web Figure 1). In addition, we incorporated the lower vaccine efficacy observed in the elderly by setting vaccine efficacy in the elderly to 60% of the maximum efficacy in the rest of the population. The model includes 9 different vaccine formulations produced by 5 manufacturers (Web Table 1). Some of these vaccines are licensed for use in specific subpopulations, which we included in the model. Vaccines were distributed to the population daily on the basis of Centers for Disease Control and Prevention (CDC) projections of vaccine availability (11). Additional details on vaccine delivery schedules, hospitalizations, deaths, and risk prioritization are presented in the Web Appendix (Web Table 3–Web Table 7).
Vaccine was distributed pro rata, so LA County received an amount proportional to its population relative to the population of the United States. Available vaccine in the simulations was prioritized to go to the essential workforce, pregnant women, persons who lived with infants, and high-risk persons under 65 years of age, followed by healthy children and then the remaining healthy adults. To reflect the limitations of the vaccine supply and variations in vaccine uptake, 50% of the target groups are reached, while the remaining 50% never receive vaccine. If possible, vaccine is given to persons with the highest priority before those with lower priority. For example, a pediatric vaccine will always go to children, even if there are unvaccinated higher-priority adults, while a vaccine licensed for adults will go to the highest-priority adults.
The numbers of simulated cases, hospitalizations, and deaths in the United States were scaled to the 2009 US population by multiplying the simulated child and adult attack rates by the numbers of children and adults in the United States in 2009 (12). Ranges were computed to match the uncertainty of the CDC estimates (3)—from 71.1% to 146.8% of the point estimates. The range covers 90% of the estimates of the numbers of cases and deaths generated from the CDC's Monte Carlo procedure (3).
Evidence suggests that school-age children play a significant role in influenza transmission (1, 13). In our simulations of the continental United States, schools were opened at the appropriate times for each state, as reported by Chao et al. (1). Before schools were open, overall transmission was relatively low. Once schools opened, influenza spread rapidly. In LA County, most public schools started classes on September 9, 2009, and this is the date on which all schools in our simulations of LA County opened.
Estimating numbers of H1N1 infections and vaccinations in the United States
We estimated the numbers of persons in 2 age categories in the United States who were vaccinated by January 2010 as follows. Approximately 61 million persons were vaccinated, including 29.4% of those between ages 6 months and 18 years (2). Given that 78,497,473 persons in the United States are 18 years of age or younger and that 228,305,545 are older than 18 years (12), 37,921,742 adults (or 16.6%) were vaccinated. The CDC estimated that there were 57 million symptomatic cases of pandemic H1N1 in the United States by January 2010 (3). If one assumes that only 67% of those infected became symptomatic, as is believed for seasonal influenza (14, 15), an estimated 85 million persons were infected. We converted the case estimates from the CDC publication (3) into numbers of infections using this method. We estimated the age-specific infection attack rates using pandemic H1N1 seroprevalence data from an article by Zimmer et al. (16). To convert the age-specific estimates of seroprevalence in the Zimmer et al. article (16) to the age groups we used (children and adults), we assumed that within each age group the number of persons of each age was proportional to the national average (12). We then computed the estimates of seroprevalence in children and adults as weighted averages. To estimate the total number of persons protected by either vaccination or natural infection, we assumed that vaccination and infection are independent, so that the fraction protected is the sum of the fraction protected by vaccination and the fraction infected minus the product of these 2 fractions. This allowed us to estimate ranges for the current level of combined immunity (that is, naturally acquired immunity and vaccine-induced immunity). The mean of this estimate was found to be a combined immunity of 54% of the children and 37% of the adults.
Critical immune and vaccination thresholds
In a population containing both children and adults, we aimed to determine what percentage of each subgroup would need to be vaccinated with a vaccine with specific characteristics to eliminate an infectious disease from the entire population. The critical vaccination thresholds are the percentages of each of the subpopulations that must be vaccinated such that no significant transmission can subsequently occur. Similarly, we define the critical immune thresholds as the percentages of each subgroup that must be completely immune for no significant transmission to occur in the overall population. For vaccines that do not provide complete protection, such as influenza vaccines, the critical vaccination thresholds will always be greater than the critical immune thresholds for any given subgroup.
We developed a 2-age-group deterministic mathematical model to investigate the possibility of a third wave of pandemic H1N1 occurring in the United States. We calibrated the model to the pandemic H1N1 illness attack rate data and parameters (17). Then, using the methods developed by Diekmann et al. (18) and van den Driessche and Watmough (19), we computed the effective reproduction number, Rf (defined as the expected number of cases that a typical infectious person will produce during his or her entire infectious period in the presence of vaccination or previous immunity in the population) as a function of the number of children vaccinated, f1, and the number of adults vaccinated, f2 (20). We set Rf = 1 as a threshold condition for the epidemic to take off. If Rf > 1, the epidemic will take off; if Rf < 1, the epidemic will die out. This allowed us to find the critical vaccination curves and the critical immune curve by calculating all the values of f1 and f2 for which Rf = 1. A detailed description of our method and model can be found elsewhere (17).
RESULTS
Our first objective was to predict the timing and magnitude of the pandemic H1N1 peak in LA County and the United States. By May of 2009, the FHCRC/UW group produced an initial range of estimates for R0 between 1.3 and 1.7 (8) and assumed that the natural history of infection would be similar to that of seasonal influenza, which was later confirmed (21). Using these 2 assumptions, the FHCRC/UW group used its computer simulation model to produce epidemic curves for LA County and the United States. As the pandemic progressed, we found that these early assumptions were correct, and the simulations of pandemic H1N1 in the continental United States produced incidence curves of cases consistent with national estimates from the CDC (3) when R0 was set to 1.3 (Figure 1A). The simulated epidemics in LA County peaked in mid-November, which agrees with the observed data on influenza-like illness provided by the LA County DPH (22). Simulated epidemics in LA County peaked later than in the continental United States as a whole (Figure 1B) because public schools opened later in LA County. In regions with early public school opening dates, such as the southeastern United States (e.g., Alabama, Florida, Georgia, Louisiana, and Mississippi), the simulated illness prevalence peaked earlier, as was observed in the fall of 2009 in the United States (1). We assumed that the age-specific attack rates would be similar to those of previous influenza pandemics—that is, that school-age children would have the highest attack rates and the elderly the lowest (5). Later, we found that our simulated age-specific infection attack rates were somewhat higher but consistent with a recent study of pandemic H1N1 antibody seroprevalence (Table 1) (16). As Zimmer et al. (16) noted, the estimates of final infection attack rate based on seroprevalence are likely to be low because samples were taken soon after the epidemic peak, not at the end of the epidemic. Our model calibration to the observed influenza rates is robust to choices for the initial number of people infected (Web Figure 2).
Table 1.
Observed and Simulated Age-Specific Fractions (%) Infected With Pandemic Influenza A (H1N1) in Pittsburgh, Pennsylvania; Los Angeles County, California; and the continental United States, 2009
| Age Group, years | Observed Seroprevalencea | Simulated Seroprevalence |
|
| Los Angeles County | Continental United States | ||
| 0–4 | 28 | 21 | 22 |
| 5–18 | 39 | 44 | 45 |
| 19–29 | 22 | 16 | 18 |
| 30–64 | 18 | 18 | 20 |
| ≥65 | 13 | 14 | 16 |
| Total | 22 | 23 | 25 |
Data were from samples taken from hospitals and clinics in Pittsburgh, Pennsylvania, from mid-November to early December 2009 (16).
During the initial H1N1 response phase of April 2009, amidst much national and local discussion surrounding the effectiveness of closing schools in response to the outbreak, we used the model to predict the benefit of such closures in LA County. The model results indicated that short-term, system-wide school closures would delay but not reduce the epidemic peak (see Web Figure 3). Simulations of a more realistic strategy in which schools were briefly closed when infected students were detected in them did not elicit any substantive decrease in either age-specific or aggregate community illness attack rates. This information provided an analytical basis, which, together with the jurisdictional and operational realities of school closures, influenced the decision of LA County DPH officials to not recommend or enforce school closures in response to pandemic H1N1. Longer school closures could have delayed the peak sufficiently for mass vaccination to be more effective, but this option was not likely to be economically feasible and was therefore not considered as a viable intervention.
The type, quantity, and schedule of vaccine availability became the single most important mitigation strategy issue during the fall 2009 response. The FHCRC/UW group utilized the simulation model to assist the LA County DPH in aligning ongoing operational plans with the unfolding realities of vaccine delays. When we discovered that sufficient amounts of vaccine would not be available until near the epidemic peak, the FHCRC/UW group changed its recommendation from vaccinating children to reduce the overall influenza attack rates (8) to protecting persons at high risk of complications from influenza illness. The effect of vaccination in the simulations is summarized in Table 2 and shown in Web Movie 1. Without vaccination, the United States and LA County could have had estimated illness attack rates of 21.4% and 21.5%, respectively. The mass vaccination beginning in October of 2009 reduced the attack rates to 18.5%. When simulated mass vaccination began exactly 1 month earlier, the illness attack rates were reduced to 14.0% and 13.5%, as shown in Web Movie 2. Mass vaccination reduced the magnitude of the illness prevalence peak but did not greatly affect the timing of the peak (Figure 2).
Table 2.
Simulated Pandemic Influenza A (H1N1) Illness Attack Rates and Numbers of Cases, Hospitalizations, and Deaths for Los Angeles County and the Continental United States in 3 Scenariosa
| Measure and Scenario | Los Angeles Countyb |
Continental United Statesc |
||||||||||||||||
| Childrend |
Adultsd |
Total |
Children |
Adults |
Total |
|||||||||||||
| % | Mean | Range | % | Mean | Range | % | Mean | Range | % | Mean | Range | % | Mean | Range | % | Mean | Range | |
| Illness attack rate | ||||||||||||||||||
| No vaccination | 36.2 | 15.4 | 21.4 | 35.6 | 15.8 | 21.5 | ||||||||||||
| Vaccination | 32.2 | 13.0 | 18.5 | 31.1 | 13.4 | 18.5 | ||||||||||||
| Early vaccination | 23.9 | 9.4 | 13.5 | 23.8 | 10.0 | 14.0 | ||||||||||||
| No. of cases | ||||||||||||||||||
| No vaccination | 1.15M | 0.82M–1.69M | 1.22M | 0.87M–1.79M | 2.37M | 1.69M–3.48M | 27.9M | 19.9M–41.0M | 36.0M | 25.6M–52.8M | 63.9M | 45.5M–93.8M | ||||||
| Vaccination | 1.02M | 0.73M–1.50M | 1.03M | 0.73M–1.51M | 2.05M | 1.46M–3.02M | 24.4M | 17.4M–35.8M | 30.7M | 21.8M–45.1M | 55.1M | 39.2M–80.9M | ||||||
| Early vaccination | 0.76M | 0.54M–1.12M | 0.74M | 0.53M–1.09M | 1.50M | 1.07M–2.21M | 18.7M | 13.3M–27.4M | 22.8M | 16.2M–33.5M | 41.5M | 29.5M–60.9M | ||||||
| CDC estimatese | 19.5M | 13.9M–28.6M | 41.3M | 29.4M–60.7M | 60.8M | 43.3M–89.3M | ||||||||||||
| No. of deaths | ||||||||||||||||||
| No vaccination | 68 | 48–100 | 338 | 240–496 | 406 | 289–596 | 1,790 | 1,270–2,630 | 10,200 | 7,260–15,000 | 12,000 | 8,540–17,600 | ||||||
| Vaccination | 56 | 40–82 | 266 | 189–391 | 322 | 229–473 | 1,540 | 1,090–2,260 | 8,610 | 6,120–12,600 | 10,100 | 7,220–14,900 | ||||||
| Early vaccination | 38 | 27–56 | 177 | 126–260 | 215 | 153–316 | 1,160 | 821–1,700 | 6,280 | 4,460–9,210 | 7,430 | 5,280–10,900 | ||||||
| CDC estimates | 1,280 | 912–1,880 | 11,200 | 7,960–16,400 | 12,500 | 8,870–18,300 | ||||||||||||
| No. of hospitalizations | ||||||||||||||||||
| No vaccination | 4,690 | 3,340–6,890 | 5,640 | 4,010–8,280 | 10,300 | 7,350–15,200 | 0.12M | 0.09M–0.18M | 0.17M | 0.12M–0.25M | 0.29M | 0.21M–0.43M | ||||||
| Vaccination | 3,810 | 2,710–5,600 | 4,450 | 3,170–6,540 | 8,270 | 5,880–12,100 | 0.11M | 0.07M–0.15M | 0.14M | 0.10M–0.21M | 0.25M | 0.18M–0.37M | ||||||
| Early vaccination | 2,630 | 1,870–3,870 | 2,970 | 2,110–4,350 | 5,600 | 3,980–8,220 | 0.08M | 0.06M–0.12M | 0.11M | 0.07M–0.15M | 0.18M | 0.13M–0.27M | ||||||
| CDC estimates | 0.09M | 0.06M–0.13M | 0.19M | 0.13M–0.28M | 0.27M | 0.20M–0.40M | ||||||||||||
Abbreviations: CDC, Centers for Disease Control and Prevention; M, million.
The 3 scenarios were: baseline (no vaccination), vaccination (vaccination begins in early October), and early vaccination (vaccination begins in early September).
Results for Los Angeles County are averages from 5 runs.
Results for the United States are from a single stochastic run from simulations based on the 2000 US Census (http://www.census.gov/geo/www/cenpop/tract/tract_pop.txt), adjusted to the 2009 US population.
Children were defined as persons aged 18 years or younger, while adults were those aged 19 years or older.
Estimates for the United States were obtained from the CDC (3).
Figure 2.
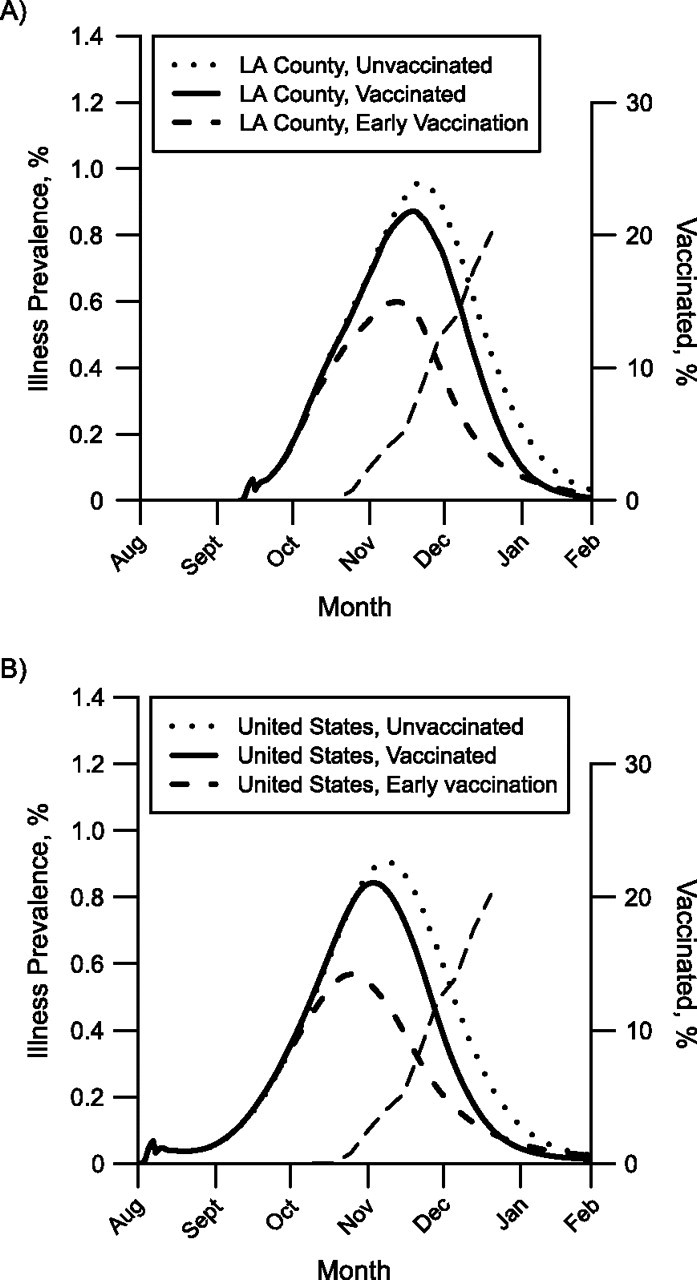
Simulated effect of the 2009 mass vaccination campaign against pandemic influenza A (H1N1) on illness prevalence in A) Los Angeles (LA) County, California, and B) the continental United States. Each curve plots the simulated prevalence of pandemic H1N1 from a single stochastic simulation. The solid curves show simulated illness prevalence when vaccination begins on October 9. The dotted curves show simulated illness prevalence when there is no vaccination. The dashed curves show simulated prevalence when vaccination begins 1 month earlier (September 9). The thin dashed curves running diagonally upwards show the fraction of the population vaccinated, assuming 1 dose per person.
Early estimates of case fatality for pandemic H1N1 based on the spring 2009 outbreaks in Mexico were 0.4% (9), or approximately 20 times more lethal than seasonal influenza, and our initial projections were dire. As pandemic H1N1 began to spread in the United States, the case fatality estimates from the CDC fell to 0.02% (see the version of reference 3 published in November 2009), and the FHCRC/UW group adjusted its projections. Using simulations, we now estimate that approximately 10,000 persons died because of influenza in the continental United States (and 300 in LA County) during the first year of pandemic H1N1 (Table 2). Our estimates of the numbers of cases, hospitalizations, and deaths are consistent with those produced by the CDC (Table 2). Our initial estimates of the timing and number of hospitalizations were especially important in helping the LA County DPH determine that LA County's hospital capacity was sufficient to manage the peak. Nationally, the mass vaccination campaign may have saved 1,900 lives and prevented 44,000 H1N1-related hospitalizations. Had vaccination started 1 month earlier, in September 2009, an estimated 4,600 influenza deaths and 109,000 hospitalizations could have been prevented by vaccination.
By the end of fall 2009, a large fraction of the population was protected from pandemic H1N1 by either vaccination or naturally acquired immunity following infection. Given that previous pandemics have all had multiple epidemic waves (23, 24), the natural question was whether this mixture of immunities would be enough to prevent a third wave of transmission in the population, should the external conditions (such as humidity or temperature (25–28) or the reopening of schools) become suitable for a third wave of transmission. Let Rn be the reproduction number for pandemic influenza after the second wave, say in January 2010, where we are assuming that the external conditions have changed, allowing the possibility of a new epidemic wave. Using a deterministic mathematical model, we determined what fraction of children and adults would need to be immune to influenza in order to prevent a third wave of transmission in the population.
Figure 3 shows the critical immune and vaccination threshold curves for 4 different values of Rn. The lower curve in each graph represents the threshold for the naturally induced immunity, and the upper curve shows the vaccine-induced partial immunity.
Figure 3.

Critical percentage of natural or vaccine-induced immunity needed to prevent an epidemic of influenza A (H1N1). The region between the 2 curves indicates the amount of preexisting immunity required to prevent an epidemic for A) Rn = 1.2, B) Rn = 1.4, C) Rn = 1.6, and D) Rn = 1.8. The upper bound of each region (solid line) is the amount of immunity required from vaccination alone, while the lower bound (dashed line) is the amount required from prior infection alone. The dotted rectangle indicates the range of the estimated level of immunity to pandemic H1N1 from infection or vaccination in the United States at the beginning of 2010.
In the best-case scenario, if vaccines were fully protective, these 2 curves would overlap. Because influenza vaccines do not provide perfect protection against infection (Web Table 2), the critical vaccination curve will always be higher than the critical immune curve. For each Rn (indicated in the figure), this establishes a lower and upper bound for the threshold for a combined immunity, indicated in the figure by the area between the curves.
For a particular value of Rn, the area above the immunity threshold curve (vaccination threshold curve) represents the naturally acquired immune (vaccination) coverages for which there would be no substantial transmission, while the area below the curve represents coverages for which substantial transmission would occur. For example, if Rn were 1.4, then once 30% or more of children and 21% or more of adults were infected and immune, further transmission would not occur. Transmission would also be halted if 33% or more of children and 9% or more of adults had been infected and had acquired natural immunity. In contrast, for the same value of Rn, with vaccination alone, 44% or more children and 9% or more adults would have to be vaccinated to prevent the third wave.
Because the US and LA County populations currently have mixtures of naturally immune and vaccinated people, any combinations of natural infection and vaccination in the region between or above the curves would result in no transmission. If the original Rn were higher, higher levels of natural infection and/or vaccination coverage would be needed to assure no further transmission of pandemic H1N1. The dotted rectangles in Figure 3 represent the estimated numbers of children and adults protected by either vaccination or previous infection by pandemic H1N1 in the United States (Table 3). Most of the estimates for the original basic reproduction number for pandemic H1N1 were in the range of 1.3–1.4 (9, 29–33). Intuitively, Rn is less than or equal to R0, so Rn should also be in this range. The box depicting the estimates for immune children and adults lies above both curves when Rn equals 1.4, indicating that further substantial transmission of pandemic H1N1 in the United States is unlikely in the absence of the circulation of a drifted version of the pandemic H1N1 virus.
Table 3.
Estimates of the Numbers and Percentages of the US Population Vaccinated Against or Infected by Pandemic Influenza A (H1N1), 2009–2010
The critical vaccination and immunity curves provided a clear contextualization and quantification of the LA County DPH's mass vaccination operational goals and objectives. While a focused campaign was employed to reach the priority groups identified by the Advisory Committee on Immunization Practices, LA County DPH vaccine and emergency planners were able to adjust ongoing operational plans and procedures—particularly after the Advisory Committee on Immunization Practices priority group restrictions were relaxed—to ensure maximum uptake throughout LA County, thus providing individual protection to vaccine recipients as well as mitigating against a future third wave of pandemic H1N1 occurring in the county.
DISCUSSION
The use of epidemic simulation models to influence and direct local health department planning and operational response represents an important collaboration between research and public health practice. As evidenced in the utilization and adaptation of our pandemic influenza simulations by the LA County DPH during the pandemic H1N1 response, realistic and effective models allow local public health planners to use simulations to evaluate various disease control strategies and to better understand and respond to infectious disease events. Based on community demographic data and transportation patterns, the models provide local emergency health planners with a unique tool both to quantify the emerging threat (morbidity, hospitalizations, mortality, etc.) and to predict the effects and benefits of proposed pharmaceutical and nonpharmaceutical interventions. We had initially planned for a devastating H5N1 pandemic, and as the FHCRC/UW group quickly adapted the model to pandemic H1N1, we projected a manageable scenario that did not require the disruption of schools or hospitals. The mild pandemic forecasts afforded the LA County DPH the opportunity to allocate scarce public health resources more wisely. Community-based simulation models provide an analytical set of tools, further enabling local health officials to evaluate proposed strategies and make informed decisions. They also provide a starting point from which other local jurisdictions can evaluate and determine their best intervention and response strategies as well.
We believe that our simulation-based approach to influenza pandemic guidance in LA County is general enough to apply to much of the United States. Our simulations of pandemic H1N1 in LA County and the continental United States produced similar results. Simulations for both LA County and the United States featured unmitigated illness attack rates of approximately 21.5%. Simulations showed that mass vaccination was slightly more effective in LA County, possibly because schools (and therefore the epidemic) may have started later there than elsewhere in the United States. US regions with epidemics that started later would have had more time to vaccinate their populations before the epidemic peak in the fall of 2009.
There are 2 fundamental limitations to the use of simulation models in public health practice: the ability of the model to reflect the reality of the situation and the quality of the data used to parameterize the model. Our model contained sufficient detail to address the issues that concerned us, such as the timing of the epidemic peak, the numbers of deaths and hospitalizations, and the effect of mass vaccination, but insufficient detail to reproduce the exact shape of the epidemic curve. Although incorporating more sociologic data would allow the simulation to produce more realistic epidemic curves, the actual accuracy of predictions might not be improved because of the stochastic nature of transmission. Regardless of what modeling approach is chosen, timely and high-quality input data are required in order to obtain useful results.
The most important task at the beginning of an outbreak of a novel virus is to quickly estimate its virulence and transmissibility. For the first few months of the pandemic H1N1 outbreak, the data required to make these estimates were scarce, and we had to infer transmissibility from a handful of households described in the media (8). By making early outbreak and/or household case data available as soon as possible, public health officials can help statisticians and modelers make these estimates, which in turn leads to more precise modeling forecasts for decision-makers. Fortunately, pandemic H1N1 behaved much like seasonal influenza (21), and many of our initial assumptions were later borne out. Influenza pandemics may have common features that we can anticipate (34). Thus, our planning for H5N1 gave us the tools we needed to guide us through the H1N1 pandemic and future influenza pandemics as well. The close collaboration between the modeling group and the LA County DPH was essential, both to ensure that the model incorporated up-to-date data from the public health department and to ensure that the public health department was informed of continually refined model results. The other major assumption we had to make was about the availability and efficacy of vaccines. Vaccination was the primary component of our pandemic response plan, and we had expended an enormous amount of effort exploring different distribution strategies to reduce morbidity and mortality. However, vaccine arrived later than we had expected, and our original vaccination strategies could not be used.
We have shown that the pandemic H1N1 vaccine arrived too late to significantly mitigate the second wave of the H1N1 epidemic in LA County and the United States. The H1N1 epidemic peaked in the United States in early October 2009, and during the same period, vaccination with limited supplies of vaccine began. As a result, most vaccine was delivered and administered well after the peak of the epidemic. When vaccinating after the peak, vaccination of children has a minimal effect on protecting others and reducing general morbidity in the population. Had vaccine been delivered starting in September 2009, as originally planned, our estimates suggest that an additional 2,700 deaths and 65,000 hospitalizations nationwide could have been averted (Table 2). However, we have shown that sustained vaccination after the peak of an epidemic can still reduce the number of influenza-related deaths and hospitalizations, and thus should remain a priority in the absence of the availability of a sufficient vaccine supply prior to the peak.
Pandemic H1N1 is expected to become the predominant circulating strain of influenza A virus in subsequent years. During the 2009–2010 influenza season, seasonal influenza A (H1N1) and influenza A (H3N2) were replaced by pandemic H1N1 wherever the latter has caused substantial spread (35). On the basis of reported numbers of cases and vaccinations combined with our fitted model, we estimate that approximately 40% of the population of LA County and the entire United States was immune to pandemic H1N1 by the end of the 2009–2010 season. Given the level of protection due to immunity from natural infection and vaccination at the end of 2009, we predicated that a substantial third wave of pandemic H1N1 would not occur in the United States unless antigenic drift or shift occurred.
Although the pandemic H1N1 epidemic was relatively mild during the 2009–2010 influenza season, the number of pediatric influenza deaths for the 2009–2010 influenza season was almost twice that for the 2008–2009 season and 3 times the number for the 2006–2007 and 2007–2008 seasons (http://www.cdc.gov/flu/weekly/). Many of these deaths—about 2,700 in the United States, overall, according to our simulations—were potentially avoidable with earlier delivery of the vaccine.
Past pandemic experience suggests that influenza morbidity and mortality could remain higher than normal for 1 or 2 influenza seasons following the introduction of a new pandemic strain and that influenza-related mortality may shift from younger persons to older persons during that time (36). For the 2010–2011 influenza season in the United States, pandemic influenza A (H1N1), seasonal influenza A (H3N2), and influenza B are co-circulating in approximately equal proportions (http://www.cdc.gov/flu/weekly/). On February 18, 2010, the World Health Organization influenza collaborating centers and national regulatory authorities recommended adding pandemic H1N1 to the seasonal influenza vaccine for the Northern Hemisphere's fall 2010 season (37). The influenza vaccine for the 2010–2011 influenza season in the United States contains the above 3 antigens, and the match between the vaccine strains and wild circulating strains appears to be adequate. Prior to the fall of 2009, seasonal influenza rarely peaked before January, with the exception of the 2003–2004 influenza season, where the epidemic peaked in mid-December. This year, the peak appears to be occurring around mid-February, as is usual for seasonal influenza. Nonetheless, it would be important to begin mass vaccination of schoolchildren and those at high risk of complications from influenza infection before school opens every year. Careful modeling of anticipated transmission and vaccine distribution, as presented here, can help in planning the effective control of seasonal influenza as well as future pandemic influenza.
Supplementary Material
Acknowledgments
Author affiliations: Center for Statistics and Quantitative Infectious Diseases, Vaccine and Infectious Disease Division, Fred Hutchinson Cancer Research Center, Seattle, Washington (Dennis L. Chao, Laura Matrajt, Nicole E. Basta, Jonathan D. Sugimoto, M. Elizabeth Halloran, Ira M. Longini, Jr.); Department of Applied Mathematics, University of Washington, Seattle, Washington (Laura Matrajt); Department of Epidemiology, School of Public Health, University of Washington, Seattle, Washington (Nicole E. Basta, Jonathan D. Sugimoto); Emergency Preparedness and Response Program, Los Angeles County Department of Public Health, Los Angeles, California (Brandon Dean, Dee Ann Bagwell); Acute Communicable Disease Control Program, Los Angeles County Department of Public Health, Los Angeles, California (Brit Oiulfstad); and Department of Biostatistics, School of Public Health, University of Washington, Seattle, Washington (M. Elizabeth Halloran, Ira M. Longini, Jr.).
This work was partially supported by National Institute of General Medical Sciences MIDAS grant U01-GM070749 and the Los Angeles County Department of Public Health.
The authors thank Jonathan Freedman, Dr. Laurene Mascola, Dr. Jonathan Fielding, Dr. Bessie Hwang, and Dr. Alonzo Plough of the Los Angeles County Department of Public Health for their assistance and support. The authors also thank the staff of the Acute Communicable Disease Control Program's Automated Disease Surveillance Section, Epidemiology and Surveillance Unit, for supplying the influenza-like illness data for Los Angeles County.
Conflict of interest: none declared.
Glossary
Abbreviations
- CDC
Centers for Disease Control and Prevention
- DPH
Department of Public Health
- FHCRC/UW
Fred Hutchinson Cancer Research Center/University of Washington
- LA County
Los Angeles County
References
- 1.Chao DL, Halloran ME, Longini IM., Jr School opening dates predict pandemic influenza A(H1N1) outbreaks in the United States. J Infect Dis. 2010;202(6):877–880. doi: 10.1086/655810. [DOI] [PMC free article] [PubMed] [Google Scholar]
- 2.Interim results. influenza A (H1N1) 2009 monovalent vaccination coverage—United States, October–December 2009. MMWR Morb Mortal Wkly Rep. 2010;59(2):44–48. [PubMed] [Google Scholar]
- 3.Centers for Disease Control and Prevention. Atlanta, GA: Centers for Disease Control and Prevention; 2010. Updated CDC Estimates of 2009 H1N1 Influenza Cases, Hospitalizations and Deaths in the United States, April 2009–April 10, 2010. ( http://www.cdc.gov/h1n1flu/estimates_2009_h1n1.htm). (Accessed June 7, 2010) [Google Scholar]
- 4.Yang Y, Halloran ME, Sugimoto JD, et al. Detecting human-to-human transmission of avian influenza A (H5N1) Emerg Infect Dis. 2007;13(9):1348–1353. doi: 10.3201/eid1309.07-0111. [DOI] [PMC free article] [PubMed] [Google Scholar]
- 5.Chao DL, Halloran ME, Obenchain VJ, et al. FluTE, a publicly available stochastic influenza epidemic simulation model. PLoS Comput Biol. 2010;6(1):e1000656. doi: 10.1371/journal.pcbi.1000656. (doi: 10.1371/journal.pcbi.1000656) [DOI] [PMC free article] [PubMed] [Google Scholar]
- 6.Walter R McDonald Associates, Inc. July 1, 2007. Population Estimates. (Report prepared by Walter R McDonald & Associates, Inc (WRMA) for Urban Research, Los Angeles County CAO, 2007) Los Angeles, CA: Walter R McDonald & Associates, Inc; 2008. [Google Scholar]
- 7.Flaming D, Haydamack B, Joassart P. Hopeful Workers, Marginal Jobs: LA's Off-The-Books Labor Force. Los Angeles, CA: Economic Roundtable; 2005. [Google Scholar]
- 8.Yang Y, Sugimoto JD, Halloran ME, et al. The transmissibility and control of pandemic influenza A (H1N1) virus. Science. 2009;326(5953):729–733. doi: 10.1126/science.1177373. [DOI] [PMC free article] [PubMed] [Google Scholar]
- 9.Fraser C, Donnelly CA, Cauchemez S, et al. Pandemic potential of a strain of influenza A (H1N1): early findings. Science. 2009;324(5934):1557–1561. doi: 10.1126/science.1176062. [DOI] [PMC free article] [PubMed] [Google Scholar]
- 10.Halloran ME, Longini IM, Jr, Struchiner CJ. Design and interpretation of vaccine field studies. Epidemiol Rev. 1999;21(1):73–88. doi: 10.1093/oxfordjournals.epirev.a017990. [DOI] [PubMed] [Google Scholar]
- 11.Centers for Disease Control and Prevention. Estimated Availability of H1N1 Vaccine for Ordering by States and Territories. Atlanta, GA: Centers for Disease Control and Prevention; 2009. [Google Scholar]
- 12.Bureau of the Census . US Department of Commerce. U.S. Population by Age, Sex, Race, and Hispanic Origin. Washington, DC: US Census Bureau; 2009. ( http://www.census.gov/popest/national/asrh/files/NC-EST2008-ALLDATA-R-File22.csv). (Accessed November 6, 2009) [Google Scholar]
- 13.Monto AS, Koopman JS, Longini IM., Jr Tecumseh study of illness. XIII. Influenza infection and disease, 1976–1981. Am J Epidemiol. 1985;121(6):811–822. doi: 10.1093/oxfordjournals.aje.a114052. [DOI] [PubMed] [Google Scholar]
- 14.Halloran ME, Hayden FG, Yang Y, et al. Antiviral effects on influenza viral transmission and pathogenicity: observations from household-based trials. Am J Epidemiol. 2007;165(2):212–221. doi: 10.1093/aje/kwj362. [DOI] [PubMed] [Google Scholar]
- 15.Carrat F, Vergu E, Ferguson NM, et al. Time lines of infection and disease in human influenza: a review of volunteer challenge studies. Am J Epidemiol. 2008;167(7):775–785. doi: 10.1093/aje/kwm375. [DOI] [PubMed] [Google Scholar]
- 16.Zimmer SM, Crevar CJ, Carter DM, et al. Seroprevalence following the second wave of pandemic 2009 H1N1 influenza in Pittsburgh, PA, USA. PLoS One. 2010;5(7):e11601. doi: 10.1371/journal.pone.0011601. (doi: 10.1371/journal.pone.0011601) [DOI] [PMC free article] [PubMed] [Google Scholar]
- 17.Matrajt L, Longini IM., Jr . Seattle, WA: University of Washington; 2010. Critical Immune and Vaccination Thresholds in Heterogeneous Populations. (University of Washington Biostatistics Working Paper Series, Working Paper 360) [Google Scholar]
- 18.Diekmann O, Heesterbeek JA, Metz JA. On the definition and the computation of the basic reproduction ratio R0 in models for infectious diseases in heterogeneous populations. J Math Biol. 1990;28(4):365–382. doi: 10.1007/BF00178324. [DOI] [PubMed] [Google Scholar]
- 19.van den Driessche P, Watmough J. Reproduction numbers and sub-threshold endemic equilibria for compartmental models of disease transmission. Math Biosci. 2002;180(suppl):S29–S48. doi: 10.1016/s0025-5564(02)00108-6. [DOI] [PubMed] [Google Scholar]
- 20.Hill AN, Longini IM., Jr The critical vaccination fraction for heterogeneous epidemic models. Math Biosci. 2003;181(1):85–106. doi: 10.1016/s0025-5564(02)00129-3. [DOI] [PubMed] [Google Scholar]
- 21.Cowling BJ, Chan KH, Fang VJ, et al. Comparative epidemiology of pandemic and seasonal influenza A in households. N Engl J Med. 2010;362(23):2175–2184. doi: 10.1056/NEJMoa0911530. [DOI] [PMC free article] [PubMed] [Google Scholar]
- 22.Acute Communicable Disease Control Program. vol 4, no. 18. Los Angeles, CA: Los Angeles County Department of Public Health; 2010. Los Angeles County Department of Public Health. Influenza Watch Los Angeles County [newsletter] [Google Scholar]
- 23.Barry JM, Viboud C, Simonsen L. Cross-protection between successive waves of the 1918–1919 influenza pandemic: epidemiological evidence from US Army camps and from Britain. J Infect Dis. 2008;198(10):1427–1434. doi: 10.1086/592454. [DOI] [PMC free article] [PubMed] [Google Scholar]
- 24.Olson DR, Simonsen L, Edelson PJ, et al. Epidemiological evidence of an early wave of the 1918 influenza pandemic in New York City. Proc Natl Acad Sci U S A. 2005;102(31):11059–11063. doi: 10.1073/pnas.0408290102. [DOI] [PMC free article] [PubMed] [Google Scholar]
- 25.Lowen AC, Mubareka S, Steel J, et al. Influenza virus transmission is dependent on relative humidity and temperature. PLoS Pathog. 2007;3(10):1470–1476. doi: 10.1371/journal.ppat.0030151. [DOI] [PMC free article] [PubMed] [Google Scholar]
- 26.Schaffer FL, Soergel ME, Straube DC. Survival of airborne influenza virus: effects of propagating host, relative humidity, and composition of spray fluids. Arch Virol. 1976;51(4):263–273. doi: 10.1007/BF01317930. [DOI] [PubMed] [Google Scholar]
- 27.Shaman J, Pitzer VE, Viboud C, et al. Absolute humidity and the seasonal onset of influenza in the continental United States. PLoS Biol. 2010;8(2):e1000316. doi: 10.1371/journal.pbio.1000316. (doi: 10.1371/journal.pbio.1000316) [DOI] [PMC free article] [PubMed] [Google Scholar]
- 28.Soebiyanto RP, Adimi F, Kiang RK. Modeling and predicting seasonal influenza transmission in warm regions using climatological parameters. PLoS One. 2010;5(3):e9450. doi: 10.1371/journal.pone.0009450. (doi: 10.1371/journal.pone.0009450) [DOI] [PMC free article] [PubMed] [Google Scholar]
- 29.Bacaër N, Ait Dads EH. Genealogy with seasonality, the basic reproduction number, and the influenza pandemic [published online ahead of print July 6, 2010] J Math Biol. doi: 10.1007/s00285-010-0354-8. (doi: 10.1007/s00285-010-0354-8) [DOI] [PubMed] [Google Scholar]
- 30.Munayco CV, Gomez J, Laguna-Torres VA, et al. Epidemiological and transmissibility analysis of influenza A(H1N1)v in a Southern Hemisphere setting: Peru. Euro Surveill. 2009;14(32):19299. [PubMed] [Google Scholar]
- 31.Pourbohloul B, Ahued A, Davoudi B, et al. Initial human transmission dynamics of the pandemic (H1N1) 2009 virus in North America. Influenza Other Respi Viruses. 2009;3(5):215–222. doi: 10.1111/j.1750-2659.2009.00100.x. [DOI] [PMC free article] [PubMed] [Google Scholar]
- 32.Tuite AR, Greer AL, Whelan M, et al. Estimated epidemiologic parameters and morbidity associated with pandemic H1N1 influenza. CMAJ. 2010;182(2):131–136. doi: 10.1503/cmaj.091807. [DOI] [PMC free article] [PubMed] [Google Scholar]
- 33.White LF, Wallinga J, Finelli L, et al. Estimation of the reproductive number and the serial interval in early phase of the 2009 influenza A/H1N1 pandemic in the USA. Influenza Other Respi Viruses. 2009;3(6):267–276. doi: 10.1111/j.1750-2659.2009.00106.x. [DOI] [PMC free article] [PubMed] [Google Scholar]
- 34.Miller MA, Viboud C, Balinska M, et al. The signature features of influenza pandemics—implications for policy. N Engl J Med. 2009;360(25):2595–2598. doi: 10.1056/NEJMp0903906. [DOI] [PubMed] [Google Scholar]
- 35.Centers for Disease Control and Prevention. FluView: a Weekly Influenza Surveillance Report Prepared by the Influenza Division. Atlanta, GA: Centers for Disease Control and Prevention; 2010. ( http://www.cdc.gov/flu/weekly/). (Accessed February 26, 2010) [Google Scholar]
- 36.Simonsen L, Clarke MJ, Schonberger LB, et al. Pandemic versus epidemic influenza mortality: a pattern of changing age distribution. J Infect Dis. 1998;178(1):53–60. doi: 10.1086/515616. [DOI] [PubMed] [Google Scholar]
- 37.World Health Organization. Recommended Viruses for Influenza Vaccines for Use in the 2010–2011 Northern Hemisphere Influenza Season. February 2010. Geneva, Switzerland: World Health Organization; 2010. ( http://www.who.int/csr/disease/influenza/201002_Recommendation.pdf). (Accessed June 9, 2010. [Google Scholar]
Associated Data
This section collects any data citations, data availability statements, or supplementary materials included in this article.