Abstract
Three novel human insulin-releasing cell lines designated 1.1B4, 1.4E7, and 1.1E7 were generated by electrofusion of freshly isolated of human pancreatic beta cells and the immortal human PANC-1 epithelial cell line. Functional studies demonstrated glucose sensitivity and responsiveness to known modulators of insulin secretion. Western blot, RT-PCR, and immunohistochemistry showed expression of the major genes involved in proinsulin processing and the pancreatic beta cell stimulus-secretion pathway including PC1/3, PC2, GLUT-1, glucokinase, and K-ATP channel complex (Sur1 and Kir6.2) and the voltage-dependent L-type Ca2+ channel. The cells stained positively for insulin, and 1.1B4 cells were used to demonstrate specific staining for insulin, C-peptide, and proinsulin together with insulin secretory granules by electron microscopy. Analysis of metabolic function indicated intact mechanisms for glucose uptake, oxidation/utilization, and phosphorylation by glucokinase. Glucose, alanine, and depolarizing concentrations of K+ were all able to increase [Ca2+]i in at least two of the cell lines tested. Insulin secretion was also modulated by other nutrients, hormones, and drugs acting as stimulators or inhibitors in normal beta cells. Subscapular implantation of the 1.1B4 cell line improved hyperglycemia and resulted in glucose lowering in streptozotocin-diabetic SCID mice. These novel human electrofusion-derived beta cell lines therefore exhibit stable characteristics reminiscent of normal pancreatic beta cells, thereby providing an unlimited source of human insulin-producing cells for basic biochemical studies and pharmacological drug testing plus proof of concept for cellular insulin replacement therapy.
Keywords: Cell Metabolism, Diabetes, Glucose Metabolism, Insulin Secretion, Pancreas, Electrofusion, Signal Recognition, Stimulus-Secretion Coupling
Introduction
The restricted supply of viable human islets greatly limits the opportunity for studies of beta cell function as well as restricting the success of worldwide clinical islet transplantation programs. Generation of human pancreatic beta cell lines would provide a practically unlimited supply of pure insulin-secreting cells, which can be grown and harvested with a minimum of effort. Such human cell lines would be extremely useful in studies of pancreatic beta cell biology and potentially provide an alternative strategy to primary tissue for cellular therapy of type 1 diabetes.
A large number of rodent insulinoma cell lines have been developed from transgenic animals expressing the SV40 antigen oncogene from the insulinoma gene promoter such as the MIN-6, βTC, and βHC cell lines (Refs. 1, 2 and 3, respectively). Hamster insulinoma (HIT) cells (4) were also generated by transformation of hamster pancreatic islet cells via infection with SV40 and have given rise to a number of clones including the HIT-T15 cell line (5). Other studies using rodent tumor cell lines have also succeeded in mimicking many properties of fully differentiated beta cells. RIN cell lines derived from a transplantable rat insulinoma (6) have been used extensively, and a number of derived cell lines have been generated from their subclones. One of these is the glucose-responsive insulin-secreting BRIN-BD11 cell line generated by electrofusion of the RINm5F clone and normal rat beta cells (7). The INS-1 cell line (8), also derived from the original radiation tumor, has high insulin content and is able to maintain insulin secretory responsiveness over a prolonged period in culture (6).
Studies of these rodent pancreatic beta cell lines have provided the foundation for many advances in beta cell research, but generation of stable human insulin-producing cell lines would provide a fundamental progression toward testing on human-derived tissue, assisting drug development and possible clinical diabetes therapy. Despite the overwhelming impetus to produce such cell lines, it has proven to be extremely difficult when compared with the rodent model (9, 10). There are some studies with limited success in producing human insulinoma cell lines. One cell line developed from a spontaneous insulinoma, grew slowly, and lost many of its differentiated characteristics (11). Another line, HIN D8 cloned from a human insulinoma, showed significant insulin secretory response to glucose and other secretagogues, but no studies have since been reported using this cell line (12, 13). Recent work has demonstrated successful long-term culture and insulin secretion from human insulinoma cells dependent on co-culture with trophic factors (14). Other investigators have attempted to immortalize fetal or adult human beta cells or non-pancreatic cells using transfection with oncogenes and pancreatic endocrine developmental markers (15, 16). The human Persistant Hyperinsulinemic Hypoglycemia of Infancy (PHHI)-derived pancreatic beta cell line, NES2Y, has also been reported to exhibit glucose-stimulated insulin secretion after successful transfection to repair defects in expression of K-ATP channel and PDX-1 genes (17). Blox5 is an immortalized cell line produced from a purified population of human beta cells by infection with retroviral vectors expressing the SV40 T antigen, H- rasval12, and hTERT oncogenes (18). This cell line grows indefinitely but loses differentiated function and the ability to express insulin. Overexpression of PDX1 was able to restore glucose-stimulated insulin secretion. A reversibly immortalized human beta cell clone termed NAKT-15 has also been produced by transfection with the SV40T antigen and cells shown to express beta cell transcription factors and rescue streptozotocin-induced diabetes in mice (19). However, this demonstrates that gene transfection of human beta cells is usually necessary for continued expression of insulin and other proteins required for stimulus-secretion coupling.
In the present study, we have adapted the technology used to generate the novel hybrid rat BRIN-BD11 insulin-secreting cell line (7) to produce immortal human beta cells. We report here the characteristics and functional properties of three novel human pancreatic beta cell clones produced by electrofusion of human beta cells with human PANC-1 epithelial cells (20). These cell lines are stable in culture and exhibit many functional attributes of human beta cells.
EXPERIMENTAL PROCEDURES
Origins of Human Islets and Immortal Cells
Cultured human islets from two donors aged 25 and 28 were sent by overnight courier from Barcelona to Coleraine. Ethical approval for use of this material was gained from relevant bodies in Spain and the United Kingdom. The cell fusion partner PANC-1 (20) was obtained from the European Collection of Cell Cultures (ECACC, Salisbury, England) and rendered HAT4 (hypoxanthine/aminopterin/thymidine)-sensitive by culture in RPMI 1640 culture medium containing 0.13 mm 8-azaguanine for 25 days until azaguanine-resistant cells were isolated. HAT selectivity was used to carefully select immortal partner cells for electrofusion.
Electrofusion of Islet and Immortal Cells
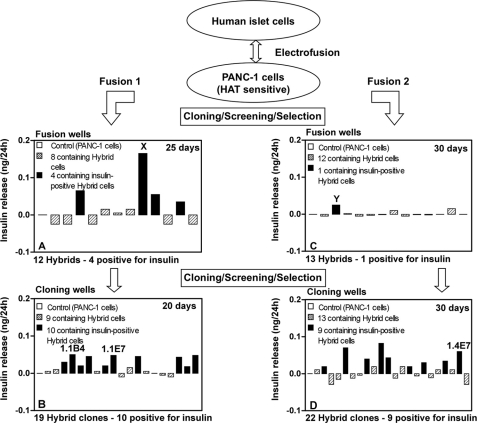
Islet cells from dispersed human islets and PANC-1 cells were mixed at a ratio of 1:1 and pipetted into a helical chamber (Biojet, B. Braun Biotech International GmbH). Electrofusion was carried out at 7 V, 2 MHz of AC field for 30 s followed by 60 V, triple pulses of 15-s duration times of DC field. The cells were then exposed to 7 V, 2 MHz of AC field for 30 s to allow post-fusion alignment. Cells were incubated overnight at 37 °C in RPMI 1640 culture medium supplemented with HAT (0.1 mm hypoxanthine, 0.4 μm aminopterin, 16 μm thymidine), which was replaced after 24 h, and the cells were maintained in this selective medium for 10 days. The cell fusion mixture was then maintained in medium supplemented with hypoxanthine (0.1 mm) and thymidine (16 μm) until colonies of hybrids were seen under microscopic observation. This procedure was repeated for the second batch of human islets, designated as Fusion 1 and Fusion 2, respectively (Fig. 1).
FIGURE 1.
A and C, cell hybrids (azaguanine-resistant) resulting from electrofusion of human islet cells with PANC-1 cells after 25 (A) and 30 (C) days of culture. Cells in well X (A) and well Y (C) were selected on the basis of high insulin output for cloning and gave rise to clones 1.1B4 and 1.1E7 (both in B) and 1.4E7 (D), respectively, which were selected on the basis of insulin output for further evaluation.
Screening for Hybrid Human Pancreatic Beta Cells
Colonies of hybrid cells from Fusions 1 and 2 appeared 10–20 days after electrofusion and were maintained until 25–30 days, when the medium was replaced 24 h before screening. Aliquots of 200 μl of culture medium were removed in duplicate for insulin measurement. Correction for insulin or interfering substances was made using media similarly taken from parental PANC-1 cells. The first screening procedure resulted in the detection of five insulin-positive hybrids and hybrid cells with the highest insulin output (in Fig. 1, designated X and Y from Fusions 1 and 2, respectively) were harvested and divided into cloning wells. After a further 20–30 days, this resulted in the production of 19 hybrid clones from Fusion 1, 10 of which were insulin-positive, and 22 hybrid clones from Fusion 2, nine of which were insulin-positive. Of these 19 insulin-positive clones, a final selection of three clones with the highest insulin output was made, and these were designated 1.1B4, 1.1E7, and 1.4E7. These cell lines have been deposited and authenticated by ECACC, from where they are available on application.
Culture of Human Insulin-secreting Cell Lines
Cells were cultured at 37 °C in 5% CO2 and 95% air in RPMI 1640 culture medium supplemented with 10% (v/v) fetal bovine serum and antibiotics (100 units/ml penicillin and 0.1 g/liter streptomycin) using 150-cm2 vented Iwaki tissue culture flasks (Bibby Sterilin, Ltd., Stone, Staffordshire, UK). Cells were routinely passaged by washing with 2 × 10 ml Hanks' balanced saline solution (Invitrogen) prior to detachment with 0.25% (w/v) trypsin/EDTA (Invitrogen) and splitting at a 1:3 ratio.
Insulin Release and Cellular Hormone Content
Monolayers were harvested 24 h prior to experimentation, and 250,000 cells were seeded in each well of 24-well multiplates (Iwaki Glass). After attachment overnight, medium was removed, and 1 ml of Krebs-Ringer bicarbonate buffer (7), supplemented with 0.1% (w/v) bovine serum albumin (BSA) and 1.1 mm glucose, was added to each well. After a 40-min preincubation, test incubations were performed for 60 min in 1 ml of Krebs-Ringer bicarbonate buffer supplemented with established modulators of beta cell function. Aliquots were removed and stored at −20 °C until analysis. Acid ethanol extracts were prepared for determination of hormone content. Insulin was measured by radioimmunoassay (21) using a human insulin standard. The antibody employed cross-reacts fully with proinsulin. Human proinsulin was determined using a human total proinsulin ELISA kit (Linco Research), which detects intact human proinsulin with no cross-reactivity with either human insulin or C-peptide.
Immunohistochemistry of Functional Beta Cell Proteins
Cells were plated onto poly-l-lysine-coated glass slides (BDH/Merck) and cultured overnight to allow attachment. After fixation in ice-cold 4% paraformaldehyde (BDH/Merck)/PBS, cells were permeabilized with 0.3% Triton X-100 before incubation with the primary antibodies: human insulin monoclonal antibody (AbD Serotec, Oxford, UK, 1:100); GLUT-1 affinity-purified polyclonal antibody (Santa Cruz Biotechnology, Santa Cruz, CA, 1:100); amylin rabbit antiserum (Peninsula Laboratories Inc., Belmont, CA, 1:200); glucokinase polyclonal antiserum, (gift from Prof. Sigurd Lenzen, Hannover, Germany, 1:1000); human C-peptide monoclonal antibody (Bachem, St. Helens, UK, 1:5000); and human proinsulin monoclonal antibody (Hytest, 1:500), all carried out overnight at 4 °C. After washing, cells were incubated with either Alexa Fluor 488 fluorescein anti-rabbit IgG (H+L) or anti-mouse IgG (H+L) made in goat (Molecular Probes) at a dilution of 1:200 in PBS for 45 min at 37 °C before mounting and visualization of positive staining using an IX51 Olympus microscope, with images recorded using the PC Imagedok program. Immunohistochemistry was also performed with antibodies for glucagon (monoclonal antibody, Sigma, 1:1000), human somatostatin (polyclonal antibody, Peninsula Laboratories Inc., 1:200), and human pancreatic polypeptide (polyclonal antibody, Abcam, Cambridge, UK, 1:500). No positive staining for these islet peptides was detected in any of the cell lines tested (data not shown). Human-specific antibodies were used where possible, as indicated above.
RT-PCR of Human Marker and Functional Beta Cell Genes
Total RNA from the hybrid cell lines, parental PANC-1 cells, and rat pancreas and liver was isolated with TRI Reagent (Sigma), and RNA was measured using a NanoDrop ND-1000 spectrophotometer (Thermo Fisher Scientific). RT-PCR was performed on a Bio-Rad Gene Cycler using 100 ng of RNA (supplemental Table 1). PCR products were run on a 2% ethidium bromide agarose gel, and images were taken with the Kodak Imagedok program.
Electron Microscopy of Secretory Granules
1.1B4 cells were fixed with half-strength Karnovsky fixative (22), washed, and then post-fixed in 1% OsO4/0.1 m cacodylate buffer. Alcohol-dehydrated cells were incubated in 50:50 (v/v) propylene oxide/araldite prior to resin embedding. Ultrathin microtome sections (60/70 nm thick) were cut (Ultra-cut, Leica, Milton Keynes, UK), mounted on 200-mesh copper grids (Agar Scientific Ltd., Stansted, UK), and stained with uranyl acetate and lead citrate (BDH) and viewed on an FEI Tecnai 12 electron microscope.
Glucokinase and GLUT-1 Glucose Transporter Protein
Soluble cytoplasmic and membrane fractions were obtained from 15 × 106 cells for assessment of glucokinase and GLUT-1 proteins. 100 μg of samples was denatured by heating at 100 °C, and electrophoresis was performed at a constant current of 40 mA, 120 V and then 350 mA, 100 V for 90 min using the Bio-Rad Transblot system (Richmond, CA). Incubation was performed for 1 h with the primary GLUT-1 (Santa Cruz Biotechnology) or glucokinase antibody (S. Lenzen, Hannover, Germany), both at 1:1000 dilution, followed by incubation with HRP-labeled antibody (Amersham Biosciences) diluted 1: 1000, and finally, streptavidin-HRP (horse radish peroxidase) conjugate (diluted 1:1500). Protein expression was visualized using the Amersham Biosciences enhanced chemiluminescence (ECL) detection system using Hyperfilm ECL (Amersham Biosciences).
Glucose Uptake
Cellular uptake of 1 μCi/ml 3-O-methyl-d-[1-3H]glucose (Amersham Biosciences) at 1.1 or 16.7 mm d-glucose was assessed at 37 °C. The reaction was terminated by three rapid washes with 0.5 ml of ice-cold buffer containing 100 mm glucose, and cells were lysed with 1 ml of 0.5% sodium dodecyl sulfate (SDS). Counts in lysates were quantified by liquid scintillation counting (Wallac 1409 liquid scintillation counter).
Glucokinase and Hexokinase Activity
Rates of cellular glucose-phosphorylating activity in the soluble cytoplasmic fractions (from the 45,000-rpm centrifugation step) were assayed at 37 °C (23). Hexokinase activity was assayed in the presence of 1 mm d-glucose and subtracted from the total activity recorded at 100 mm d-glucose to give glucokinase activity. One unit of enzyme activity was defined as 1 μmol of glucose 6-phosphate formed from glucose and ATP per minute at 37 °C.
Glucose Metabolism and Utilization
For oxidative glucose metabolism, 2.0 × 10⁵ cells were incubated at 1.1 or 16.7 mm glucose plus 0.25 μCi of d-[U-14C]glucose (24). Glucose utilization was determined similarly using d-[5-3H]glucose. The reactions were stopped by the addition of 0.2 m HCl (50 μl) and 14CO2- or 3H2O-labeled radioactivity determined by scintillation counting.
Karyotype
Cells were incubated for 2 h with colchicine (0.2 ml/10 ml), washed, and resuspended by the dropwise addition of ice-cold fixative (3:1 methanol:acetic acid). Chromosomes were spread by dropping the suspension from a height of 1.0–1.5 m onto an ice-cold microscope slide held at an angle of 45°, stained with freshly prepared Giemsa stain, and visualized with the IX51 Olympus microscope.
Intracellular Calcium ([Ca2+]i)
Cells were seeded at 1.0 × 10⁵ cells/well as monolayers into 96-well black-walled, clear bottom microplates (Greiner Bio-One, Gloucestershire, UK) and allowed to attach overnight. After washing, 100 μl of Krebs-Ringer bicarbonate buffer was added to each well for 10 min before the addition of 100 μl of the FLIPR calcium assay kit (Molecular Devices) at 37 °C (25). Fluorometric data were acquired using the FlexStationTM (Molecular Devices).
In Vivo Analysis of the 1.1B4 Cell Line
Adult female SCID mice (18–22 g) were made diabetic by intraperitoneal injection of streptozotocin (Sigma) at 180 mg/kg of body weight (as indicated in Fig. 9B, day −14). 1.1B4 cells were harvested and resuspended in RPMI 1640 culture medium. Diabetic mice (n = 5) were given a single subscapular injection of 5 × 10⁶ cells in 100 μl of tissue culture medium. Control mice (n = 4) received medium alone. Blood glucose was measured using the FreeStyle MiniTM kit and strips (TheraSense Inc., Alameda, CA). An intraperitoneal glucose tolerance test (18 mmol/kg) was performed on selected mice at day 20 after cell transplantation. The experiment was terminated at day 28 when body weight, plasma glucose, and insulin were determined together with examination of tissue at the original implantation site.
FIGURE 9.
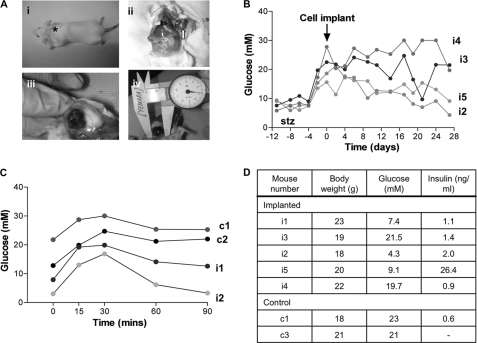
A, panel I, the site of implantation of the clonal hybrid pancreatic beta cell line 1.1B4 in the subscapular region of the adult SCID mouse (asterisk). Panels ii and iii, the formation of the well vascularized subdermal 1.1B4-derived cell mass in a clear capsule (arrow). Panel iv, the average size of the cell mass on excision (day 28 after injection) was ∼21 × 14 mm. B, blood glucose measurements for SCID mice implanted with the 1.1B4 cell line at day 0 (arrow). Mice injected with 180 mg/kg of streptozotocin (stz) exhibited hyperglycemia between day −2 and day 0. Mice were monitored until day 28. C, glucose tolerance test showing blood glucose measurements between 0 and 90 min after intraperitoneal injection with 18 mmol/kg glucose (0 min) in both control (c1 and c2) and 1.1B4-implanted (i1 and i2), diabetic SCID mice. D, data for body weight, blood glucose, and plasma insulin at the termination of the in vivo experiment in individual SCID mice (day 28).
Statistical Analysis
Results are expressed as mean ± S.E. Values were compared using one-way analysis of variance followed by Dunnett's test. Groups of data were considered to be significantly different if p < 0.05.
RESULTS
Morphology, Growth, Hormone Content, and Processing
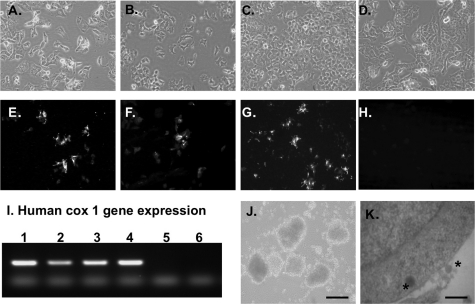
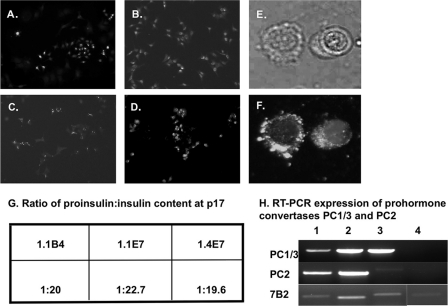
1.1B4, 1.1E7, 1.4E7, and parental PANC-1 cells grew as monolayers taking on a pavement pattern (Fig. 2, A–D). Karyotyping showed cells to exhibit between 66 and 67 chromosomes (supplemental Table 2). The human cox-1 gene, used as a marker of human species identity, was expressed in all four cell lines (Fig. 2I, lanes 1–4). No expression was found in mouse pancreas (lane 6). All human islet hybrid cell lines showed consistent growth patterns with approximate doubling times of 23–26 h when compared with 21 ± 1.6 h for non-fused PANC-1 cells (supplemental Table 2). Each clonal cell line exhibited positive staining for insulin (Fig. 2, E–G) with cellular insulin content at passage 17 between 3.5 and 3.9 ng/106 cells (supplemental Table 2). There was no significant change in insulin content by passage 40 (3.2–4.1 ng/106 cells). PANC-1 cells did not contain immunoreactive insulin (supplemental Table 2 and Fig. 2H). If maintained in suspension culture rather than as monolayers, 1.1B4 cells formed pseudoislet-like structures (Fig. 2J). Evaluation of 1.1B4 cells by transmission electron micrographs revealed dark insulin granules in the cytoplasm and external cell surface (Fig. 2K). The three hybrid cell lines released 9–10% of cellular insulin during acute 60-min incubation (supplemental Table 2). In 1.1B4 cells, insulin, proinsulin, and C-peptide were each visualized using human-specific antibodies (Fig. 3, A–C). Islet amyloid polypeptide was also detected in the cytoplasm (Fig. 3D). Higher magnification phase contrast and fluorescence microscopy of the same cells show the location of cytoplasmic expression of human insulin (Fig. 3, E and F.) The presence of intact human proinsulin was demonstrated by ELISA in all three beta cell lines but not in PANC-1 cells, with a ratio of cellular proinsulin to insulin between 1:20 and 1:23 (Fig. 3G). RT-PCR analysis also confirmed expression of the human beta cell prohormone convertases PC1/3 and PC2 and the PC2-binding protein 7B2 in these cells (Fig. 3H, lanes 1–3). PANC-1 cells did not show expression of PC1/3 and PC2, although there was faint expression for 7B2 (Fig. 3H, lane 4).
FIGURE 2.
A–D, phase contrast microscopy showing the morphology of 1.1B4, 1.1E7, 1.4E7, and parental PANC-1 cell lines grown as monolayers in culture. E, F, and G, immunohistochemistry showing positive staining for insulin in 1.1B4, 1.1E7, and 1.4E7 cell lines (E, F, and G, respectively). H, PANC-1 cells are negative for insulin. Slides were analyzed by fluorescence microscopy using an IX51 Olympus microscope (×20 magnification). I, RT-PCR showing expression of the human cox-1 gene in 1.1B4, 1.1E7, 1.4E7, and parental PANC-1 cell lines (lanes 1–4, respectively). Lane 5 contained no maize mosaic virus (MMV) reverse transcriptase; RNA from mouse pancreas was used as negative control (lane 6). J, phase contrast of 1.1B4 cells showing aggregation into the pseudoislet structure if maintained in suspension culture using ultralow attachment flat-bottomed 6-well plates (×10 magnification; scale bar, 200 μm) K, transmission electron micrographs showing the presence of dark insulin granules (asterisks) in the cytoplasm and external surface of 1.1B4 cells; scale bar, 2 μm.
FIGURE 3.
A–D, fluorescence immunohistochemistry in the 1.1B4 cell line using antibodies specific to human insulin (A), human proinsulin (B), human C-peptide (C), and islet amyloid polypeptide (D). E and F, phase contrast high magnification image of two 1.1B4 cells (E) and the same cells under fluorescence showing the location of insulin in the cell cytoplasm as bright punctate spots (F). Positive staining is seen in all panels as bright spots of staining in the cell cytoplasm. Slides were analyzed by fluorescence microscopy using an IX51 Olympus microscope (×20 magnification, A–D; ×60 magnification, E and F). G and H, the ratio of human proinsulin:insulin content is shown for all three clonal hybrid cell lines (G) along with RT-PCR expression of the prohormone convertases PC1/3, PC2, and its binding protein 7B2 in 1.1B4, 1.1E7, 1.4E7, and parental PANC-1 cell lines (lanes 1–4, respectively) (H). p17, passage 17.
Secretory Responsiveness to Glucose and Stability
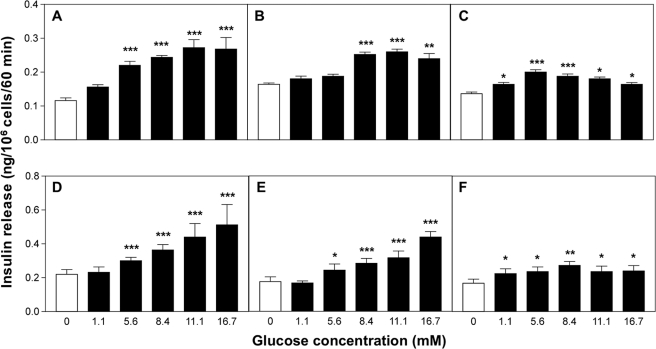
Each cell line showed a different pattern and magnitude of responsiveness to acute glucose challenge (Fig. 4, A–C). 1.1B4 cells exhibited a stepwise 2.3-fold insulin secretory response over the range 0–16.7 mm glucose, with a threshold at 5.6 mm glucose (Fig. 4A). Both 1.1E7 and 1.4E7 cells showed maximal 1.6- and 1.5-fold secretory response to glucose at 11.1 and 5.6 mm glucose, respectively (Fig. 4, B and C). Inclusion of 200 μmol/IBMX significantly increased the secretory responses by 20–100% (p < 0.001; Fig. 4, D–F). No significant differences were recorded between passages 17 and 40 in terms of basal insulin release and secretory responsiveness to glucose or KCl (supplemental Table 3).
FIGURE 4.
Glucose responsiveness of human-derived pancreatic beta cell lines. Following a 40-min preincubation, the effects of various glucose concentrations were tested during 60-min incubations either alone (1.1B4 (A), 1.1E7 (B), and 1. 4E7 (C)) or in the presence of IBMX (200 μm) (1.1B4 (D), 1.1E7 (E), and 1.4E7 (F)). Values are mean ± S.E. (n = 12). *, p < 0.05, **, p < 0.01, ***, p < 0.001 when compared with 0 mm glucose in the absence (A–C) and presence of 200 μm IBMX (D–F).
Glucose Transporter Protein Expression and Uptake
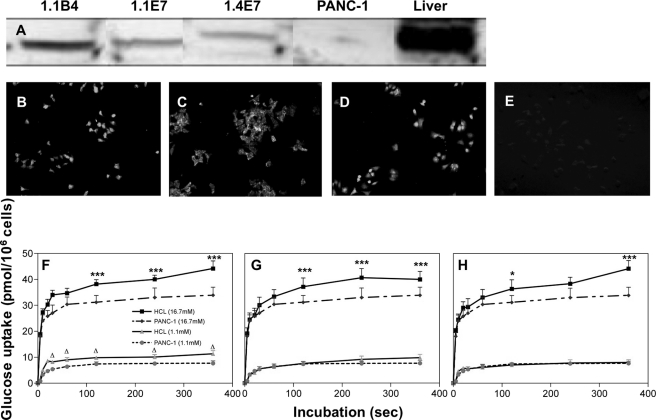
Western blot revealed expression of GLUT-1 glucose transporter protein in membranes of the hybrid cell lines (Fig. 5), with very low levels seen in parental PANC-1 cells. Fluorescence immunohistochemistry visualized GLUT-1 transporter expression in the cytoplasm, whereas no positive staining was detected in PANC-1 cells (Fig. 5, B–E). As shown in Fig. 5, F–H, the hybrid cell lines exhibited markedly enhanced glucose transport profiles at 16.7 mm when compared with 1.1 mm glucose or when compared with PANC-1 cells.
FIGURE 5.
A, Western blot analysis for GLUT-1 protein in clonal human beta cell lines 1.1B4, 1.1E7, 1.4E7, and PANC-1 cells. Liver from Wister rat was used as a positive control. B–E, immunohistochemistry showing fluorescence staining for GLUT-1 protein in clonal 1.1B4, 1.1E7, 1.4E7, and PANC-1 parental cell lines. F–H, 3-O-methyl-d-[1-3H]glucose uptake by PANC-1 cells or human islet-derived 1.1B4 (F), 1.1E7 (G), and 1.4E7 (H) at low and high glucose concentrations. Incubations were performed at 37 °C at 1.1 or 16.7 mm glucose for periods of 0–360 s. Values are mean ± S.E. (n = 3). *, p < 0.05, ***, p < 0.001 when compared with PANC-1 at 16.7 mm glucose. Δ, p < 0.05 when compared with PANC-1 at 1.1 mm glucose. Slides were analyzed by fluorescence microscopy using an IX51 Olympus microscope (×20 magnification).
Glucokinase Protein Expression and Activity
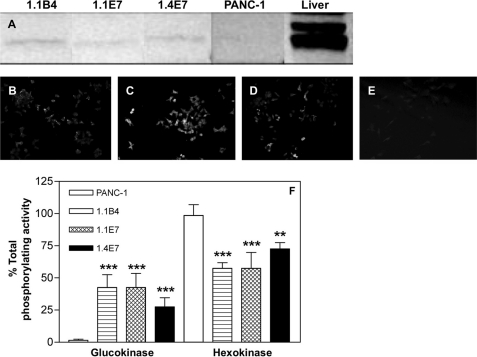
Western blot with specific glucokinase antibody detected a 50-kDa protein in each electrofusion-derived cell line (Fig. 6A). Using fluorescence immunohistochemistry, glucokinase protein was visualized as small punctate spots in the cytoplasm of these cells (Fig. 6, B–D). No glucokinase expression was detected in PANC-1 cells (Fig. 6, A and E), and the three novel cell lines exhibited significantly higher (p < 0.01 to p < 0.001) glucokinase and lower (p < 0.01 to p < 0.001) hexokinase activity when compared with PANC-1 cells (Fig. 6F). The percentage of contribution of glucokinase to total glucose-phosphorylating activity was 27–42% in 1.1B4, 1.1E7, and 1.4E7 cells when compared with less than 2% in PANC-1 cells.
FIGURE 6.
A, Western blot analysis for glucokinase protein in clonal human beta cell lines 1.1B4, 1.1E7, 1.4E7, and PANC-1 cells. Liver from Wister rat was used as a positive control. B–E, immunohistochemistry (IHC) showing fluorescence staining for glucokinase protein in clonal 1.1B4, 1.1E7, 1.4E7, and PANC-1 parental cell lines. Slides were analyzed by fluorescence microscopy using an IX51 Olympus microscope (×20 magnification). F, the glucose-phosphorylating activities of parental and clonal cell lines. Soluble cytoplasmic fractions were assayed spectrophotometrically to determine the relative contribution of glucokinase and hexokinase to the total glucose-phosphorylating activities of the cells. Values are mean S.E. (n = 3). **, p < 0.01, ***, p < 0.001 when compared with PANC-1 cells.
Glucose Oxidation and Utilization
All three beta cell lines exhibited greater glucose oxidation rates than PANC-1 cells (supplemental Table 4). 1.1B4 and 1.4E7 cells also showed significant increases (p < 0.05) in glucose oxidation rates when comparing 1.1 with 16.7 mm glucose. Values for glucose utilization were less and did not show such appreciable differences between PANC-1 and electrofusion-derived beta cells (supplemental Table 4).
Responsiveness to Other Modulators Of Beta Cell Function
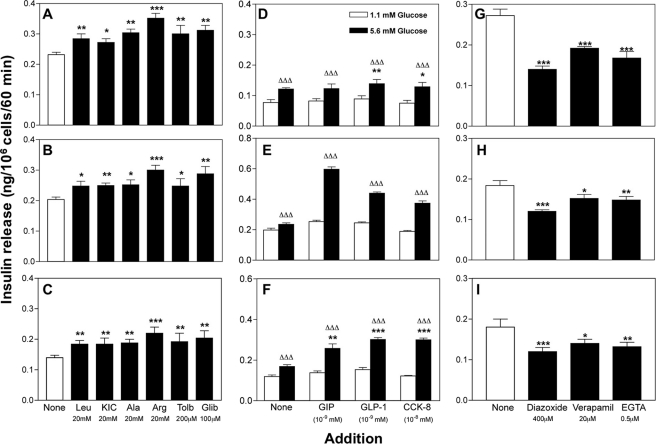
The amino acids leucine, KIC, alanine, arginine, tolbutamide, and glibenclamide significantly (p < 0.05 to p < 0.001) increased insulin secretion by 1.1–1.4-fold in the three cell lines (Fig. 7, A–C). Glucose-dependent insulinotropic polypeptide (GIP), glucagon-like peptide-1 (GLP-1), and cholecystokinin-8 (CCK-8) also significantly (p < 0.001) increased insulin release (Fig. 7, D–F). The responses to a range of known inhibitors at 16.7 mm glucose are shown in Fig. 7, G–I. The K+-ATP channel opener, diazoxide (400 μmol/liter), caused a significant 20–50% inhibition of insulin release from 1.1B4, 1.1E7, and 1.4E7 cells (p < 0.01 to p < 0.001). Inclusion of the voltage-dependent Ca2+ channel blocker, verapamil (20 μm), inhibited insulin release by 20–40% (p < 0.05 to p < 0.001), whereas depletion of extracellular Ca2+ using EGTA significantly decreased insulin secretion by 20–40% (p < 0.01 to p < 0.001).
FIGURE 7.
Effects of known modulators of pancreatic beta cell function on insulin secretion from human islet-derived cell lines 1.1B4 (A, D, and G), 1.1E7 (B, E, and H), and 1.4E7 (C, F, and I). After a 40-min preincubation, stimulators and inhibitors were tested over a period of 60 min. Values are mean ± S.E. (n = 12). *, p < 0.05, **, p < 0.01, ***, p < 0.001 when compared with 11.1 mm (A–C), 5.6 mm (D–F), or 16.7 mm (G–I) glucose alone and ΔΔΔ, p < 0.001 when compared with 1.1 mm glucose in the absence of peptide hormone (D–F). Effects of calcium chelation with EGTA were determined in calcium-free buffer. Tolb, tolbutamide; Glib, glibenclamide; GIP, glucose-dependent insulinotropic polypeptide.
K-ATP Channel and Intracellular Calcium
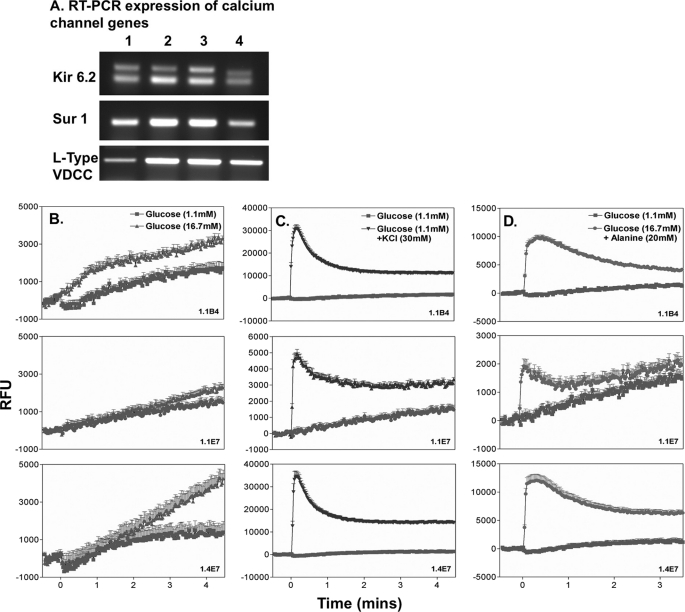
All three hybrid beta cell lines and PANC-1 cells expressed Kir6.2 and Sur1 as revealed by RT-PCR analysis (Fig. 8A). Measurements of intracellular [Ca2+]i following exposure to 16.7 mm glucose, a depolarizing concentration of KCl (30 mm), or 20 mm alanine are shown in Fig. 8, B–D. Glucose caused a significant increase (p < 0.001) in [Ca2+]i in both 1.1B4 and 1.4E7 cells (Fig. 8B). Such change was less evident in 1.1E7 cells. Membrane depolarization with KCl consistently evoked significant (p < 0.001) increases of [Ca2+]i when compared with 1.1 mm glucose alone (Fig. 8C). A similar increase was observed following exposure to 20 mm alanine (from p < 0.05 to p < 0.001) (Fig. 8D).
FIGURE 8.
A, RT-PCR expression of genes of the K-ATP calcium (Kir6.2, Sur1) and L-type voltage-dependent calcium channel (VDCC) in 1.1B4, 1.1E7, 1.4E7, and PANC-1 (lanes 1–4). B–D, effects of acute (3-min) exposure to insulin secretagogues on intracellular Ca2+ in 1.1B4, 1.147, and 1.1E7 cell lines at 1.1 and 16.7 mm glucose (B), 1.1 mm glucose and 30 mm KCl (C), and 16.7 mm glucose and 20 mm alanine (D). Cells were exposed to secretagogues at time 0, and readings were taken every 2.5 s. Each data point represents mean ± S.E. (n = 6). RLU, relative light units.
Ability of the 1.1B4 Cell Line to Ameliorate the Hyperglycemia in Streptozotocin-Diabetic SCID Mice
The functional capacity of implanted 1.1B4 cells to lower blood glucose in streptozotocin-diabetic SCID mice is shown in Fig. 9. 1.1B4 cells grew as distinct, well vascularized, encapsulated cell masses over a period of 28 days (Fig. 9A, panels i–iv). The average harvested cellular mass at day 28 was 0.82 g. Blood glucose measurements in two of the implanted SCID mice (i2 and i5) showed a marked reduction achieving near normoglycemia at termination of the study (Fig. 9B). This observation is supported by the markedly improved glucose tolerance of 1.1B4-implanted mice (i1 and i2) when compared with untreated streptozotocin-treated controls (Fig. 9C). From Fig. 9D, it is also evident that implantation of 1.1B4 cells restored blood glucose to below 10 mm in three of the implanted mice when compared with levels >20 mm in the control diabetic, non-implanted group at 28 days. Significant amounts of insulin were detected in the circulation of mice with cell implants (0.9–26.4 ng/ml) (Fig. 9D).
DISCUSSION
Three novel human clonal hybrid insulin-producing cell lines have been generated by electrofusion of human beta cells with human ductal epithelial PANC-1 cells. The fusion and cloning techniques were carefully optimized in our laboratory to produce hybrids inheriting beta cell attributes and immortality from the two cell fusion partners. A similar approach was used to produce glucose-responsive rat insulin-secreting cells previously (7).
The novel cell lines, designated 1.1B4, 1.1E7, and 1.4E7, grew as monolayers in culture, showing a pavement pattern routinely observed for epithelial cells. Their human identity was confirmed by positive expression of the highly specific human mitochondrial cytochrome c oxidase cox-1 gene and positive reaction with various human-specific antibodies. This classification has since been confirmed independently by STR profiling of the 1.1B4 cell line by the ECACC. Each cell line maintained a stable growth rate and phenotype over extended passage, including stable chromosome numbers of between 66 and 67 at low and high passage. Interestingly, like dispersed human islet cells (26), 1.1B4 cells clustered together to form pseudoislet structures when maintained in suspension culture.
In addition to immortality, useful hybrids must inherit attributes of functional beta cells from the islet-derived fusion partner. Accordingly, hybrids were screened and selected on the basis of insulin released into culture medium. Consistent with positive cellular insulin content, all three cell lines expressed immunoreactive insulin in their cytoplasm, unlike parental PANC-1 cells. The hybrid cells also contained dark granules in the cytoplasm and possessed the ability to process the hormone as suggested by the levels of human proinsulin (proinsulin:insulin ratio ∼1:20) and the expression of C-peptide plus the key processing enzymes, prohormone convertases 1/3 and 2.
Consistent with good functional integrity, acute tests showed significant insulin secretory responses to a range of glucose concentrations (5.6–16.7 mm). 1.1B4 cells showed a more enhanced stepwise pattern of insulin output when compared with 1.1E7 and 1.4E7 cells, releasing about 10% of their insulin content, similar to the pattern observed in several animal beta cell lines (1, 7). This insulin secretory effect was potentiated by a further 20–60% when glucose was combined with the phosphodiesterase inhibitor IBMX. This indicates that elevation of cAMP potentiates glucose- and Ca2+-mediated insulin release as in native beta cells (27).
These significant and stable responses to glucose suggest intact glucose sensing machinery (28). Indeed, all three cell lines expressed GLUT-1 protein, as evidenced by Western blot and fluorescence immunohistochemistry. This was associated with efficient glucose transport in each hybrid cell line, which unlike the parental PANC-1 cells, were not overwhelmed by increasing the extracellular glucose from 1.1 to 16.7 mm. This seems to reflect the very low expression of PANC-1 glucose transporter. In native pancreatic beta cells, glucose transport is not considered rate-limiting except under extreme conditions (29). However, glucokinase activity is believed to be a vital determinant of beta cell glucose sensitivity (30). Importantly, 1.1B4, 1.1E7, and 1.4E7 cells exhibited high levels of glucokinase protein. Glucokinase and hexokinase enzyme activity was evident, with glucokinase contributing between 27 and 43% to the total phosphorylating activity, a landmark feature of normally functioning beta cells, when compared with less than 2% in parental PANC-1 cells. Overall, the secretory function of 1.1B4 cells appeared superior to the other cell lines, possibly reflecting enhanced glucose sensing via observed increases of GLUT-1 and glucokinase.
The inheritance of intact stimulus-secretion pathways also allowed the hybrid cells to respond to a wide range of other regulators of beta cell function. For example, the amino acids leucine, KIC, alanine, and arginine caused significant increases in insulin release from each cell line. Similarly, blockade of K-ATP channels with glibenclamide or tolbutamide enhanced insulin release as in native beta cells (31). The intestinal hormones glucose-dependent insulinotropic polypeptide (GIP), GLP-1, and CCK-8 trigger insulin release via diverse signal transduction pathways including adenylate cyclase, elevation of intracellular Ca2+, and stimulation of the mitogen-activated protein kinase (32–34). All three hormones significantly enhanced insulin release in the hybrid cells. The functional capacity of the ion channels was further supported by the significant inhibitory effects of diazoxide, which acts by opening the K-ATP channel repolarizing the beta cell membrane (35), and both verapamil and EGTA, which block the influx of Ca2+. These functional effects elicited via the K-ATP and voltage-dependent L-type calcium channels reflect the strong expression of components of these channels in novel hybrid cells by RT-PCR. Indeed, significant enhancement of [Ca2+]i via calcium influx was observed after acute stimulation with 16.7 mm glucose, alanine, or KCl as detected by fluorometric scanning. These observations suggest that proximal signaling pathways including glucose sensing are intact in these cells, although overall secretory responses are modest when compared with isolated human islets. Further studies are required to determine whether differences in the distal exocytotic machinery, including granule biogenesis and trafficking, contribute to this phenomenon.
These in vitro studies demonstrate that the three clonal human beta cell lines have functional, intact mechanisms to respond to glucose and other modulators of insulin release, also at high passage over extended periods in culture. It is also useful to examine whether these mechanisms remain intact in an in vivo environment, especially if such a cellular engineering approach is contemplated in potential clinical therapeutical settings. The 1.1B4 cell line, when implanted in streptozotocin-diabetic immunocompromised SCID mice, reduced plasma glucose concentrations over a 4-week period and quickly improved glucose tolerance when compared with non-implanted diabetic groups. This ability to rescue the diabetic state in vivo provides further evidence for successful production and release of bioactive insulin from these cells when placed in an in vivo environment.
In conclusion, these studies demonstrate for the first time the successful generation of human insulin-producing beta cell lines using electrofusion technology. Such an approach may also be applicable for future production of immortal human alpha and delta cells. Functional assessment of the hybrid beta cells produced indicates that they share many of the signaling pathways and functional features of human insulin-secreting cells. However, it must be realized that the extent of insulin production and secretory responses is inferior to primary human islets and equivalent or inferior to several rodent cell lines. Nevertheless, these electrofusion-derived cells are novel in terms of human origin and provide a unique opportunity for research on all aspects of the function, destruction, and transplantation of pancreatic beta cells.
Supplementary Material
Acknowledgment
We thank S. Vasu for images shown in Fig. 3.
This work was supported by grants from University of Ulster Research Strategy Funding, Diabetes UK, Innovation Ulster, and University of Ulster Vice Chancellor Studentships (to M. H. and H. G.-P.).

The on-line version of this article (available at http://www.jbc.org) contains supplemental Tables 1–4.
- HAT
- hypoxanthine/aminopterin/thymidine
- IBMX
- isobutylmethylxanthine.
REFERENCES
- 1. Miyazaki J., Araki K., Yamato E., Ikegami H., Asano T., Shibasaki Y., Oka Y., Yamamura K. (1990) Endocrinology 127, 126–132 [DOI] [PubMed] [Google Scholar]
- 2. Hanahan D. (1985) Nature 315, 115–122 [DOI] [PubMed] [Google Scholar]
- 3. Radvanyi F., Christgau S., Baekkeskov S., Jolicoeur C., Hanahan D. (1993) Mol. Cell Biol. 13, 4223–4232 [DOI] [PMC free article] [PubMed] [Google Scholar]
- 4. Santerre R. F., Cook R. A., Crisel R. M., Sharp J. D., Schmidt R. J., Williams D. C., Wilson C. P. (1981) Proc. Natl. Acad. Sci. U.S.A. 78, 4339–4343 [DOI] [PMC free article] [PubMed] [Google Scholar]
- 5. Ashcroft S. J., Hammonds P., Harrison D. E. (1986) Diabetologia 29, 727–733 [DOI] [PubMed] [Google Scholar]
- 6. Chick W. L., Warren S., Chute R. N., Like A. A., Lauris V., Kitchen K. C. (1977) Proc. Natl. Acad. Sci. U.S.A. 74, 628–632 [DOI] [PMC free article] [PubMed] [Google Scholar]
- 7. McClenaghan N. H., Barnett C. R., Ah-Sing E., Abdel-Wahab Y. H., O'Harte F. P., Yoon T. W., Swanston-Flatt S. K., Flatt P. R. (1996) Diabetes. 45, 1132–1140 [DOI] [PubMed] [Google Scholar]
- 8. Asfari M., Janjic D., Meda P., Li G., Halban P. A., Wollheim C. B. (1992) Endocrinology 130, 167–178 [DOI] [PubMed] [Google Scholar]
- 9. Efrat S., Fleisher N. (1996) in Diabetes Mellitus: A Fundamental and Clinical Text (LeRoith D., Olefsky J. M., Taylor S. I. eds) pp. 438–443, Lippincott-Raven Publishers, Philadelphia [Google Scholar]
- 10. Wang S., Beattie G. M., Mally M. I., Cirulli V., Itkin-Ansari P., Lopez A. D., Hayek A., Levine F. (1997) Cell Transplant. 6, 59–67 [DOI] [PubMed] [Google Scholar]
- 11. Gueli N., Toto A., Palmieri G., Carmenini G., Delpino A. (1987) J. Exp. Clin. Cancer Res. 6, 281–285 [Google Scholar]
- 12. Thivolet C., Chatelain P., Haftek M., Durand A., Pugeat M. (1986) C. R. Acad. Sci. III. 303, 381–386 [PubMed] [Google Scholar]
- 13. Thivolet C. H., Demidem A., Haftek M., Durand A., Bertrand J. (1988) Diabetes 37, 1279–1286 [DOI] [PubMed] [Google Scholar]
- 14. Gartner W., Koc F., Nabokikh A., Daneva T., Niederle B., Luger A., Wagner L. (2006) Neuroendocrinology 83, 123–130 [DOI] [PubMed] [Google Scholar]
- 15. Soldevila G., Buscema M., Marini V., Sutton R., James R. F., Bloom S. R., Robertson R. P., Mirakian R., Pujol-Borrell R., Bottazzo G. F. (1991) J. Autoimmun. 4, 381–396 [DOI] [PubMed] [Google Scholar]
- 16. Zalzman M., Anker-Kitai L., Efrat S. (2005) Diabetes 54, 2568–2575 [DOI] [PubMed] [Google Scholar]
- 17. MacFarlane W. M., Chapman J. C., Shepherd R. M., Hashmi M. N., Kamimura N., Cosgrove K. E., O'Brien R. E., Barnes P. D., Hart A. W., Docherty H. M., Lindley K. J., Aynsley-Green A., James R. F., Docherty K., Dunne M. J. (1999) J. Biol. Chem. 274, 34059–34066 [DOI] [PubMed] [Google Scholar]
- 18. de la Tour D., Halvorsen T., Demeterco C., Tyrberg B., Itkin-Ansari P., Loy M., Yoo S. J., Hao E., Bossie S., Levine F. (2001) Mol. Endocrinol. 15, 476–483 [DOI] [PubMed] [Google Scholar]
- 19. Narushima M., Kobayashi N., Okitsu T., Tanaka Y., Li S. A., Chen Y., Miki A., Tanaka K., Nakaji S., Takei K., Gutierrez A. S., Rivas-Carrillo J. D., Navarro-Alvarez N., Jun H. S., Westerman K. A., Noguchi H., Lakey J. R., Leboulch P., Tanaka N., Yoon J. W. (2005) Nat. Biotechnol. 23, 1274–1282 [DOI] [PubMed] [Google Scholar]
- 20. Lieber M., Mazzetta J., Nelson-Rees W., Kaplan M., Todaro G. (1975) Int. J. Cancer. 15, 741–747 [DOI] [PubMed] [Google Scholar]
- 21. Flatt P. R., Bailey C. J. (1981) Diabetologia 20, 573–577 [DOI] [PubMed] [Google Scholar]
- 22. Karnovsky M. J. (1965) J. Cell Biol. 27, 137–138 [Google Scholar]
- 23. Lenzen S., Tiedge M., Panten U. (1986) Biochem. Pharmacol. 35, 2841–2843 [DOI] [PubMed] [Google Scholar]
- 24. Jarrett R. J., Keen H. (1966) Lancet 1, 633–635 [DOI] [PubMed] [Google Scholar]
- 25. Miguel J. C., Patterson S., Abdel-Wahab Y. H., Mathias P. C., Flatt P. R. (2004) Cell Calcium 36, 43–50 [DOI] [PubMed] [Google Scholar]
- 26. Tsang W. G., Zheng T., Wang Y., Tang J., Rind H. B., Francki A., Bufius N. (2007) Transplantation 83, 685–693 [DOI] [PubMed] [Google Scholar]
- 27. Hellman B., Gylfe E., Grapengissar E., Lund P. E., Marcstrom A. (1992) in Nutrient Regulation of Insulin Secretion (Flatt P. R. ed) pp. 213–246, Portland Press, London [Google Scholar]
- 28. Meglasson M. D., Matschinsky F. M. (1986) Diabetes. Metab. Rev. 2, 163–214 [DOI] [PubMed] [Google Scholar]
- 29. Ohneda M., Johnson J. H., Lee Y. H., Nagasawa Y., Unger R. H. (1994) Am. J. Physiol. 267, E9668–E9674 [DOI] [PubMed] [Google Scholar]
- 30. Lenzen S., Tiedge M. (1994) Biochem. Soc. Trans. 22, 1–6 [DOI] [PubMed] [Google Scholar]
- 31. Kramer W., Müller G., Geisen K. (1996) Horm. Metab. Res. 28, 464–468 [DOI] [PubMed] [Google Scholar]
- 32. Ehses J. A., Lee S. S., Pederson R. A., McIntosh C. H. (2001) J. Biol. Chem. 276, 23667–23673 [DOI] [PubMed] [Google Scholar]
- 33. Farilla L., Bulotta A., Hirshberg B., Li, Calzi S., Khoury N., Noushmehr H., Bertolotto C., Di Mario U., Harlan D. M., Perfetti R. (2003) Endocrinology 144, 5149–5158 [DOI] [PubMed] [Google Scholar]
- 34. Burnham D. B., Williams J. A. (1982) J. Biol. Chem. 257, 10523–10528 [PubMed] [Google Scholar]
- 35. Henquin J. C., Debuyser A., Drews G., Plant T. D. (1992) in Nutrient Regulation of Insulin Secretion (Flatt P. R. ed) pp. 172–192, Portland Press, London [Google Scholar]
Associated Data
This section collects any data citations, data availability statements, or supplementary materials included in this article.


