Abstract
Both β-galactosidase (GAL) and β-glucuronidase (GUS) are tetrameric enzymes used widely as reporter proteins. However, little is known about the folding and assembly of these enzymes. Although the refolding kinetics of GAL from a denatured enzyme have been reported, it is not known how the kinetics differ when coupled with a protein translation reaction. Elucidating the assembly kinetics of GAL and GUS when coupled with protein translation will illustrate the differences between these two reporter proteins and also the assembly process under conditions more relevant to those in vivo. In this study, we used an in vitro translation/transcription system to synthesize GAL and GUS, measured the time development of the activity and oligomerization state of these enzymes, and determined the rate constants of the monomer to tetramer assembly process. We found that at similar concentrations, GAL assembles into tetramers faster than GUS. The rate constant of monomer to dimer assembly of GAL was 50-fold faster when coupled with protein translation than that of refolding from the denatured state. Furthermore, GAL synthesis was found to lack the rate-limiting step in the assembly process, whereas GUS has two rate-limiting steps: monomer to dimer assembly and dimer to tetramer assembly. The consequence of these differences when used as reporter proteins is discussed.
Keywords: Enzymes, Kinetics, Protein Assembly, Protein Self-assembly, Protein Synthesis, Cell Free Protein Translation, Chemical Labeling, Reporter Proteins
Introduction
β-galactosidase (GAL)2 and β-glucuronidase (GUS) are tetrameric enzymes that hydrolyze β-D-galactose and β-D-glucuronide, respectively. Both enzymes exhibit their catalytic activity only when they form tetramers (1, 2). These enzymes are used widely as reporter proteins (3–5) as they are known to be relatively stable, exhibit activity under various conditions, and because various colorimetric and fluorescent substrates are available (6–8).
Because of their physiological and practical importance, GAL and GUS have been well characterized in various aspects (1, 2, 9), but little is known about their folding and assembly kinetics. The only exception is the refolding kinetics of GAL from a denatured state generated using urea. GAL has been reported to have two rate-limiting steps, one of which is the assembly of monomers into dimers and the other is the conformational change of dimers before tetramer formation (10). On the other hand, it is not known how the kinetics differ when the assembly of monomers to tetramers is coupled with the protein synthesis reaction, which is more biologically relevant. Neither refolding nor assembly of GUS when coupled with protein translation has been reported. For a number of proteins (mostly monomeric proteins), it has been that refolding and cotranslational folding are different (11, 12). In particular, proteins are known to fold during translation, i.e. on the ribosome. Elucidation of the assembly kinetics of GAL and GUS coupled with protein translation will illustrate the differences between these two commonly used reporter proteins and will also provide insight into the assembly process under conditions more relevant to those in vivo.
Here, we report the kinetic analysis of GAL and GUS assembly when coupled with protein translation. We used an in vitro translation/transcription (IVTT) system (13, 14) to synthesize GAL and GUS, measured the time course of the enzymatic activity and oligomerization states of these enzymes, and determined the rate constants of the monomer to tetramer assembly process. From these results, monomer to dimer assembly of GAL, which was found to be one of the rate-limiting steps in the refolding experiment (10), was shown to be at least 50-fold faster in the coupled reaction. Both monomer to dimer and dimer to tetramer assembly were found to be the rate-limiting steps for GUS. Finally, the significance of these results is discussed.
EXPERIMENTAL PROCEDURES
Plasmids and Reagents
Plasmids encoding GAL and GUS (pET-lacZ and pET-gusA, respectively) were constructed previously (15). Plasmids encoding GAL-SNAP and GUS-SNAP (pET-lacZ-SNAP and pET-gusA-SNAP, respectively) were constructed by PCR amplification of the SNAP tag sequence (16, 17) from pT7-SNAP (New England Biolabs) with Phusion polymerase (Finnzymes) using primers hindIII-SNAP (5′-TATATTAAGCTTATGGACAAAGATTGCGAAATG-3′) and T7R (5′-GCTAGTTATTGCTCAGCGG-3′) according to manufacturer's instructions, digested with HindIII and AvaI, and cloned into the HindIII and AvaI sites of pET-lacZ and pET-gusA, respectively. Templates used for IVTT were prepared by PCR amplification of the corresponding plasmid using T7F (5′-TAATACGACTCACTATAGGG-3′) and T7R primers using PYRObest DNA polymerase (Takara) according to the manufacturer's instructions and purified using a QIAquick PCR purification kit (Qiagen). Concentrations were determined from the absorbance at 260 nm.
In Vitro Transcription and Translation System
The IVTT used in this study was a reconstituted in vitro translation/transcription system (PURE system (18)) modified according to our previous studies (19, 20). The composition was described previously (15). For the GAL and GUS synthesis reaction, template DNA (PCR product) was added to the IVTT supplemented with 4 units of RNasin (Promega), 50 nm Alexa Fluor 647 as an internal reference dye (Invitrogen), and 5 μm fluorescent substrate TokyoGreen-bgal (TG-bgal) or TokyoGreen-GlcU (TG-GlcU) (Sekisui Medical) (21). Neither TG-bgal nor TG-GlcU is fluorescent before hydrolysis, but both yield TG that emits green fluorescence as a result of hydrolysis. Real-time measurements were carried out using a real-time PCR system (Mx3005P, Agilent). Filter sets used for measuring the fluorescence intensities of TG and Alexa Fluor 647 were 492/516 or 492/610 and 635/665 nm (excitation/emission wavelength), respectively.
Size Exclusion Chromatography
DNA encoding GAL-SNAP or GUS-SNAP was added to the IVTT, incubated at 37 °C, and diluted 10-fold with 70S buffer (20 mm HEPES-KOH (pH 7.6), 6 mm Mg (OAc)2, 250 mm KCl, 7 mm 2-mercaptoethanol) supplemented with 0.1% BSA, 20 μm tetracycline, and 1 μm SNAP-Surface 488 (New England Biolabs). After incubation for longer than 2 h on ice, the samples were subjected to size exclusion chromatography using a TSK-GEL G3000-PWXL (Tosoh) column on an HPLC instrument (Prominence, Shimadzu) with a flow rate of 1 ml/min using 70S buffer supplemented with 0.005% Tween 20. Note that incubation on ice did not alter the oligomerization state for at least 24 h (not shown). The fluorescence signal was detected by monitoring excitation and emission at wavelengths of 500 and 524 nm, respectively. To measure the enzymatic activity of the eluted fractions, 50 μm TG-bgal or TG-GlcU was added to the fractionated samples and incubated at 37 °C.
Kinetics of Tetramer Assembly Coupled with Protein Translation
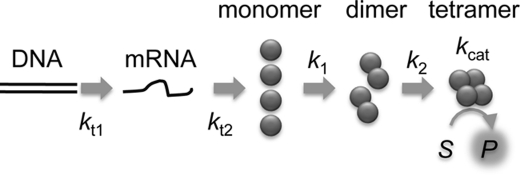
The model shown in Fig. 1 can be written as below:
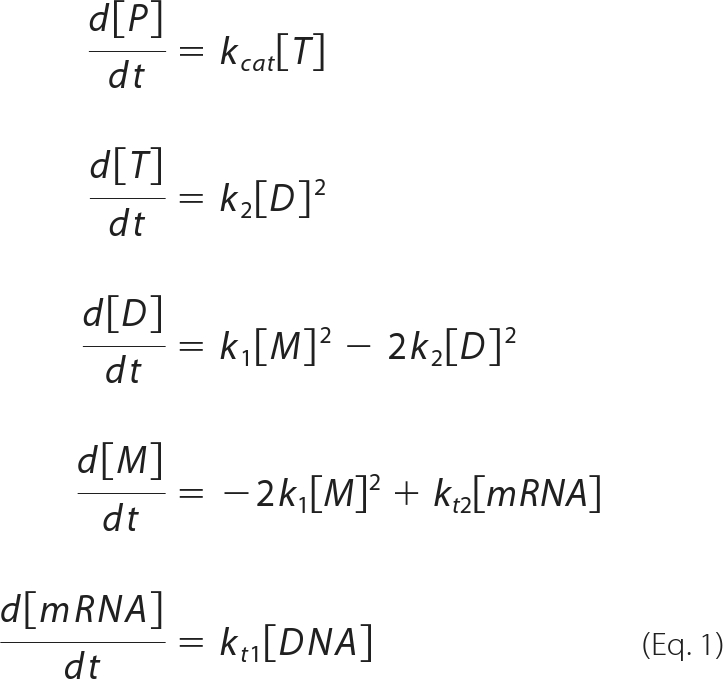 |
where [P], [M], [D], [T], [mRNA], and [DNA] represent the concentrations of product, monomer, dimer, tetramer, mRNA, and DNA, respectively. The rate constants are as shown in Fig. 1. Note that the equations are based on the assumption that the effect of fluorescent substrate depletion can be ignored. Under conditions where the monomer is produced by the translation reaction, although the dimer and tetramer are hardly present, we consider the flow from upstream to be larger than that downstream. Thus, equation 1 can be written as:
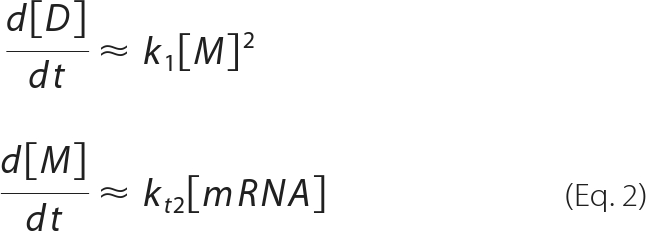 |
From equation 2, equation 1 can be written as:
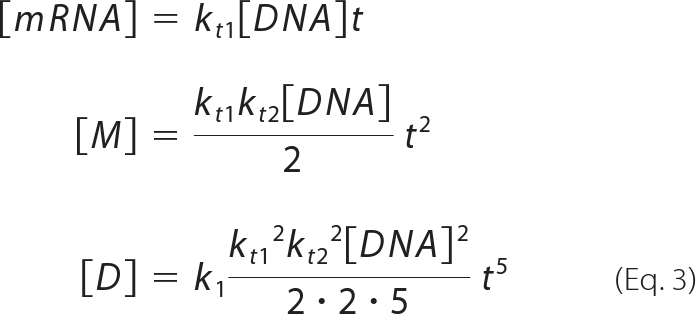 |
and thus
Under these conditions, d[T]/dt is in linear relationship with [DNA]4 and is therefore a fourth-order reaction. In our experiment, we used the fluorescent substrates TG-bgal and TG-GlcU, both of which yield TG as a result of hydrolysis, to detect tetramer production. As the TG concentration [P] is linearly related to the fluorescence intensity (FI) and from equations 1 and 4,
 |
When the assembly reaction is fast and d[M]/dt = d[D]/dt = 0, equation 1 can be written as:
 |
and thus
 |
d[T]/dt is linearly related to [DNA] and is therefore a first-order reaction. Moreover, similar to equation 5, FI and [DNA] have the following relationship:
 |
When [M], [D], and the translation rate kt2[mRNA] are known, k1 and k2 can be determined from the equations obtained by introducing d[M]/dt = d[D]/dt = 0 to equation 1:
 |
FIGURE 1.
Schematic of the GAL and GUS synthesis reaction. DNA encoding GAL or GUS was added to the reconstituted IVTT system. The presence of fluorescent substrate, TG-bgal or TG-GlcU, both of which emit green fluorescence only after hydrolysis, allowed detection of tetrameric GAL and GUS, respectively.
Kinetics of Tetramer Assembly Uncoupled with Protein Translation
When the assembly reaction is not coupled with protein translation, the mass balance equations are written as:
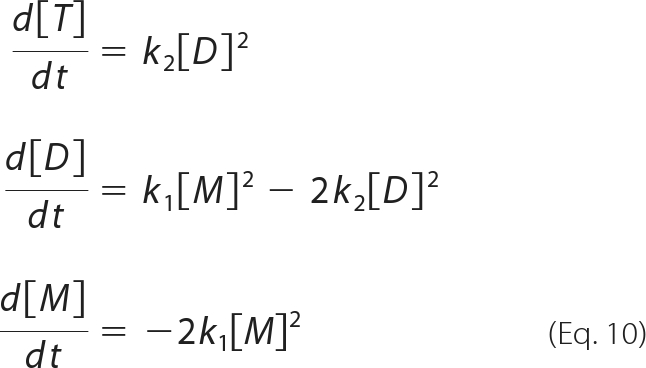 |
From the third equation of equation 10, the time course of [M] can be written as:
 |
k1 can therefore be determined by fitting the time course of changes in monomer concentration. Furthermore, we can obtain k2 from the relationship between d[T]/dt and [D]2 (equation 10). Global fitting was carried out using Igor, and other calculations were performed with Mathematica.
RESULTS
Both GAL and GUS Syntheses are Multistep Reactions
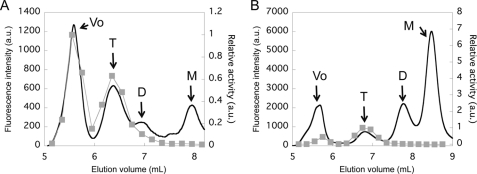
To investigate the kinetics of GAL and GUS assembly when coupled with protein translation, we used a reconstituted IVTT system. When synthesizing GAL and GUS, the fluorescent substrates TG-bgal and TG-GlcU, which emit green fluorescence only after hydrolysis (21), were added to the reaction mix, respectively (Fig. 1). As reported previously (22, 23), GAL and GUS both assemble into tetramers, starting from monomer to dimer, followed by dimer to tetramer, which we also showed by size exclusion chromatography (Fig. 4). Using the fluorescent substrate in IVTT, production of active enzyme, i.e. tetramer, can be traced as the increase in fluorescence signal derived from the hydrolyzed product TG.
FIGURE 4.
Size exclusion chromatography of GAL-SNAP (A) and GUS-SNAP (B) synthesized in vitro at 37 °C for 2 h. The black lines show the fluorescence signal (left axis) and gray squares show the enzymatic activity of eluted fraction (right axis). Maximum activity was defined as 1. The elution volumes of void volume (Vo), tetramer (T), dimer (D), and monomer (M) estimated from the molecular weight standards (supplemental Fig. S4) are indicated.
We added DNA encoding GAL and GUS under the control of the T7 promoter to the IVTT system and followed the increase in the fluorescence signal. Fig. 2, A and B, shows the time course data of GAL and GUS synthesis, respectively. Both reactions showed a concave curve, which was interpreted as a consequence of a multistep reaction (e.g. transcription, translation, assembly, and substrate hydrolysis) (see Fig. 1 and equations under “Experimental Procedures”).
FIGURE 2.
Representative data of the time courses of GAL and GUS synthesis reactions in vitro. Progress of the synthesis reaction was detected by the hydrolysis of fluorescent substrate (TG-bgal and TG-GlcU) present in the IVTT system. GAL (A) and GUS (B) synthesis reactions with different DNA concentrations (GAL: 0.3, 0.25, 0.2, 0.15, 0.1, 0.05, and 0 nm; GUS: 0.15, 0.12, 0.1, 0.8, 0.6, 0.5, and 0 nm). The time courses shown are those after subtracting that of no DNA. Fluorescence signals began to be seen earlier with higher DNA concentrations. Excitation and emission wavelengths used for A and B were 492/610 and 492/516 nm, respectively. C, the second derivative of the time course data (A and B) with respect to time gave the relative tetramer synthesis rate. The synthesis rate of GAL at 24 min (gray circles) and GUS at 35 min (●) was plotted against DNA concentration added. Curves fitted with Log(d2FI/dt2) = Log A + n Log[DNA] are shown, where A is a constant and n is the reaction order. We obtained n = 0.94 ± 0.05 and n = 3.7 ± 0.3 (from two independent experiments) with GAL and GUS, respectively. Note that similar trends were observed at different time points (at time points where the fluorescence signals were detectable and the effect of substrate depletion could be neglected).
GAL and GUS Syntheses are First- and Fourth-order Reactions, Respectively
When we synthesized GFP as a representative monomeric protein with the IVTT system used in this study, we found a linear relationship between the rate of fluorescence increase d[FI]/dt (∝d[GFP]/dt) and DNA concentration [DNA], where [GFP] is the GFP concentration. Thus, when synthesizing monomeric proteins, the IVTT system itself does not have any high-order processes and exhibits a first-order reaction (i.e. d[GFP]/dt∝[DNA]1) (supplemental Fig. S1). With the reaction shown in Fig. 1, however, the reaction order can be different depending on the values of the rate constants. For example, when monomer to tetramer assembly is extremely rapid so that monomer and dimer synthesis rate reach a steady state, the rate of tetramer synthesis (d[T]/dt) is linearly related to [DNA] and is thus a first-order reaction (equation 7). On the other hand, when the assembly is slow, it can become a fourth-order reaction (equation 4). For details, see the equations under “Experimental Procedures.” We estimated the reaction order, which is the relationship between d[T]/dt and [DNA], from the data shown in Fig. 2, A and B.
The rate in the increase of the fluorescence signal d[FI]/dt is linearly related to the tetramer concentration [T]. Thus, d2FI/dt2 is in a linear relationship with d[T]/dt. We investigated the relationship between d2FI/dt2 and [DNA] to obtain n, the reaction order (d2FI/dt2∝[DNA]n, Fig. 2C). At the time when the fluorescence signal is detectable and the effect of fluorescent substrate depletion can be ignored, d2FI/dt2 and [DNA] were in linear (n = 0.94 ± 0.05) and high order (n = 3.7 ± 0.3) relationships with GAL and GUS, respectively. From these results, we concluded that the GAL and GUS reactions can be approximated as first- and fourth-order reactions, respectively. These results suggest that as soon as the GAL monomer is synthesized, it assembles into tetramers, whereas assembly of GUS occurs much more slowly. The reaction order depends not only on the rate constants of assembly but also on the protein concentration. As the yields of GAL and GUS are both in the order of 100 nm (see below), these differences are likely due to the rate constants of the assembly process, which we confirm below.
The Assembly Process of GAL Is Faster Than That of GUS
The results shown in Fig. 2 suggested that tetramer assembly of GAL is faster than that of GUS. To further confirm this assumption, we first carried out the protein translation reaction for 30 min and terminated the reaction by adding tetracycline. We then measured the development of active enzyme concentration of the terminated mix after various dilutions (Fig. 3).
FIGURE 3.
Time course of the GAL and GUS assembly reaction. GAL (A) and GUS (C) were synthesized in vitro for 30 min, and the reaction was terminated by adding tetracycline. Synthesis reactions were performed with 0.1 and 1 nm DNA with GAL and GUS, respectively. Terminated reaction mixtures were diluted 1-, 1.33-, 2-, and 4-fold for GAL, and 1-, 1.25-, 1.67-, 2-, and 2.5-fold for GUS with IVTT mixture and mixed with the fluorescent substrate. The time courses of hydrolysis reactions are shown. Fluorescence signals increase faster with higher concentrations. B, relationship between the initial velocity obtained from A and relative total monomer concentration.
With GAL, the time course of the change in fluorescence was linear (Fig. 3A), indicating that the concentration of active enzyme did not change during the measurement. The slope of the time course and the dilution rate also showed a linear relationship (Fig. 3B). These results suggest that the monomer to tetramer assembly reaction had stopped and had likely been completed already at the time of termination of the synthesis reaction. As shown below (Fig. 5), this is because the monomer to tetramer assembly occurs so rapidly that synthesized GAL appeared predominantly as a tetramer during the protein synthesis reaction.
FIGURE 5.
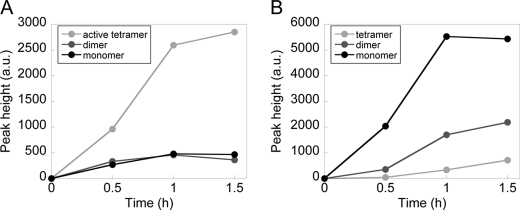
Time courses of GAL-SNAP and GUS-SNAP synthesis reactions analyzed by size exclusion chromatography. Time courses of monomer, dimer, and tetramer formation of GAL (A) and GUS (B). The value of the active tetramer in A was estimated as the sum of the peak height of Vo and the tetramer of GAL-SNAP.
With GUS, we found a concave curve, indicating an increase in the active enzyme concentration (Fig. 3C). These results suggest that monomer to tetramer assembly reaction had not completed at the time of termination of the synthesis reaction and that the assembly was proceeding during the measurement. Consistent with the results shown in Fig. 2, assembly of GAL into a tetramer is likely to be faster than that of GUS.
The SNAP Tag Allows Detection of the Oligomerization State
We have shown that GAL is likely to assemble to tetramers faster than GUS on the basis of the results of the activity assay using fluorescent substrates (Figs. 2 and 3). To further confirm this suggestion, we next investigated the oligomerization states of both GAL and GUS during the synthesis reaction. For this purpose, we constructed fusion proteins, GAL-SNAP and GUS-SNAP, with a SNAP tag fused to the C terminus of each enzyme. The SNAP tag is a 20-kDa tag sequence that reacts with the suicide substrate O6-benzylguanine to form an irreversible covalent bond (16, 17). Using this chemistry, we introduced a fluorescent molecule into GAL and GUS, thus enabling the detection of synthesized GAL and GUS by size exclusion chromatography without being affected by the various proteins and nucleic acids present in the IVTT system.
We first investigated whether the addition of the SNAP tag affected the properties of GAL and GUS. First, the kinetic rate constants kcat and Km were unaffected by addition of the SNAP tag (supplemental Fig. S3). Second, the DNA concentration dependence of the synthesis reaction with and without the SNAP tag was investigated (supplemental Fig. S2). We found that the addition of the SNAP tag did not affect the reaction order: GAL-SNAP and GUS-SNAP exhibit first- and fourth-order reactions, respectively. Therefore, we proceeded to investigate the oligomerization state of GAL-SNAP and GUS-SNAP. Note that the results shown in supplemental Fig. S2 also indicate that although the rate constants of the GAL and GAL-SNAP synthesis reactions are nearly identical, those of the GUS and GUS-SNAP synthesis reaction could be different. These points are discussed in detail below.
GAL-SNAP and GUS-SNAP were synthesized using IVTT, labeled with Alexa Fluor 488, and analyzed by size exclusion chromatography (Fig. 4). The chromatogram recorded by measuring the fluorescence signal of Alexa Fluor 488 showed four peaks with both GAL-SNAP and GUS-SNAP (Fig. 4, A and B, black lines). Estimating their size from molecular weight standards, the latter three peaks were found to exhibit the apparent sizes of tetramer (T), dimer (D), and monomer (M), respectively (supplemental Fig. S4). The first peak was at the void volume (Vo). We also measured the enzymatic activity of each fraction eluted from the column (gray squares) and found the activity only in Vo and tetramer fractions with both GAL-SNAP and GUS-SNAP. It is also important to note that the absence of activity in the monomer and dimer fraction indicated that the tetramer assembly reaction was terminated under conditions of low concentration at 4 °C. Furthermore, as the peak height and enzyme concentration are linearly related (supplemental Fig. S4C), the synthesized yield in terms of total monomer concentration of GAL-SNAP (145 nm) was found to be 4.2-fold lower than that of GUS-SNAP (600 nm), probably because of their size difference.
Peaks that appeared at Vo are unlikely to be aggregates but nascent chains stalled on the ribosome. This is because when the synthesized products were treated with RNase, peaks at Vo disappeared, whereas the peaks of tetramer and dimer increased with GAL and GUS, respectively (supplemental Fig. S5). Previous studies indicated that GAL folds, assembles into tetramers, and exhibits activity on the ribosome (24, 25), consistent with our observations. For the latter analysis, we used the amounts of active tetrameric GAL as the sums of the peak at Vo and tetramer and that of GUS as only the tetramer. This is because the specific activity (ratio of fluorescence intensity and activity) of GAL at Vo and tetramer is almost identical, whereas the activity at Vo with GUS is small and negligible.
Estimating the Rate Constants of GAL Assembly
To estimate the rate constants, we investigated the time courses of the oligomerization of GAL-SNAP and GUS-SNAP during the synthesis reaction (Fig. 5). With GAL-SNAP, monomer and dimer peaks did not change after 30 min, and only that of active tetramer (sum of Vo and tetramer) increased (Fig. 5A). These results showed that assembly processes are rapid and that synthesized monomers are quickly converted into tetramer. With GUS-SNAP, the amount of tetramer was significantly lower than that of monomer (Fig. 5B), indicating that the rate of assembly is slower than that of GAL. These results were consistent with those shown in Figs. 2 and 3.
The rate constants k1 and k2 of GAL-SNAP can be estimated from the data shown in Fig. 5A. As the levels of monomer and dimer did not increase after 30 min, whereas active tetramer continued to increase (Fig. 5A), we assumed that monomer and dimer synthesis rates are at steady state (i.e. d[M]/dt = d[D]/dt = 0) and obtained equation 6. After converting the peak height into concentrations (supplemental Fig. S4C), we estimated kt2[mRNA]/4 as the synthesis rate of active tetramer at 30 min and substituted this value together with [M] and [D] at 30 min to equation 6 and obtained k1 = 2.2 ± 1.8 × 10⁵ (M−1s−1), k2 = 1.2 ± 0.03 × 10⁵ (M−1s−1).
Estimating the Rate Constants of GUS Assembly
To estimate the rate constants of GUS-SNAP, we investigated the time course of the assembly process (Fig. 6). As in Fig. 3, we carried out the synthesis reaction for 30 min and terminated the reaction by adding tetracycline. This allows simplification of the kinetic model. As the assembly of GUS is a high-order reaction, simplifying the reaction model enables us to easily determine the rate constants. The terminated mix was diluted 1-, 1.5-, or 2-fold, and the assembly reaction was followed by size exclusion chromatography. The time courses of changes in monomer, dimer, and tetramer levels are shown in Fig. 6. Note that a similar strategy cannot be used to estimate the rate constants of GAL assembly. This is because the assembly occurs so rapidly that it is completed immediately after termination of the translation reaction (Fig. 3, A and B).
FIGURE 6.
Time courses of the GUS assembly reaction analyzed by size exclusion chromatography. Time courses of monomer (A), dimer (B), and tretramer (C) formation. Data from the top show the time courses of 1 (gray circles), 1.5 (dark gray circles), and 2-fold (●) diluted terminated mix, respectively. The lines in A are those fitted with equation 11, and the lines in B and C are the joint lines. k1 was estimated from the fitting, which was then converted into the appropriate dimension using the relationship between peak height and concentration (supplemental Fig. S4C).
As the protein synthesis reaction was terminated, the time course of changes in monomer level can be described with equation 11. By fitting the data with equation 11, using k1 as a global parameter, we obtained k1 = 57.7 ± 8.0 (M−1s−1) (Fig. 6A, line). From the initial velocity of the tetramer production rate and the dimer concentration at the initial time point (equation 10), we obtained k2 = 542 ± 181 (M−1s−1). As k2/k1 = 9.4, dimer to tetramer assembly was one order of magnitude faster than that of monomer to dimer. The constants of GUS were significantly smaller than those of GAL, consistent with the observations shown in Figs. 2 and 3.
DISCUSSION
In this study, we investigated the assembly kinetics of two tetrameric enzymes, GAL and GUS, both of which are common reporter proteins, when coupled with the protein translation reaction. We found that at similar concentrations, GAL assembles into tetramers faster than GUS, and the rate constants were determined. Furthermore, GAL and GUS synthesis reactions were first- and fourth-order reactions, respectively. These results indicated the lack of a rate-limiting step in the assembly process of GAL, whereas GUS had two rate-limiting steps: monomer to dimer assembly and dimer to tetramer assembly.
While the SNAP tag allows investigation of the oligomerization state of the enzymes, it could affect the rate constants and/or the reaction order of GAL and GUS synthesis reactions. GAL and GAL-SNAP synthesis reactions showed almost identical time courses (supplemental Fig. S2), indicating that the reaction order and the rate constants are identical for these two. On the other hand, the difference between GUS and GUS-SNAP was not negligible (supplemental Fig. S2). Although the reaction order was not affected, the rate constants may result in up to a 40-fold higher k2 or a 6.3-fold higher k1 with GUS compared with GUS-SNAP. The mathematical basis of these conclusions is described in supplemental Fig. S2. Nevertheless, our conclusions that the rate constant of GUS is smaller than that of GAL and that GUS is a fourth-order reaction remain valid.
We did not consider the reverse reaction (k-1 and k-2) in our kinetic model (Fig. 1), i.e. dimer to monomer and tetramer to dimer dissociation. We first discuss the validity of this assumption. The value of k-2 was experimentally confirmed to be negligible. Using purified tetramers of GAL and GUS, we observed a linear relationship between enzyme concentration and fluorescent substrate hydrolysis rate down to the pm concentration range (data not shown), indicating that tetramer dissociation is negligible.
Next, we discuss the value k-1. First, the previous kinetic study of GAL refolding could be explained without considering k-1 and k-2 (10), suggesting the validity of our kinetic model shown in Fig. 1. Furthermore, as d[M]/dt = d[D]/dt = 0 with GAL, k2 is unchanged even if we consider k-1 (see equation 9). Thus, k2 is not affected by k-1. To estimate k1, we used the relationship 2k1[M]2 = kt2[mRNA] (equation 9). When the dissociation of dimer to monomer (k-1[D]) contributes largely to the steady state, this equation can be written as 2k1[M]2 = kt2[mRNA]+k-1[D]. Therefore, k1 may be underestimated when ignoring k-1. Nevertheless, our conclusion that the rate constants of GAL assembly are larger than those of GUS remains valid. For GUS, k2 is unchanged even if we consider k-1 (see equation 1), and thus k2 is not affected by k-1. If k-1[D] has a significant contribution to the dynamics of dimer formation, and thus the transition between monomer and dimer reaches equilibrium, dimer concentration should decrease over time immediately after terminating the protein translation reaction, which was not the case (Fig. 6B). Conversely, if k-1[D] is negligible, we can assume d[D]/dt = 0, consistent with the observation that dimer concentration changed little over time. Based on this assumption and from equation 1, we obtained k2/k1 = 6.8. The similarity of k2/k1 value estimated by different methods indicates the validity of the kinetic model shown in Fig. 1 and the obtained rate constants.
Kinetic analysis of GAL refolding, starting from the denatured state of GAL generated using urea, showed that it is a second-order reaction at concentrations around 100 nm (10). One of the rate-limiting steps was shown to be monomer to dimer assembly. The rate constant of this step was reported to be k1-refold = 4.3 × 10³ (M−1s−1), whereas we found that k1 was 2.2 × 10⁵ (M−1s−1). Thus, an ∼50-fold difference in the rate constant was observed with refolding experiments and when coupled with the protein translation reaction. One possible explanation for this difference involves the temperature at which the experiments were carried out. The experiments were carried out at 20 °C in the previous study (10) but at 37 °C in this study. To estimate the effects of the temperature difference, we assumed that the rate constants follow the Arrhenius equation. From the reported values of activation energies (20–40 kJ/mol) (26), the difference of 17 °C only yielded a 1.5–2.5-fold difference in the rate constants and was not sufficient to explain the 50-fold difference observed here.
Instead, it was more likely due to differences in the conformation of monomers. It has been shown previously that GAL already starts to fold on the ribosome by using conformation-specific antibodies (24, 25). From these observations, it is reasonable to suggest that GAL, which already has a certain native conformation (Mnative) on the ribosome, quickly assembles into dimers, whereas denatured monomeric GAL (Mdenatured) takes an intermediate conformation before forming Mnative. Alternatively, the folding pathway from Mdenatured to dimer may be completely different from that from Mnative to dimer.
Another possible explanation for the 50-fold difference in the rate constant is that the ribosome provides appropriate conditions for tetramer assembly. As shown in Fig. 4A, a large fraction of GAL tetramer exists on the ribosome. This observation suggests that tetramer assembly may occur predominantly on the ribosome and that free tetramers are mostly those released from the ribosome. That is, the estimated rate constants could be the rates of assembly on the ribosome. As the assembly on and off the ribosome could be completely different, this may be one of the reasons for the 50-fold difference in rate constants between our observations and the results of the refolding experiment. While very interesting, our data are not sufficient to confirm or refute this suggestion, as we are unable to distinguish whether the tetramers are formed on or off the ribosome.
With luciferase, the rate-limiting step observed in refolding from a chemically denatured state has been shown to be missing when coupled with the protein translation reaction (27). Furthermore, luciferase has been shown to fold significantly faster when coupled with translation compared with refolding experiments (28, 29). Our observations were similar to these, except that we used the tetrameric and reporter protein GAL.
We simulated the dynamics of GUS synthesis reaction in vivo using the obtained rate constants. Here, we assumed that 100 molecules of monomers are present in Escherichia coli cells with a cell volume of 1 femtoliter (i.e. 160 nm). In this case, within the doubling time (20 min) of E. coli, 0.001 molecules/cell of tetramer are produced. The number of GUS molecules in vivo has not been reported, and thus the validity of this value cannot be assessed. However, the numbers may be larger because of the presence of various chaperones (12) and/or the macromolecular crowding effects (30, 31). Note that the trigger factor is the only known chaperone present in the IVTT system used here. On the other hand, it is also possible that GUS assembly is slow, and as we have seen GAL and GUS exhibit first- and fourth-order reaction kinetics, respectively, in vivo. Below, we discuss the in vivo behavior of two reporter proteins, GAL and GUS, which exhibit different reaction order kinetics.
When the expression levels of GAL and GUS were increased (decreased) by 2-fold, the amounts of tetrameric GAL and GUS will increase (decrease) by 2 (= 21)- or 16 (= 24)-fold, respectively. The amount of tetrameric GAL responds linearly to the changes in total monomer concentration, whereas that of tetrameric GUS responds in a high-order manner. Therefore, GUS is highly sensitive to changes in the monomer concentration. It follows that when measuring the changes in expression level quantitatively, GAL is more suitable, whereas when aiming to detect small differences in expression level, the high sensitivity of GUS is useful. Note that the assembly reaction is concentration-dependent, and with increasing amount of monomer, the high sensitivity of GUS will be lost and will behave similarly to GAL.
To our knowledge, such differences between GAL and GUS in vivo have not been reported previously. Furthermore, whereas the in vivo properties of the high-order reaction derived from the self-assembly reaction have been discussed from a theoretical viewpoint (32, 33), the occurrence of such reactions in vivo has not yet been reported. Investigation of the in vivo dynamics of GAL and GUS synthesis, as well as experimental evaluation of high-order reactions because of the self-assembly reaction, will be interesting subjects for future studies.
Supplementary Material
Acknowledgments
We thank Ms. Hitomi Komai, Tomomi Sakamoto, and Mizuki Ohzawa for technical assistance.
This work was supported in part by the Global Centers of Excellence Program and the Special Coordination Funds for Promoting Science and Technology: Yuragi Project from the Ministry of Education, Culture, Sports, Science, and Technology, Japan.

The on-line version of this article (available at http://www.jbc.org) contains supplemental Figs. S1–S5.
- GAL
- β-galactosidase
- GUS
- β-glucuronidase
- IVTT
- in vitro transcription and translation
- TG-bgal
- 9-(4'-methoxy-2'-methylphenyl)-6-(β-d-galactopylanosyloxy)-xanthen-3-one
- TG-GlcU
- 9-(4'-methoxy-2'-methylphenyl)-6-oxo-6H-xanthen-3-yl-β-d-glucuronide sodium salt
- Vo
- void volume.
REFERENCES
- 1. Jacobson R. H., Zhang X. J., DuBose R. F., Matthews B. W. (1994) Nature 369, 761–766 [DOI] [PubMed] [Google Scholar]
- 2. Jain S., Drendel W. B., Chen Z. W., Mathews F. S., Sly W. S., Grubb J. H. (1996) Nat. Struct. Biol. 3, 375–381 [DOI] [PubMed] [Google Scholar]
- 3. Jefferson R. A., Burgess S. M., Hirsh D. (1986) Proc. Natl. Acad. Sci. U.S.A. 83, 8447–8451 [DOI] [PMC free article] [PubMed] [Google Scholar]
- 4. Lis J. T., Simon J. A., Sutton C. A. (1983) Cell 35, 403–410 [DOI] [PubMed] [Google Scholar]
- 5. Casadaban M. J., Cohen S. N. (1979) Proc. Natl. Acad. Sci. U.S.A. 76, 4530–4533 [DOI] [PMC free article] [PubMed] [Google Scholar]
- 6. Jain V. K. (1996) Methods Enzymol. 273, 319–331 [DOI] [PubMed] [Google Scholar]
- 7. Kiernan J. A. (2007) Biotech. Histochem. 82, 73–103 [DOI] [PubMed] [Google Scholar]
- 8. Naleway J. J. (1992) in GUS Protocols: Using the GUS Gene as a Reporter of Gene Expression (Gallagher S. R. ed) pp. 61–76, Academic Press, New York [Google Scholar]
- 9. Matsumura I., Wallingford J. B., Surana N. K., Vize P. D., Ellington A. D. (1999) Nat. Biotechnol. 17, 696–701 [DOI] [PubMed] [Google Scholar]
- 10. Nichtl A., Buchner J., Jaenicke R., Rudolph R., Scheibel T. (1998) J. Mol. Biol. 282, 1083–1091 [DOI] [PubMed] [Google Scholar]
- 11. Kramer G., Boehringer D., Ban N., Bukau B. (2009) Nat. Struct. Mol. Biol. 16, 589–597 [DOI] [PubMed] [Google Scholar]
- 12. Hartl F. U., Hayer-Hartl M. (2009) Nat. Struct. Mol. Biol. 16, 574–581 [DOI] [PubMed] [Google Scholar]
- 13. Endo Y., Sawasaki T. (2006) Curr. Opin. Biotechnol. 17, 373–380 [DOI] [PubMed] [Google Scholar]
- 14. Yokoyama S. (2003) Curr. Opin. Chem. Biol. 7, 39–43 [DOI] [PubMed] [Google Scholar]
- 15. Hosoda K., Sunami T., Kazuta Y., Matsuura T., Suzuki H., Yomo T. (2008) Langmuir 24, 13540–13548 [DOI] [PubMed] [Google Scholar]
- 16. Keppler A., Gendreizig S., Gronemeyer T., Pick H., Vogel H., Johnsson K. (2003) Nat. Biotechnol. 21, 86–89 [DOI] [PubMed] [Google Scholar]
- 17. Gronemeyer T., Godin G., Johnsson K. (2005) Curr. Opin. Biotechnol. 16, 453–458 [DOI] [PubMed] [Google Scholar]
- 18. Shimizu Y., Inoue A., Tomari Y., Suzuki T., Yokogawa T., Nishikawa K., Ueda T. (2001) Nat. Biotechnol. 19, 751–755 [DOI] [PubMed] [Google Scholar]
- 19. Matsuura T., Kazuta Y., Aita T., Adachi J., Yomo T. (2009) Mol. Syst. Biol. 5, 297. [DOI] [PMC free article] [PubMed] [Google Scholar]
- 20. Kazuta Y., Adachi J., Matsuura T., Ono N., Mori H., Yomo T. (2008) Mol. Cell. Proteomics 7, 1530–1540 [DOI] [PMC free article] [PubMed] [Google Scholar]
- 21. Urano Y., Kamiya M., Kanda K., Ueno T., Hirose K., Nagano T. (2005) J. Am. Chem. Soc. 127, 4888–4894 [DOI] [PubMed] [Google Scholar]
- 22. Blanco C., Nemoz G. (1987) Biochimie 69, 157–161 [DOI] [PubMed] [Google Scholar]
- 23. Cowie D. B., Spiegelman S., Roberts R. B., Duerksen J. D. (1961) Proc. Natl. Acad. Sci. U.S.A. 47, 114–122 [DOI] [PMC free article] [PubMed] [Google Scholar]
- 24. Hamlin J., Zabin I. (1972) Proc. Natl. Acad. Sci. U.S.A. 69, 412–416 [DOI] [PMC free article] [PubMed] [Google Scholar]
- 25. Kiho Y., Rich A. (1964) Proc. Natl. Acad. Sci. U.S.A. 51, 111–118 [DOI] [PMC free article] [PubMed] [Google Scholar]
- 26. Ecevit O., Khan M. A., Goss D. J. (2010) Biochemistry 49, 2627–2635 [DOI] [PMC free article] [PubMed] [Google Scholar]
- 27. Fedorov A. N., Baldwin T. O. (1999) J. Mol. Biol. 294, 579–586 [DOI] [PubMed] [Google Scholar]
- 28. Kolb V. A., Makeyev E. V., Spirin A. S. (2000) J. Biol. Chem. 275, 16597–16601 [DOI] [PubMed] [Google Scholar]
- 29. Svetlov M. S., Kommer A., Kolb V. A., Spirin A. S. (2006) Protein Sci. 15, 242–247 [DOI] [PMC free article] [PubMed] [Google Scholar]
- 30. Minton A. P. (2006) J. Cell Sci. 119, 2863–2869 [DOI] [PubMed] [Google Scholar]
- 31. Zhou H. X., Rivas G., Minton A. P. (2008) Annu. Rev. Biophys. 37, 375–397 [DOI] [PMC free article] [PubMed] [Google Scholar]
- 32. Kuthan H. (2001) Prog. Biophys. Mol. Biol. 75, 1–17 [DOI] [PubMed] [Google Scholar]
- 33. Olsen S. N., Ramløv H., Westh P. (2007) Comp. Biochem. Physiol. A Mol. Integr. Physiol. 148, 339–345 [DOI] [PubMed] [Google Scholar]
Associated Data
This section collects any data citations, data availability statements, or supplementary materials included in this article.


