Abstract
RGS13, a member of the regulator of G protein signaling (RGS) family, inhibits G protein-coupled receptor signaling in B cells and mast cells (MCs) and suppresses IgE-antigen-induced MC degranulation and anaphylaxis. Although RGS13 expression is induced by immune receptor and chemokine receptor stimulation, the molecular regulation of RGS13 transcription is unknown. Here, we investigated the role of two p53 response elements (REs) in the regulation of RGS13 promoter activity and expression. We found that a 1000-bp DNA fragment upstream of the ATG translation start site (TSS) had promoter activity in reporter gene assays, and deletion or mutation of a p53-binding motif nearest the TSS abolished promoter activity. Notably, p53 bound to both REs in the RGS13 promoter in vivo as assessed by chromatin immunoprecipitation, suggesting that the p53 RE most distal to the TSS is physiologically inactive. We detected reduced RGS13 expression in MCs exogenously expressing p53 or treated with doxorubicin, which induces genotoxic stress and leads to p53 accumulation. RNA silencing of p53 up-regulated RGS13 expression in B lymphocytes, and bone marrow-derived MCs from p53−/− mice had increased RGS13 expression. Finally, p53-depleted B cells with increased RGS13 expression had reduced Ca2+ mobilization in response to sphingosine 1-phosphate. These studies indicate that p53 may modulate immune responses through suppression of RGS13 transcription in MCs and B cells.
Keywords: G Proteins, Gene Expression, Lymphocyte, Mast Cell, p53, Signal Transduction
Introduction
G protein-coupled receptor (GPCR)3 signaling pathways are initiated by exchange of GDP for GTP on the α-subunit of the heterotrimeric G protein, whereas signal termination is mediated by GTP hydrolysis by the Gα subunit (1). Regulator of G protein signaling (RGS) proteins negatively regulate GPCR signal transmission by catalyzing GTP hydrolysis by Gα and promoting its reassociation with Gβγ to form an inactive heterotrimer (2). Unlike several members of the RGS family, which are widely expressed, RGS13 is found predominantly in B lymphocytes and mast cells (MCs) (3–6). RGS13 inhibits B cell and MC chemotaxis by blunting chemokine receptor-evoked signaling (4, 6). Recently, we demonstrated that RGS13 also suppresses allergic responses in mice by inhibiting IgE receptor-mediated MC degranulation (5). RGS13 reduces IgE-antigen-dependent PI3K activation, a critical downstream event in the degranulation pathway, by binding the PI3K p85α regulatory subunit and blocking its interaction with an Fcϵ receptor I-associated signaling complex.
Within the hematopoietic compartment, RGS13 expression is highly restricted and subject to transcriptional regulation. RGS13 is specifically expressed in germinal center (GC) B lymphocytes and Burkitt lymphoma cell lines (which resemble GC B cells) (4, 7). Cross-linking of CD40 on tonsillar human B lymphocytes or IL-17 stimulation of mouse GC B cells up-regulates RGS13 expression (4, 8). We found previously that IgE-antigen stimulation induces RGS13 expression in bone marrow-derived MCs (5). GPCR activation of the human MC line HMC1 by either C5a or CXCL12, but not adenosine, also increases RGS13 protein levels (6). In contrast, treatment of the human MC line LAD2 with a permeable cAMP analog, which activates the cAMP response element-binding protein pathway, reduces RGS13 mRNA expression (9). Although these studies suggest involvement of various transcription factors activated by these stimuli (e.g. and NFκB) in the regulation of RGS13 transcription, the molecular determinants of RGS13 expression under homeostatic conditions or in activated MCs or B cells have not been characterized.
Analysis of the RGS13 locus upstream of the published mRNA sequence revealed potential binding sites for several transcription factors, including two motifs with considerable homology to a consensus p53-binding site. p53 is a master regulator of genes involved in DNA repair, cell cycle arrest, and apoptosis, which together actively suppress oncogenesis in response to stress signals (10, 11). In this study, we characterize the RGS13 promoter and demonstrate the presence of an active p53-binding site, which suppresses RGS13 transcription in MCs and B lymphocytes.
EXPERIMENTAL PROCEDURES
Reagents and Cell Culture
HMC1.1 or HS-Sultan cells were cultured in complete RPMI 1640 medium (Invitrogen) containing 10% (v/v) fetal bovine serum, 1% penicillin, and streptomycin, and HeLa or HEK293T cells were grown in complete DMEM at 37 °C and 5% CO2. LAD2 MCs (6) were grown in STEMPRO medium containing STEMPRO supplement (Invitrogen) and human stem cell factor (100 ng/ml; R&D Systems). The anti-RGS13 polyclonal antibody was described previously (6). The other antibodies used were mouse anti-β-actin (Sigma) and mouse anti-p53 (DO-1, Santa Cruz Biotechnology). Doxorubicin was purchased from Sigma. Lipofectamine 2000 was purchased from Invitrogen.
Mice
Wild-type C57BL/6 and p53−/− mice were obtained from Jackson ImmunoResearch Laboratories. MCs were obtained from mouse femurs and cultured as described (5). All mouse experiments were performed in accordance with Animal Study Protocol LAD-3E, approved by the NIAID Animal Care and Use Committee.
DNA Constructs
Lentiviral constructs expressing either scrambled shRNA (catalog no. SCH002, control shRNA 2) or human p53-specific shRNA (catalog nos. TRCN0000003753 (CCGGCGGCGCACAGAGGAAGAGAATCTCGAGATTCTCTTCCTCTGTGCGCCGTTTTT) and TRCN0000003755 (CCGGGTCCAGATGAAGCTCCCAGAACTCGAGTTCTGGGAGCTTCATCTGGACTTTTT)) were purchased from Sigma. An additional p53-specific lentivirus (catalog no. VGH5523-98486236) was obtained from Thermo Scientific. Luciferase reporter constructs were generated by PCR amplification of appropriate regions of RGS13, followed by subcloning into the pGL3-Basic vector (Promega). Site-directed mutagenesis was performed using the QuikChange II site-directed mutagenesis kit (Stratagene) following the manufacturer's instructions.
Transfection and Immunoblotting
For p53 overexpression and luciferase assays, LAD2 cells were transfected using Amaxa Nucleofection (Solution V, Program T-30) as described previously (6). For generation of lentiviruses, shRNA constructs were transfected into HEK293T cells together with a lentiviral packaging mixture (Invitrogen) using Lipofectamine 2000. After 72 h, virus was harvested in the supernatant and concentrated 10-fold by centrifugation. Concentrated virus was added directly to HS-Sultan cells, followed by selection with puromycin (0.5 μg/ml) after 72 h. Gene expression was assessed after 2 weeks of puromycin selection. Cell lysates were prepared using radioimmunoprecipitation lysis buffer containing 50 mm Tris (pH 7.4), 150 mm NaCl, 1 mm EDTA, 1% Triton X-100, 0.5% sodium deoxycholate, and 0.1% SDS supplemented with protease inhibitor mixture (Complete, Roche Applied Science) and a phosphatase inhibitor mixture (PhosSTOP, Roche Applied Science) for 15 min at 4 °C. Proteins were separated by SDS-PAGE and blotted with primary antibodies as indicated in the figure legends, followed by incubation with infrared IRDye-labeled secondary antibodies (LI-COR Biosciences). Signals were detected and quantified using the LI-COR Odyssey imaging system.
5′-Rapid Amplification of cDNA Ends (5′-RACE)
We isolated RNA from LAD2 and HMC1.1 cells using the RNeasy kit (Qiagen). We generated cDNA and performed 5′-RACE with linker primers and gene-specific primers as outlined in supplemental Fig. S1 using the 5′ SMART RACE kit (BD Biosciences) according to the manufacturer's instructions. PCR products were cloned into pCRII-TOPO (Invitrogen), followed by sequencing plasmid inserts using vector-specific primers.
DNA Pulldown Assay
We isolated nuclear extracts from LAD2 cells using standard procedures (12). Nuclear extracts (20 μg of protein) were incubated in buffer A (20 mm HEPES (pH 8), 100 mm KCl, 5 mm MgCl2, 10% glycerol, and 0.1% Nonidet P-40) containing poly(dI:dC) (1 μg) and biotinylated double-stranded oligonucleotides (100 pmol) for 30 min on ice in the presence or absence of a 100-fold molar excess of unlabeled (non-biotinylated) competitor probe. Sequences of specific primers are shown in supplemental Table 1. DNA-protein complexes were collected by addition of streptavidin-agarose beads (Thermo Scientific) for 1 h at 4 °C. Reactions were washed twice with buffer A prior to addition of SDS sample buffer and immunoblot analysis.
ChIP
We prepared sheared chromatin using the ChIP-It express enzymatic shearing Kit (Active Motif). ChIP assays were done using the EZ-ChIP kit (Millipore) according to the manufacturer's guidelines. Briefly, LAD2 cells were fixed in 1% formaldehyde solution for 10 min, followed by addition of glycine solution to stop the reaction. Cells were then lysed, homogenized 10 times with a Dounce homogenizer, and centrifuged at 2400 × g for 10 min to pellet chromatin. Enzymatic shearing of chromatin was done at 37 °C for 10 min. Sheared chromatin was precleared with protein G-agarose beads (GE Healthcare) for 1 h at 4 °C. Precleared chromatin in the supernatant was then immunoprecipitated with mouse anti-p53 antibody or control mouse IgG and protein G beads overnight at 4 °C. Immunoprecipitated complexes were washed, reverse-cross-linked, and treated with proteinase K. DNA was purified and used for PCR amplification of RGS13 promoter regions using the following primer pairs: p53-distal, 5′-CAGAAGGACAGCCTTTCAAT-3′ (forward) and 5′-GTTCAGTTTATGAAATCATAGC-3′ (reverse); and p53-proximal, 5′-CACAATCTTACCATATTCTG-3′ (forward) and 5′-TACCTCTCTAGTTCCTTCAAC-3′ (reverse).
Luciferase Assays
We transfected LAD2 cells with pGL3 constructs together with a plasmid encoding Renilla luciferase (pCMV-PRL, Promega) by Nucleofection. 24 h later, firefly and Renilla luciferase activities in cell lysates were measured in duplicate using the Stop & Glo Dual-Luciferase assay system (Promega) following the manufacturer's instructions. Firefly luciferase values were normalized to Renilla values.
Real-time TaqMan PCR Analysis
Total RNA was isolated using the RNeasy kit (Qiagen), and 1 μg of RNA was reverse-transcribed into cDNA using SuperScript III reverse transcriptase (Invitrogen) following the manufacturer's instructions. RNA incubated without reverse transcriptase was used as a negative control for PCR. 1 μl of synthesized cDNA was then used for amplification of RGS13 or p53 using the real-time TaqMan gene expression assay kit (catalog nos. Hs01034249_m1 (human p53), Hs00243182_m1 (human RGS13), Mm01731287_m1 (mouse p53), and Mm00462629_m1 (mouse Rgs13)) from Applied Biosystems. GAPDH was used as an endogenous housekeeping gene for normalization, and relative quantifications were based on the amount of p53 or RGS13 divided by the GAPDH result.
Measurement of Intracellular Ca2+ Mobilization
HS-Sultan cells (1 × 10⁵ cells/well) were seeded in BioCoat polylysine 96-well plates (BD Biosciences) and pelleted by centrifugation prior to measurement of the intracellular Ca2+ concentration. Ca2+ indicator dye (FLIPR calcium 3 assay component A, Molecular Devices) was added to each well, followed by incubation for 1 h at 37 °C with 5% CO2. Sphingosine 1-phosphate (Avanti Polar Lipids) or ionomycin (Sigma) was prepared in a separate plate at a 5-fold concentration for robotic addition to cells by the FlexStation II fluorometer (Molecular Devices). Relative fluorescence units were measured every 10 s for a period of 600 s after agonist addition. Results are plotted as the maximum − minimum signal over this time period.
Statistical Analysis
Data were analyzed using the GraphPad Prism 5 software package. Student's t test was used for pairwise comparisons, and analysis of variance (ANOVA) was used for multiple comparisons. p values <0.05 were considered significant.
RESULTS
Structure of Human RGS13
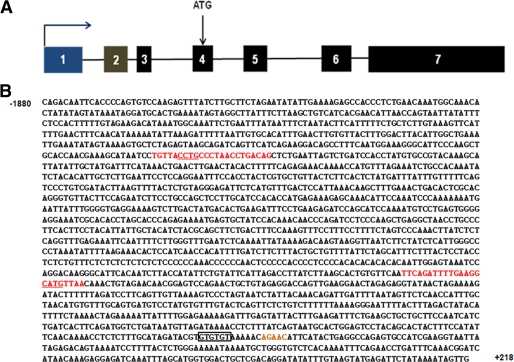
According to the human genome contig assembly by the National Center for Biotechnology Information, human RGS13 is tandemly duplicated in a cluster with RGS18, RGS1, and RGS2 on chromosome 1 (1q31.2) (13). The RGS13 gene locus (NC.000001.10) is composed of 24,106 bp (chromosome positions 192605282–192629390) and has seven exons, with the translation initiation codon found in exon 4 (Fig. 1A). There are two transcript variants (NM_002797 and NM_144766), which encode the same RGS13 protein isoform. The transcripts differ by 60 bp in the 5′-UTR, with the shorter transcript missing exon 3. To map the translation start site (TSS) experimentally in MCs, we performed 5′-RACE on RNA from the human MC lines LAD2 and HMC1.1, which express RGS13 constitutively (6). We isolated RNA from these cells and generated cDNA using a gene-specific primer downstream of the translation initiation codon as outlined in supplemental Fig. S1. We obtained a single 400-bp 5′-RACE product using a nested gene-specific primer 33 bp upstream of the cDNA primer. This result is consistent with previous studies showing the presence of a single transcript species (∼1.6 kb) in all cells and tissues tested (4). We cloned the PCR product and analyzed sequences from 16 independent clones. The experimentally derived TSS was located 10 bp upstream of exon 1 of the published RGS13 sequence, transcript variant 1 (NM_002927) (Fig. 1B).
FIGURE 1.
Structure of the human RGS13 gene. A, exon (boxes)-intron structure of RGS13. The published transcription start site in exon 1 is denoted by the bent arrow, and the TSS in exon 4 by the straight arrow. B, 5′-sequence flanking the TSS of RGS13 (−1880 to +218). The sequence of the previously published TSS is denoted in brown, and the experimentally mapped TSS is boxed. Two p53 REs (−1417 and −442) are highlighted in red, and the core binding motif in each is underlined.
Characterization of the RGS13 Promoter
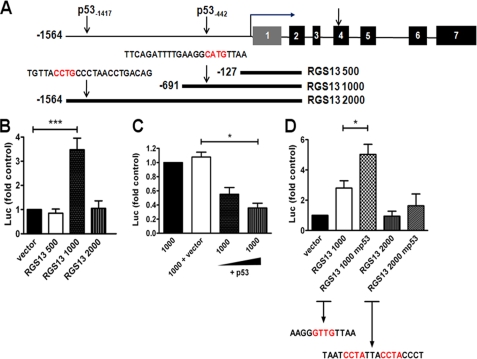
To identify the RGS13 promoter region, we cloned an ∼2-kb fragment of the 5′-flanking region of RGS13 (−1573 to +493, with numbering based on the experimentally derived TSS) (Fig. 1B). To determine which regions upstream of the TSS had promoter activity, if any, we cloned the entire 2000-bp fragment and deletions thereof into a promoterless luciferase reporter vector as shown in Fig. 2A. We transfected reporter plasmids containing these sequences (RGS13 2000, 1000, and 500) into LAD2 MCs and measured luciferase activity in cell extracts after 24 h. Compared with cells expressing empty vector, cells transfected with the RGS13 500 or RGS13 2000 construct had no additional luciferase activity (Fig. 2B). By contrast, cells transfected with RGS13 1000 had, on average, 3.5-fold more luciferase activity than control cells. These results suggest that an ∼1.1-kilobase pair DNA fragment upstream of the TSS (−691 to +493) contains the minimal RGS13 promoter.
FIGURE 2.
Characterization of the RGS13 promoter. A, the locations of two p53 REs in the 5′-flanking region of RGS13 and a schematic representation of luciferase reporter constructs are shown. PCR products encompassing the denoted regions were amplified from genomic DNA and subcloned into a promoterless luciferase reporter vector (pGL3-Basic). Numbers are relative to the experimentally derived TSS (bent arrow). B and C, RGS13 promoter activity. Luciferase reporter constructs were transfected into LAD2 cells together with a plasmid encoding Renilla luciferase. Luciferase (Luc) activity in cell extracts was measured after 24 h. Data are means ± S.E. of activity relative to cells expressing empty control vector (or RGS13 1000 in C) in three or more independent experiments. *, p = 0.02; ***, p < 0.0001 (one-way ANOVA). D, relative luciferase activity of WT or mutant (mp53) constructs lacking core p53-binding motifs. The mutated sequence is denoted in red. *, p < 0.05 (one-way ANOVA).
To identify specific regulatory elements in the RGS13 promoter, we examined sequence upstream of the TSS using MatInspector software (Genomatix Software, Inc.). This analysis demonstrated several regions with high homology to binding sites for a number of transcription factors, including PU.1, GATA1–3, and octamer-binding proteins, which are known to regulate several genes involved in the differentiation and function of hematopoietic cells (14–16). Notably, we found two elements with significantly homology to p53-binding motifs, beginning at positions −442 (relative to the TSS, named “proximal”) and −1417 (named “distal”) (Fig. 1B). Given the relatively unknown function of p53 in the regulation of gene transcription in MCs as well as the previous identification of RGS16 as a p53 target gene (17), we focused on the role of p53 in RGS13 transcription in the remainder of this study.
As neither RGS13 500, which contained no p53 response elements (REs), nor RGS13 2000, which contained both distal and proximal REs, had promoter activity, we hypothesized that the activity of RGS13 1000 was regulated by p53 through the proximal RE. To test this directly, we transfected LAD2 cells with RGS13 1000 and a plasmid encoding p53. Overexpression of p53 significantly reduced the activity of RGS13 1000 in a concentration-dependent manner (Fig. 2C). To determine whether the p53 RE was required for the promoter activity of RGS13 1000, we eliminated the core p53-binding motif by site-directed mutagenesis and measured the luciferase activity of this construct in LAD2 cells. Surprisingly, a mutant lacking the p53-binding site had increased promoter activity relative to the WT construct (Fig. 2D). In contrast, mutation of core p53-binding sequences in the distal RE located in RGS13 2000 had no effect on luciferase activity. Taken together, these results suggest that p53 inhibits the activity of the RGS13 promoter by interacting with a p53-binding motif ∼450 bp upstream of the TSS.
p53 Binds to the RGS13 Promoter
To determine whether any or all of the p53 REs contained bona fide p53-binding sites, we assessed the interactions of native p53 from LAD2 cells with DNA templates in vitro. We incubated nuclear extracts of these cells with biotinylated double-stranded oligonucleotides containing either of the p53-binding motifs derived from the RGS13 promoter. An oligonucleotide containing a consensus p53-binding sequence (18) was used as a positive control, and a randomly generated oligonucleotide served as a negative control. We collected DNA-protein complexes with streptavidin-coated beads and washed the beads to eliminate nonspecific interactions. We assessed p53-oligonucleotide binding by immunoblotting with a p53-specific antibody.
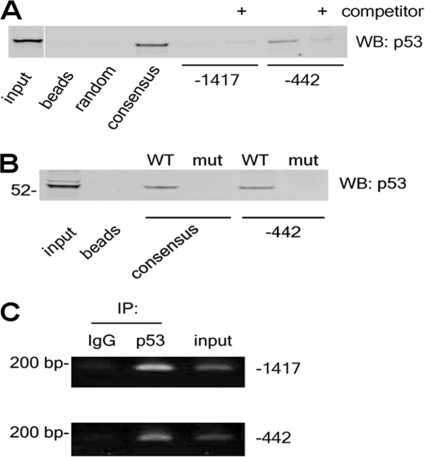
Endogenous p53 from LAD2 cells strongly bound to oligonucleotides containing the consensus p53 sequence but not to the random oligonucleotide or to beads alone (Fig. 3A). We detected p53 readily in complexes containing the proximal p53-binding sequence but minimally in oligonucleotide complexes containing the distal p53-binding motif. Specific binding of p53 to the proximal RE-containing oligonucleotide was abolished by preincubation of nuclear extracts with a 100-fold molar excess of unlabeled oligonucleotide. We also failed to detect p53 in complexes of biotinylated oligonucleotides containing mutations in the core p53-binding sequence (Fig. 3B).
FIGURE 3.
p53 binds to the RGS13 promoter. A and B, nuclear extracts were isolated from LAD2 MCs (20 μg of protein) and aliquoted into reaction tubes containing biotinylated double-stranded oligonucleotides in the presence or absence of unlabeled competitor oligonucleotides as indicated. DNA-protein complexes were collected using streptavidin-coated beads, followed by assessment of protein binding by immunoblotting. WB, Western blot; mut, mutant. C, p53 binds to two p53 REs in the RGS13 promoter in vivo. Sheared chromatin from LAD2 cells was immunoprecipitated (IP) with the indicated antibodies, followed by amplification of RGS13 promoter sequences. Images represent two to three similar experiments.
To determine whether p53 bound to endogenous chromatin containing the RGS13 promoter region in vivo, we performed ChIP. We treated LAD2 cells with formaldehyde to cross-link DNA-protein complexes and sheared chromatin to obtain ∼200-bp amplicons. We immunoprecipitated sheared chromatin with p53-specific or isotype control antibodies, followed by reverse cross-linking and amplification of sequences in the RGS13 promoter using specific primers. Surprisingly, we could amplify PCR products containing both proximal and distal p53 REs sites from the RGS13 promoter in anti-p53 immunoprecipitates but not in immunoprecipitations using IgG alone (Fig. 3C). These results indicate that p53 binds to both REs located in the RGS13 promoter in vivo.
Genotoxic Stress Reduces RGS13 Expression in MCs
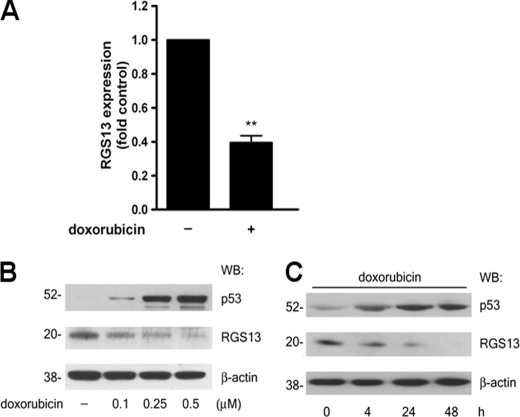
To evaluate the role of p53 in the regulation of RGS13 mRNA quantities, we treated LAD2 cells with the chemotherapeutic agent doxorubicin (Fig. 4, B and C), which intercalates DNA (19), resulting in genotoxic stress and accumulation of p53 protein (20). Overnight treatment with doxorubicin led to a nearly 60% reduction in RGS13 mRNA quantities in LAD2 cells (Fig. 4A). RGS13 protein levels also decreased in response to doxorubicin treatment in a concentration-dependent manner (Fig. 4B). We detected reduced RGS13 expression as early as 4 h following addition of doxorubicin, and RGS13 levels remained low for up to 48 h (Fig. 4C). These results are consistent with the inhibition of RGS13 promoter activity in LAD2 cells by p53, suggesting an inverse correlation between p53 levels and RGS13 expression.
FIGURE 4.
Doxorubicin-induced genotoxic stress reduces RGS13 expression in MCs. A, LAD2 cells were treated with doxorubicin (0.5 μm) for 12 h, followed by extraction of RNA and assessment of RGS13 quantities by real-time PCR. Expression is shown relative to untreated cells, set as 1 (mean ± S.E. of three independent experiments). **, p = 0.004 (paired t test). B and C, LAD2 cells were stimulated with the indicated concentrations of doxorubicin for various time periods. RGS13 quantities in cell lysates were determined by immunoblotting. Images represent two to three similar experiments. WB, Western blot.
Reciprocal Relationship between p53 and RGS13 Expression
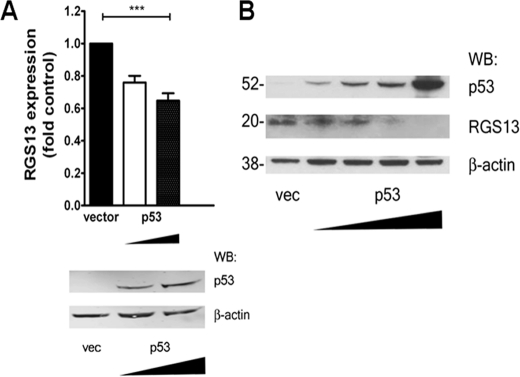
To determine whether the reduced RGS13 transcription in cells exposed to doxorubicin was due to increased p53 expression, we transfected LAD2 cells with a plasmid encoding p53 and evaluated RGS13 amounts by quantitative PCR and immunoblotting. Cells expressing the p53-encoding plasmid had much higher levels of p53 than cells expressing empty vector (Fig. 5A). RGS13 mRNA and protein expression was significantly reduced by transfection of exogenous p53 in a dose-dependent manner (Fig. 5, A and B).
FIGURE 5.
p53 overexpression reduces RGS13 expression in MCs. A and B, LAD2 cells were transfected with empty vector (vec) or plasmid encoding p53 (1–2 or 5 μg), followed by assessment of RGS13 quantities by real-time PCR (A) or immunoblotting (B). The bar graph in A shows expression relative to control cells, set as 1 (mean ± S.E. of four independent experiments). ***, p < 0.0001 (one-way ANOVA). The blot in B represents three similar experiments. WB, Western blot.
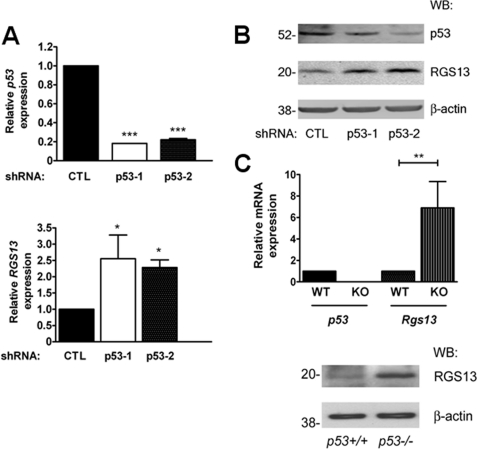
To further evaluate the suppression of RGS13 transcription by p53, we extinguished p53 expression using RNA interference. Unfortunately, we were unsuccessful in evaluating p53 shRNA/siRNA in LAD2 cells using a variety of methods, including lentiviral shRNA expression, possibly due to poor transfection efficiency and/or viral cytotoxicity. Instead, we infected HS-Sultan cells, a human GC B cell lymphoma cell line that expresses RGS13 constitutively (7), with two distinct lentiviruses encoding p53-targeted shRNAs. This led to substantially reduced p53 mRNA and protein amounts compared with cells expressing a control shRNA (Fig. 6, A and B). Cells with reduced p53 expression had significantly more RGS13 mRNA and protein than cells expressing a scrambled non-targeting shRNA (Fig. 6, A and B). To determine whether reduced p53 levels affected RGS13 expression in MCs, we analyzed bone marrow-derived cultured MCs from p53−/− mice. We identified putative p53 REs in the sequence upstream of the initiation codon of mouse Rgs13, suggesting that p53 also regulates RGS13 expression in mouse MCs. Consistent with this, p53−/− bone marrow-derived MCs had significantly more Rgs13 mRNA and protein than the WT counterparts did. Taken together, our results indicate that p53 suppresses RGS13 expression in B cells and MCs in an evolutionarily conserved manner.
FIGURE 6.
Inverse relationship between RGS13 expression and p53 amounts in B cells and MCs. A, HS-Sultan B cells were infected with lentiviruses encoding scrambled (control (CTL)) or p53-targeted shRNAs. After 2 weeks of puromycin selection, p53 and RGS13 mRNA expression was determined by real-time PCR (mean ± S.E. of expression relative to the control, measured in two to three experiments from two independent transfections). *, p = 0.01; ***, p < 0.0001 (one-way ANOVA). B, lysates of HS-Sultan cells transfected with the indicated lentiviral shRNAs were prepared and analyzed by immunoblotting with the indicated antibodies. C, p53 and RGS13 expression in bone marrow-derived MCs from WT or p53−/− mice was measured by real-time PCR and immunoblotting. The graph shows the quantities of p53 and Rgs13 relative to the wild type (mean ± S.E. of five mice in each group). **, p < 0.004 (one-way ANOVA). KO, knock-out; WB, Western blot.
Functional Consequences of p53-induced Alterations in RGS13 Expression
We showed previously that RGS13 regulates sphingosine 1-phosphate-induced signaling (6). To address the functional ramifications of increased RGS13 expression associated with reduced p53 quantities, we treated HS-Sultan B cells stably expressing control or p53 shRNAs (three distinct siRNA sequences targeting p53) with sphingosine 1-phosphate and measured Ca2+ mobilization. We observed reduced sphingosine 1-phosphate-induced intracellular Ca2+ concentrations in p53 knockdown cells compared with control cells (Fig. 7). Receptor-independent Ca2+ flux evoked by ionomycin was equivalent in control and p53-depleted cells. Thus, the increased expression of RGS13 induced by p53 knockdown exerts a negative regulatory effect on sphingosine 1-phosphate-evoked signaling pathways in B cells.
FIGURE 7.
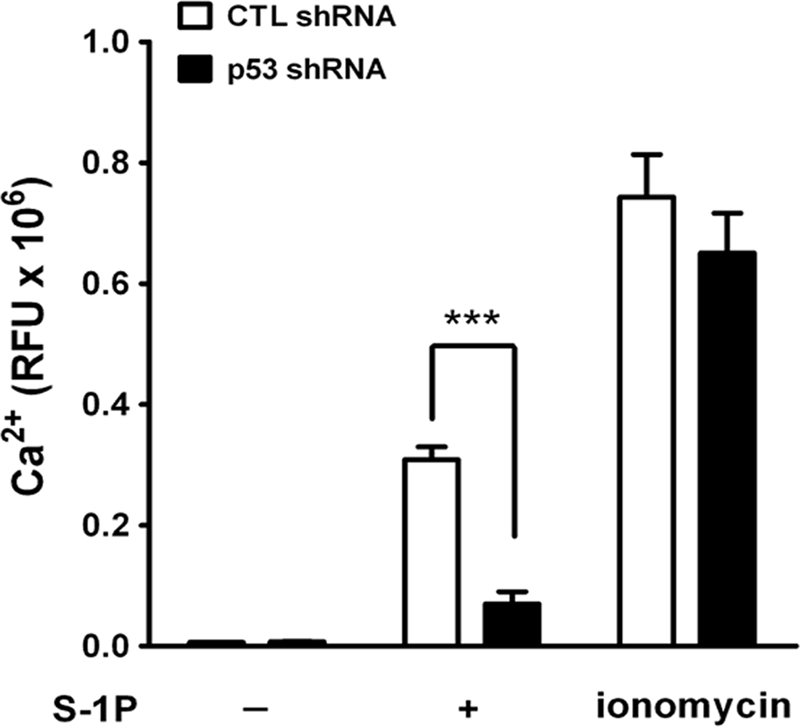
Increased RGS13 levels in p53 knockdown cells result in reduced GPCR signaling. HS-Sultan cells expressing control (CTL) or p53-specific shRNAs were labeled with a Ca2+-sensing fluorophore and left untreated or stimulated with sphingosine 1-phosphate (S-1P; 15 μm) or ionomycin (5 μm). Intracellular Ca2+ levels were measured over a period of 600 s by fluorometry. The graph represents means ± S.E. of maximum − minimum relative fluorescence units (RFU) measured in three independent experiments. ***, p < 0.0001 (t test).
DISCUSSION
This study is the first to identify and characterize molecular determinants of RGS13 expression. RGS13 meets the definition of a p53 response gene according to published criteria (10): 1) it contains putative p53 REs in its upstream promoter region; 2) manipulation of p53 expression or elimination of the p53-binding motif modifies RGS13 promoter activity; 3) p53 binds to the identified RE in vivo as assessed by ChIP; and 4) manipulation of p53 levels leads to changes in the expression of both RGS13 mRNA and protein.
Prior work demonstrated that another member of the RGS family (RGS16) is a p53 response gene. Treatment with doxorubicin or exogenous p53 expression induces rapid and robust up-regulation of RGS16 mRNA expression in colon or breast cancer cell lines (17). Although purified p53 was reported to bind elements resembling p53-binding motifs located in intronic/3′-UTR regions of RGS16, it was unclear whether p53 regulated RGS16 transcription directly. In contrast to these studies, we showed that p53 quantities correlated inversely with RGS13 expression in MCs. Cells with increased p53 levels as a result of cell stress (doxorubicin treatment) or plasmid-based p53 transfection had reduced RGS13 expression due to direct inhibition of the RGS13 promoter by p53.
We characterized the RGS13 promoter in total and found that its regulation is likely to be complex. We characterized an ∼1000-bp DNA fragment flanking the experimentally determined TSS (RGS13 1000) that had promoter activity in MCs. A reporter containing the RGS13 promoter had minimal activity in cells that do not express RGS13 (supplemental Fig. S2), which is consistent with the limited expression of RGS13 in a limited number of cell types. Although we did not find putative binding motifs for transcription factors unique to MCs and/or B lymphocytes in the RGS13 promoter region by bioinformatic analysis, we did identify elements resembling binding sites for PU.1 (−1263), GATA1 (−487), and microphthalmia-associated transcription factor (−273). These transcription factors, which are expressed highly in MC progenitors, are all required to some extent for MC differentiation and could thus contribute to the high expression of RGS13 in MCs (16).
In contrast to the promoter activity of RGS13 1000, a fragment containing this sequence plus an additional ∼900-bp upstream flanking sequence (RGS13 2000) had no promoter activity in reporter assays. This result suggests that elements in the sequence between −691 and −1564 inhibit responsiveness of RGS13 1000. However, the distal p53 RE located in this region is not likely to be involved in the negative regulation of the RGS13 promoter, as mutation of its p53-binding motif did not affect promoter activity. The RGS13 gene locus may also have as yet uncharacterized enhancers and/or repressors in its first three introns or exons because the coding sequence is contained entirely in exons 4–6. We included exon 1 and a portion of intron 1 in our reporter constructs, and these sequences could impose negative or positive modulation of the upstream regulatory regions studied here. Further work will be needed to determine whether selective use of such elements could also contribute to the highly cell type-specific expression of RGS13 in MCs and GC B cells. Such a mechanism has been demonstrated for a conserved 3′-noncoding region of Il4, which acts as an essential enhancer for Il4 gene transcription in MCs but not in basophils (21).
The detailed mechanism(s) whereby p53 suppresses RGS13 transcription will also require further study. Repression of gene transcription by p53 may be either direct or indirect. p53 has the capacity to “squelch” the activity of nearby activating transcription factors, primarily of the CCAAT/enhancer-binding protein (C/EBP) family, by steric hindrance (10). We identified several potential C/EBPβ-binding sites in the RGS13 promoter, the closest located 321 bp from the active p53-binding site. Alternatively, p53 may inactivate certain transcription factors by direct binding, namely Sp1, C/EBPβ, and AP1. In addition to the aforementioned C/EBP motif, we identified a putative Sp1-binding site located 95 bp from the proximal p53 RE. Finally, p53 may also repress gene transcription indirectly through activation of histone deacetylases (10).
The expression of RGS proteins is often low in unstimulated cells (22). Because of their strong catalytic activity, which promotes termination of GPCR pathways, such tight control of the basal transcription of RGS genes may permit a certain level of homeostatic GPCR signaling. Abnormal expression of RGS genes may occur in neoplastic or inflammatory conditions. RGS13 is difficult to detect in normal T cells but is overexpressed in adult T cell leukemia/lymphoma cells (3, 23). In contrast, RGS13 is strongly expressed in GC B cells and Burkitt lymphomas (which resemble GC B cells) (4) but is absent in B cell lymphomas with a mantle cell phenotype (24). The relationship of these variations in RGS13 expression to p53, if any, is unknown. Although several SNPs in RGS13 were identified in mantle cell phenotype lymph nodes, which were located in noncoding regions downstream of the TSS, the functional significance of these SNPs was not explored. Recently, another SNP was identified in the 5′-region of the RGS13 gene locus in patients with head and neck squamous cell carcinoma (rs3795617), which correlated significantly with clinical risk of recurrence or the development of a second primary tumor (25). Given the ability of RGS proteins to regulate cell growth (26), these or other genetic variations could predispose to neoplasia by modulating RGS13 promoter activity.
IL-17-induced up-regulation of RGS13 in lymph node B cells has also been implicated in spontaneous GC formation and autoimmunity in BXD2 mice (8). We showed here that increased RGS13 expression induced by p53 depletion blunts responses to a GPCR ligand (sphingosine 1-phosphate). Recent studies have shown the importance of sphingosine 1-phosphate in lymphocyte migration and GC formation and maintenance in secondary lymphoid organs (27, 28). It will be of considerable interest to fully characterize RGS13 sequence and expression and their relationship to p53 in immune diseases associated with dysregulated MC and/or B lymphocyte migration or other functions.
Supplementary Material
Acknowledgment
We thank Dr. Helene Rosenberg (NIAID, National Institutes of Health) for helpful discussions and critical review of the manuscript.
This work was supported, in whole or in part, by National Institutes of Health Intramural Research Program Grant AI000939-06 LAD from NIAID.

The on-line version of this article (available at http://www.jbc.org) contains supplemental Figs. S1 and S2 and Table 1.
- GPCR
- G protein-coupled receptor
- RGS
- regulator of G protein signaling
- MC
- mast cell
- GC
- germinal center
- 5′-RACE
- 5′-rapid amplification of cDNA ends
- ANOVA
- analysis of variance
- TSS
- translation start site
- RE
- response element
- C/EBP
- CCAAT/enhancer-binding protein.
REFERENCES
- 1. Gilman A. G. (1987) Annu. Rev. Biochem. 56, 615–649 [DOI] [PubMed] [Google Scholar]
- 2. Berman D. M., Wilkie T. M., Gilman A. G. (1996) Cell 86, 445–452 [DOI] [PubMed] [Google Scholar]
- 3. Johnson E. N., Druey K. M. (2002) J. Biol. Chem. 277, 16768–16774 [DOI] [PubMed] [Google Scholar]
- 4. Shi G. X., Harrison K., Wilson G. L., Moratz C., Kehrl J. H. (2002) J. Immunol. 169, 2507–2515 [DOI] [PubMed] [Google Scholar]
- 5. Bansal G., Xie Z., Rao S., Nocka K. H., Druey K. M. (2008) Nat. Immunol. 9, 73–80 [DOI] [PMC free article] [PubMed] [Google Scholar]
- 6. Bansal G., DiVietro J. A., Kuehn H. S., Rao S., Nocka K. H., Gilfillan A. M., Druey K. M. (2008) J. Immunol. 181, 7882–7890 [DOI] [PMC free article] [PubMed] [Google Scholar]
- 7. Han J. I., Huang N. N., Kim D. U., Kehrl J. H. (2006) J. Leukocyte Biol. 79, 1357–1368 [DOI] [PubMed] [Google Scholar]
- 8. Hsu H. C., Yang P., Wang J., Wu Q., Myers R., Chen J., Yi J., Guentert T., Tousson A., Stanus A. L., Le T. V., Lorenz R. G., Xu H., Kolls J. K., Carter R. H., Chaplin D. D., Williams R. W., Mountz J. D. (2008) Nat. Immunol. 9, 166–175 [DOI] [PubMed] [Google Scholar]
- 9. Xie Z., Yang Z., Druey K. M. (2010) J. Mol. Cell Biol. 2, 357–365 [DOI] [PMC free article] [PubMed] [Google Scholar]
- 10. Riley T., Sontag E., Chen P., Levine A. (2008) Nat. Rev. Mol. Cell Biol. 9, 402–412 [DOI] [PubMed] [Google Scholar]
- 11. Kruse J. P., Gu W. (2009) Cell 137, 609–622 [DOI] [PMC free article] [PubMed] [Google Scholar]
- 12. Dignam J. D., Lebovitz R. M., Roeder R. G. (1983) Nucleic Acids Res. 11, 1475–1489 [DOI] [PMC free article] [PubMed] [Google Scholar]
- 13. Sierra D. A., Gilbert D. J., Householder D., Grishin N. V., Yu K., Ukidwe P., Barker S. A., He W., Wensel T. G., Otero G., Brown G., Copeland N. G., Jenkins N. A., Wilkie T. M. (2002) Genomics 79, 177–185 [DOI] [PubMed] [Google Scholar]
- 14. Kitamura Y., Oboki K., Ito A. (2006) Immunol. Allergy Clin. North Am. 26, 387–405 [DOI] [PubMed] [Google Scholar]
- 15. Kemler I., Schaffner W. (1990) FASEB J. 4, 1444–1449 [DOI] [PubMed] [Google Scholar]
- 16. Takemoto C. M., Brandal S., Jegga A. G., Lee Y. N., Shahlaee A., Ying Y., Dekoter R., McDevitt M. A. (2010) J. Immunol. 184, 4349–4361 [DOI] [PubMed] [Google Scholar]
- 17. Buckbinder L., Velasco-Miguel S., Chen Y., Xu N., Talbott R., Gelbert L., Gao J., Seizinger B. R., Gutkind J. S., Kley N. (1997) Proc. Natl. Acad. Sci. U.S.A. 94, 7868–7872 [DOI] [PMC free article] [PubMed] [Google Scholar]
- 18. el-Deiry W. S., Kern S. E., Pietenpol J. A., Kinzler K. W., Vogelstein B. (1992) Nat. Genet. 1, 45–49 [DOI] [PubMed] [Google Scholar]
- 19. Ashley N., Poulton J. (2009) Oncogene 28, 3880–3891 [DOI] [PMC free article] [PubMed] [Google Scholar]
- 20. Marcel V., Vijayakumar V., Fernández-Cuesta L., Hafsi H., Sagne C., Hautefeuille A., Olivier M., Hainaut P. (2010) Oncogene 29, 2691–2700 [DOI] [PubMed] [Google Scholar]
- 21. Yagi R., Tanaka S., Motomura Y., Kubo M. (2007) Mol. Cell. Biol. 27, 8087–8097 [DOI] [PMC free article] [PubMed] [Google Scholar]
- 22. Bansal G., Druey K. M., Xie Z. (2007) Pharmacol. Ther. 116, 473–495 [DOI] [PMC free article] [PubMed] [Google Scholar]
- 23. Pise-Masison C. A., Radonovich M., Dohoney K., Morris J. C., O'Mahony D., Lee M. J., Trepel J., Waldmann T. A., Janik J. E., Brady J. N. (2009) Blood 113, 4016–4026 [DOI] [PMC free article] [PubMed] [Google Scholar]
- 24. Islam T. C., Asplund A. C., Lindvall J. M., Nygren L., Liden J., Kimby E., Christensson B., Smith C. I., Sander B. (2003) Leukemia 17, 1880–1890 [DOI] [PubMed] [Google Scholar]
- 25. Wang J., Lippman S. M., Lee J. J., Yang H., Khuri F. R., Kim E., Lin J., Chang D. W., Lotan R., Hong W. K., Wu X. (2010) Carcinogenesis 31, 1755–1761 [DOI] [PMC free article] [PubMed] [Google Scholar]
- 26. Liang G., Bansal G., Xie Z., Druey K. M. (2009) J. Biol. Chem. 284, 21719–21727 [DOI] [PMC free article] [PubMed] [Google Scholar]
- 27. Cyster J. G. (2005) Annu. Rev. Immunol. 23, 127–159 [DOI] [PubMed] [Google Scholar]
- 28. Wang J. H., Li J., Wu Q., Yang P., Pawar R. D., Xie S., Timares L., Raman C., Chaplin D. D., Lu L., Mountz J. D., Hsu H. C. (2010) J. Immunol. 184, 442–451 [DOI] [PMC free article] [PubMed] [Google Scholar]
Associated Data
This section collects any data citations, data availability statements, or supplementary materials included in this article.


