Abstract
The interaction of brain lipids with α-synuclein may play an important role in the pathogenesis of Parkinson disease (PD). Docosahexaenoic acid (DHA) is an abundant fatty acid of neuronal membranes, and it is presents at high levels in brain areas with α-synuclein inclusions of patients with PD. In animal models, an increase of DHA content in the brain induces α-synuclein oligomer formation in vivo. However, it is not clear whether these oligomeric species are the precursors of the larger aggregates found in Lewy bodies of post-mortem PD brains. To characterize these species and to define the role of fatty acids in amyloid formation, we investigated the aggregation process of α-synuclein in the presence of DHA. We found that DHA readily promotes α-synuclein aggregation and that the morphology of these aggregates is dependent on the ratio between the protein and DHA. In the presence of a molar ratio protein/DHA of 1:10, amyloid-like fibrils are formed. These fibrils are morphologically different from those formed by α-synuclein alone and have a less packed structure. At a protein/DHA molar ratio of 1:50, we observe the formation of stable oligomers. Moreover, chemical modifications, methionine oxidations, and protein-lipid adduct formations are induced by increasing concentrations of DHA. The extent of these modifications defines the structure and the stability of aggregates. We also show that α-synuclein oligomers are more toxic if generated in the presence of DHA in dopaminergic neuronal cell lines, suggesting that these species might be important in the neurodegenerative process associated with PD.
Keywords: Amyloid, Atomic Force Microscopy, Cell Death, Electron Microscopy (EM), Mass Spectrometry (MS), Parkinson Disease, Protein Chemical Modification, Protein Self-assembly, alpha-Synuclein, Docosahexaenoic Acid
Introduction
α-Synuclein (α-syn)4 is a 14.5-kDa presynaptic protein, natively unfolded, that plays an important role in the pathogenesis of Parkinson disease (PD) (1). Point mutations and multiplications of the SNCA gene, encoding α-syn, are associated with familial forms of the disease (2, 3). β-Sheet fibrillar forms of α-syn aggregates represent the main constituents of the typical PD intracellular inclusions termed Lewy bodies (4). The amino-terminal region (approximately residues 1–60) of α-syn contains an 11-amino acid repeat sequence with a highly conserved hexameric motif (KTKEGV) and acquires an amphipathic helical structure upon interaction with an anionic membrane surface (5). The central region (residues 61–95) includes the highly amyloidogenic NAC sequence, responsible for amyloid-like fibril formation. The carboxyl-terminal region (residues 96–140) is enriched in acidic and proline residues, and it is suggested to play an important role in modulating the aggregation properties of the protein (6).
Despite its association with neurodegenerative diseases, the physiological function of α-syn and the mechanisms underlying its toxicity in PD pathogenesis are still under investigation. Substantial evidence correlates the protein with neuronal membranes (7–9) and brain lipids (10). It has been demonstrated that α-syn binds to abundant cerebral polyunsaturated fatty acids (PUFA), such as arachidonic and docosahexaenoic acids (DHA). Interestingly, α-syn is also implicated in the regulation of fatty acid metabolism (11, 12). Alterations in the α-syn expression may affect the kinetics of DHA esterification in brain phospholipids (12). Moreover, the appearance of α-syn toxic oligomers in vivo has been linked to the presence of long PUFAs in the brain (13–16). The functional correlation of α-syn with brain lipids provides a critical link between oxidative stress and the onset of PD. Indeed, oxidative stress is a risk factor in PD, because the brain is particularly susceptible to neuronal damage caused by reactive oxygen species, due to the relative lack of antioxidant defense mechanisms (17). Neurons have a high content of PUFA whose peroxidation leads to the formation of reactive aldehydes and ketones, able to induce covalent modifications in proteins. In the case of α-syn, such chemical changes seem to affect the process of aggregation and potentially the onset of PD. Moreover, in vitro studies have shown that the lipid oxidation product, 4-hydroxy-2-nonenal, covalently binds to α-syn. As a consequence, α-syn can no longer form fibrils but only oligomeric species, which have been suggested to contribute to the damage of neurons subjected to oxidative stress (18). However, it was found that α-syn can act as scavenger of ROS, preventing unsaturated lipids oxidation in vesicles by the oxidation of the methionine residues to methionine-sulfoxide (19). Given the decrease in hydrophobicity, the oxidized protein is not only less prone to form oligomers and fibrils, but even able to inhibit the fibrillation of unmodified α-syn (20, 21). In addition, α-syn oligomers, formed under oxidative conditions, are not degraded by the proteasome (22).
A study on the fatty acid-induced α-syn aggregation aimed to define the molecular mechanism and the structural organization of the products due to lipid peroxidation is still missing. It is unclear whether the oligomerization and chemical modification of α-syn are independent or, instead, tightly linked processes. In support of a functional interplay between α-syn modification and oligomer formation, it was reported that exposure of cultured dopaminergic cells to PUFA results in the formation of α-syn oligomers, associated with cytotoxicity (16).
We previously observed a mutual effect in the interaction between monomeric α-syn and DHA in vitro (23). DHA is induced to form small oil droplets. α-syn acquires an α-helical secondary structure with a rapid equilibrium between its free and the lipid-bound form. In the α-helical form, the protein segment 73–102 is flexible and is not characterized by a persistent structure. Considering that prolonged exposure of α-syn to fatty acids induces oligomerization of the protein (15), in this study we further analyze the aggregation process of α-syn in the presence of DHA and evaluate the effects of the formed oligomers on cell viability.
EXPERIMENTAL PROCEDURES
Materials
DHA was purchased from Sigma. All other chemicals were of analytical reagent grade and were obtained from Sigma or Fluka (Buchs, Switzerland). Aliquots of DHA were stored at a concentration of 76 mm in 100% ethanol at −80 °C under a helium atmosphere to prevent oxidation.
Expression and Purification of Recombinant Human α-Synuclein
Human α-synuclein was expressed in the Escherichia coli BL21(DE3) cell line transfected with the pET28b/α-syn plasmid. Overexpression of the protein was achieved by growing cells in LB medium at 37 °C to an A600 nm of 0.6 followed by induction with 0.5 mm isopropyl β-thiogalactopyranoside for 4 h. The purification of the recombinant protein was conducted following a procedure described previously with minor modifications (23, 24). Further purification was obtained by RP-HPLC, and the identity and integrity of the eluted material were assessed by mass spectrometry.
Aggregation Experiments
To analyze the aggregation process of α-syn, samples were incubated at 37 °C for up to 30 days at a protein concentration of 50 μm, in PBS (8 mm Na2HPO4, 137 mm NaCl, 2 mm KH2PO4, 2.7 mm KCl, pH 7.4), in the presence of DHA (0.5 and 2.5 mm) to obtain a protein/fatty acid molar ratio of 1:10 and 1:50, under shaking at 500 rpm with a thermo-mixer (Compact, Eppendorf, Hamburg, Germany). The same control experiment was conducted in the absence of DHA. Aliquots of the samples, collected at the indicated time points during incubation, were examined by native- and SDS-PAGE, thioflavin T (ThT) binding assay, circular dichroism (CD), FTIR spectroscopy, transmission electron microscopy (TEM), atomic force microscopy (AFM), gel filtration (GF) chromatography, and RP-HPLC. SDS- and native-PAGE were performed with a Mini-PROTEAN II Bio-Rad electrophoresis system using a Tris-HCl 13% (w/v) polyacrylamide gel. Native gel (nondenaturing) was performed on the same system without SDS in gel and in running or loading buffers. The bands were visualized by Coomassie Blue or Silver staining. Approximately 5 μg of protein were loaded into each well.
ThT Binding Assay
The ThT binding assays were performed accordingly to LeVine (25) using a 25 μm ThT solution in 25 mm sodium phosphate, pH 6.0. Aliquots (30 μl) of protein samples containing aggregates were taken at specified times and diluted into the ThT buffer. Fluorescence emission measurements were conducted at 25 °C using an excitation wavelength of 440 nm and recording the ThT fluorescence emission at 484 nm.
Structural Characterization
Protein concentrations were determined by absorption measurements at 280 nm using a double-beam Lambda-20 spectrophotometer (PerkinElmer Life Sciences). The molar absorptivity at 280 nm for α-syn was 5960 cm−1 m−1, as evaluated from its amino acid composition by the method of Gill and von Hippel (26). Circular dichroism spectra were recorded on a Jasco (Tokyo, Japan) J-710 spectropolarimeter, using a 1-mm path length quartz cell and a protein concentration of 8 μm. The mean residue ellipticity [θ] (degree·cm2·dmol−1) was calculated from the formula [θ] = (θobs/10)·(MRW/lc), where θobs is the observed ellipticity in degrees; MRW is the mean residue molecular weight of the protein; l the optical path length in cm; and c is the protein concentration in g/ml. The spectra were recorded in PBS.
Fourier transform infrared spectroscopy (FTIR) was conducted on a 1720× spectrometer (PerkinElmer Life Sciences). α-syn was suspended in D2O for 1 h to allow the hydrogen to deuterium exchange and then was lyophilized under vacuum. The spectra were recorded on protein samples in the absence and presence of DHA and after 15 days of incubation. For the samples corresponding to α-syn alone or in the presence of DHA (P/DHA 1:10), the aggregated species were isolated by ultracentrifugation (380,000 × g) and redissolved in 20 mm Tris-DCl, 150 mm NaCl, pH 7.5* (uncorrected for isotopic effects), at 5 mg/ml. In the case of soluble oligomers induced by protein (P)/DHA 1:50, we have recorded an FTIR spectrum of the whole mixture after 15 days of incubation at a final protein concentration of 0.7 mg/ml. Samples were placed between CaF2 windows, separated by a 50-μm thick Mylar spacer. The samples and the detector compartment were thoroughly purged with N2. Spectra represent averages of 50 scans recorded between 4000 and 1000 cm−1 at a resolution of 2 cm−1. All spectra were base-line-corrected, blank-subtracted, and smoothed using a Savitzky-Golay filter by Grams 32 program version 4.14 (Galactic Industries Corp., Salem, NH). The second derivative of the amide I band was used to identify the different spectral components. Curve fitting was performed with Gaussian and Lorentzian line shapes, with bandwidths varying between 15 and 25 cm−1 (27, 28).
Transmission Electron Microscopy
To evaluate the morphology and the size of the aggregates, aliquots of the samples were examined by transmission electron microscopy. For the negative staining, a drop of the sample solution was placed on a Butvar-coated copper grid (400-square mesh) (TAAB-Laboratories Equipment Ltd., Berks, UK), dried, and negatively stained with a drop of uranyl acetate solution (1%, w/v). TEM pictures were taken on a Tecnai G2 12 Twin instrument (FEI Company, Hillsboro, OR), operating at an excitation voltage of 100 kV.
Atomic Force Microscopy
For AFM measurements, the aggregate suspensions were diluted 500 times using Milli-Q water, and 10-μl aliquots of each sample were deposited on freshly cleaved mica and dried under mild vacuum. Sample dilution was performed to avoid the formation of salt crystals upon sample drying. Tapping mode AFM images were acquired in air using a Dimension 3100 scanning probe microscope equipped with a “G” scanning head (maximum scan size 100 μm) and driven by a Nanoscope IIIa controller and a Multimode scanning probe microscope equipped with an “E” scanning head (maximum scan size 10 μm) and driven by a Nanoscope IV controller (Digital Instruments, Veeco, Santa Barbara, CA). Single beam uncoated silicon cantilevers (type Olympus OMCL-AC160TS, Olympus, Tokyo, Japan) were employed. The drive frequency was between 280 and 300 kHz, and the scan rate was between 0.5 and 2.0 Hz. Aggregate sizes were measured from the heights in cross-section in the topographic AFM images.
Chemical Characterization
Gel filtration chromatography was performed with a Superdex 75 10/300GL column (Amersham Biosciences), using an ÄKTA FPLC system (Amersham Biosciences). Aliquots (200 μl) of samples taken from the aggregation mixture were loaded into the column and eluted at 0.4 ml/min in 20 mm Tris-HCl, 0.15 m NaCl, pH 7.4. The effluent was monitored by recording the absorbance at 214 nm. The molecular weight value for the α-syn samples was estimated using the following standards: blue dextran, 2000 kDa; β-amylase, 200 kDa; albumin, 67 kDa; ovalbumin, 45 kDa; carbonic anhydrase, 29 kDa, α-lactalbumin, 14.4 kDa and aprotinin, 6.5 kDa.
The HPLC analyses were conducted using a Jupiter C4 column (4.6 × 150 mm; Phenomenex, CA) eluted with a gradient of acetonitrile, 0.085% TFA versus water, 0.1% TFA from 5 to 38% in 5 min and from 38 to 43% in 15 min. The effluent was monitored by recording the absorbance at 226 nm. The identity of the eluted material was assessed by mass spectrometry and carried out with an electrospray ionization (ESI) mass spectrometer with a Q-Tof analyzer (Micro) (Waters Associates, Manchester, UK). The measurements were conducted at a capillary voltage of 2.5 kV and a cone voltage of 30–35 V.
Cell Toxicity Assays
Dopaminergic SH-SY5Y cells were treated with 0.5 μm α-syn or α-syn/DHA 1:50 either before or after incubation for 48 h as described above. α-Syn/DHA samples have been further subjected to size exclusion chromatography to isolate the oligomeric species. α-Syn/DHA 1:50 sample has been also ultrafiltrated with VivaSpin (membrane 5000 molecular weight cutoff PES, VivaScience Ltd., Stonehouse, UK) to separate α-syn/DHA oligomers (retentate fraction) from smaller products such as DHA autoxidation (filtrate fraction). After 24 h, cells were fixed with 4% paraformaldehyde and stained for DNA double strand breaks using a terminal deoxynucleotidyltransferase dUTP nick end labeling (TUNEL) cell death detection kit (Roche Diagnostics). Cells were also stained with monoclonal anti-α-syn antibodies (BD Biosciences) and counterstained with Hoechst 33242. TUNEL-positive cells were counted in three replicate cultures, acquiring an average of 15–30 fields per culture. The experiment has been repeated three times independently.
RESULTS
Aggregation of α-syn in the Presence of DHA: Kinetics, and Structural Characterization
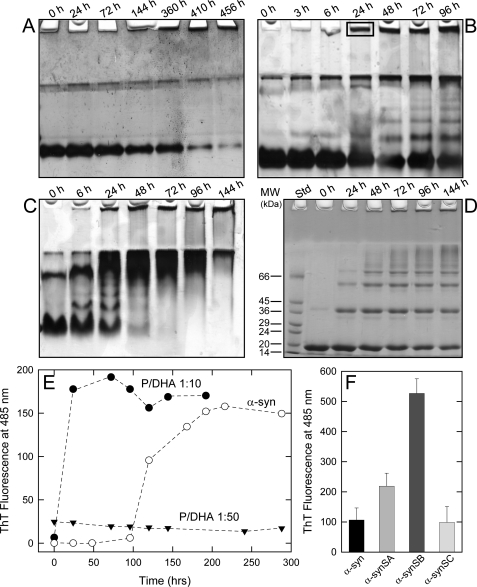
α-syn was incubated in the absence and in the presence of DHA (molar ratio protein/fatty acid, P/DHA, of 1:10 and 1:50) at a protein concentration of 50 μm in phosphate buffer, pH 7.4, at 37 °C, under shaking. The effect of DHA on α-syn aggregation kinetics was monitored by native (Fig. 1, A–C), SDS- (Fig. 1D) PAGE and ThT fluorescence assay (Fig. 1E). In the absence of DHA, α-syn migrates as a compact band, whereas its relative intensity is reduced as aggregation proceeds (Fig. 1A). After 144 h of incubation, the presence of precipitated protein material in the loading wells indicates the formation of high molecular weight aggregates. Incubating the protein in the presence of DHA (Fig. 1, B and C), we observe novel species with reduced gel mobility when compared with the monomer. Bands with lower mobility increase during incubation. This evidence suggests a significant degree of aggregation, which increases over time and is consistent with the formation of dimers, trimers, tetramers, and further higher molecular weight species. Within 24 h of incubation, insoluble gel-excluded protein species were detected (Fig. 1B). Strong bands in the upper range of the native gels are visible at the interface between the resolving and stacking gel, and their intensity does not change over time. They could be due to products of generic protein aggregation. Aliquots taken from the mixture of α-syn incubated with DHA (P/DHA 1:50) were analyzed by SDS-PAGE (Fig. 1D), showing that the aggregates are SDS-resistant, as reported previously (12, 13, 19). To further analyze the solubility properties of these aggregates, the samples were treated with DMSO and than loaded onto a SDS-PAGE (supplemental Fig. S1B), without any detectable effect. The aggregation of α-syn was followed by ThT fluorescence assay (Fig. 1E). The increase in ThT signal observed during the incubation of α-syn in PBS buffer follows a sigmoid curve and is consistent with an amyloid nucleation-dependent aggregation process (29). In the case of the aggregation conducted in the presence of DHA using a P/DHA of 1:10, the fluorescence of the dye starts to increase rapidly, and a plateau was reached within 10 h. In the case of the aggregation conducted using a P/DHA of 1:50, samples do not produce any increase of ThT fluorescence, suggesting the absence of ordered amyloid-like structures able to selectively bind the dye. To evaluate the possibility that the species formed in the presence of DHA could be on-pathway intermediates in the α-syn fibril formation process, their seeding properties have been tested (Fig. 1F). The samples used for seeding were as follows: 1) fibrils from α-syn incubated for 15 days (named SA); 2) ThT-positive samples from α-syn incubated for 72 h in the presence of DHA (molar ratio P/DHA 1:10) (SB); and 3) ThT-negative samples from α-syn in the presence of DHA (P/DHA 1:50) for 72 h (SC). The addition of preformed ThT-positive α-syn aggregates, obtained in the absence or in the presence of DHA (P/DHA 1:10), causes the seeding of α-syn, as evidenced by the increase of the ThT signal of seeded samples compared with α-syn alone after 72 h of incubation. Conversely, the species formed in the presence of a high amount of DHA (SC) do not exert any seeding effect.
FIGURE 1.
Aggregation of α-syn. The aggregation process of α-syn was monitored by native- (A–C) and SDS- (D) PAGE. The protein was incubated at 37 °C in PBS buffer, pH 7.4, in the absence (A) and in the presence of DHA (B, molar ratio P/DHA 1:10; C and D, molar ratio P/DHA 1:50). Aggregation of α-syn was followed by ThT binding assays (E). The protein was dissolved in PBS buffer at a 50 μm concentration to induce the formation of protein aggregates, in the absence (empty circles) and presence of DHA, in a molar ratio of P/DHA 1:10 (black circles) and 1:50 (triangles). The excitation wavelength was fixed at 440 nm, and the fluorescence emission was collected at 485 nm. F, effect of seeding on aggregation. The samples used for seeding experiments were α-syn fibrils (SA), ThT-positive aggregated α-syn after 72 h of incubation in the presence of DHA (P/DHA 1:10) (SB), and ThT-negative aggregated α-syn after 72 h of incubation in the presence of DHA (P/DHA 1:50) (SC).
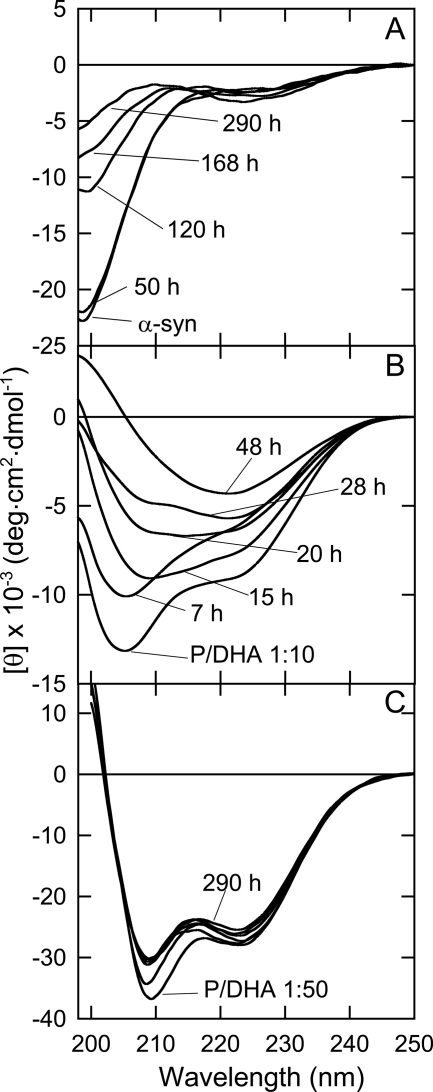
The structural characterization of the species formed during aggregation was conducted using both circular dichroism (CD) (Fig. 2) and FTIR (Fig. 3). In the absence of DHA, α-syn undergoes a conformational transition from random to β-sheet structure during incubation (Fig. 2A). In the presence of DHA (P/DHA 1:10), the CD measurement shows a contribution of both α-helical and random structure, indicating that about 65% of α-syn molecules are unfolded (Fig. 2B), as described previously (23). Within a few hours, the shape of the spectrum starts to change with a decrease of the minima relative to α-helical structure and the appearance of a new signal at about 218 nm, characteristic of β-sheet structure (48 h). The CD spectrum of α-syn incubated at P/DHA 1:50 shows that the protein acquires an α-helical structure (Fig. 2C). Although the spectrum shape does not change over time, the intensity of the CD signals slightly decreases during incubation.
FIGURE 2.
Aggregation monitored by CD spectroscopy. Far-UV CD spectra of α-syn in the absence (A) and in the presence of DHA (P/DHA 1:10) (B) and P/DHA 1:50 (C) during incubation at 37 °C in PBS buffer, pH 7.4. Aliquots were withdrawn from the aggregation mixture and diluted 6-fold to have a final protein concentration of 8 μm.
FIGURE 3.
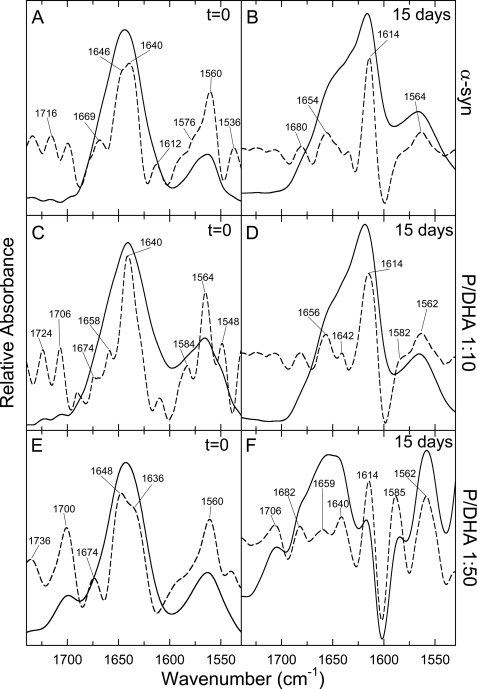
FTIR spectroscopy. FTIR spectra of α-syn in the absence (A and B) and in the presence of DHA in ratio P/DHA of 1:10 (C and D) and of 1:50 (E and F) are shown. The spectra were obtained on samples just prepared (left column) and after 15 days of incubation (right column). The second derivatives of the amide I bands (dashed line) were used to identify the different spectral components. For details about samples preparation see “Experimental Procedures.”
The FTIR spectra were recorded on α-syn samples in the absence and in the presence of DHA (Fig. 3, left column) and after 15 days of incubation (Fig. 3, right column). The FTIR spectrum of the protein before incubation is indicative of a natively unfolded structure (Fig. 3A), as confirmed by the presence of a prevalent band at 1640 cm−1 in its second derivative spectrum (Fig. 3A, dashed line). After 15 days of incubation, the spectrum of α-syn shows a reduction of the band at 1640 cm−1 and the appearance of a band at 1614 cm−1, previously assigned to aggregated β-structure (Fig. 3B, dashed line) (28). The second derivative FTIR spectrum of α-syn in the presence of 1:10 DHA before incubation shows a band centered at 1640 cm−1, indicative of a random structure (Fig. 3C), and after 15 days of incubation, the main band is shifted to 1614 cm−1, corresponding to cross-β-sheet (Fig. 3D). The second derivative spectrum of α-syn/DHA in a ratio of 1:50 before incubation shows the presence of a main band centered at 1648 cm−1, corresponding to α-helix (Fig. 3E, dashed line). After incubation, the FTIR spectrum shows the presence of α-helical structure (band at 1659 cm−1), random structure (band at 1640 cm−1), and cross-β-structure (band at 1614 cm−1) (Fig. 3F). In Table 1 the calculated secondary structure content of α-syn in the absence and in the presence of DHA is reported. The quantitative analysis performed with curve-fitting procedures indicates that α-syn before incubation and in the absence of DHA contains a prevalence of random structure (83%, band at 1640 cm−1), and in the presence of 1:10 DHA α-syn contains a mixture of random (76%) and α-helix structure (9%, band at 1658 cm−1), and in the presence of 1:50 DHA a prevalence of α-helix structure was evidenced (61%, band at 1648 cm−1). Interestingly, aggregates formed by α-syn alone contain a higher amount of cross-β-structure (47%, calculated from the sum of the contribution of the bands at 1612–1626 and 1680–1690 cm−1) than aggregates formed in the presence of DHA (P/DHA 1:10) (34%). Of note, the cross-β-structure content in α-syn samples aggregated in the presence of DHA (P/DHA 1:50) is only 10% (Table 1). Moreover, the presence of the fatty acid is correlated to significant differences in the intensity of the band (1640 cm−1) corresponding to residual random structure in the aggregated species (13% for α-syn, 65% for P/DHA 1:10 and 35% for P/DHA 1:50). Only aggregates formed in the presence of DHA (P/DHA 1:50) maintain α-helical structure (55%, band at 1659 cm−1) (Table 1).
TABLE 1.
Secondary structure content of α-syn in the presence and absence of DHA, as determined by FTIR spectroscopy
| Wave numbera | Structural assignment | α-syn %b |
P/DHA 1:10 %b |
P/DHA 1:50 %b |
|||
|---|---|---|---|---|---|---|---|
| t0c | tfd | t0c | tfd | t0c | tfe | ||
| cm−1 | |||||||
| 1530 | β-Sheet (amide II) | 4 | 1 | ||||
| 1548 | β-Turns (amide II) | 6 | |||||
| 1612–1614 | Aggregated β-sheet | 4 | 46 | 34 | 8 | ||
| 1634–1636 | Anti-parallel β-sheet | 16 | 34 | ||||
| 1640–1645 | Random | 83 | 13 | 76 | 65 | 35 | |
| 1648–1658 | α-Helix/turns | 9 | 61 | 55 | |||
| 1654–1674 | Turns | 13 | 20 | 9 | |||
| 1674 | Anti-parallel β-sheet | 5 | |||||
| 1680–1690 | Anti-parallel aggregated β-sheet | 1 | 2 | ||||
a The peak position of the amide I band components is given, as deduced by the second derivative spectra.
b Percentage areas of the amide I band components, as obtained by integrating the area under each deconvoluted band. The areas corresponding to side chain contributions located at 1514–1608 and 1700–1724 cm−1 have not been considered.
c Percentage area of the amide I band components derived from FTIR spectra of α-syn in Tris−DCl buffer before aggregation (t0) at a final protein concentration of 1 mg/ml.
d Percentage area of the amide I band components derived from FTIR spectra of pellets obtained by ultracentrifugation of α-syn samples incubated in Tris−DCl buffer for 15 days, dissolved at a final protein concentration of 5 mg/ml.
e Percentage area of the amide I band components derived from the FTIR spectrum of the whole mixture of α-syn incubated in Tris−DCl buffer for 15 days in the presence of P/DHA 1:50 at 0.7 mg/ml final protein concentration.
In summary, native-PAGE, ThT fluorescence assay, and spectroscopic measurements clearly indicate that in the presence of a P/DHA ratio of 1:10, α-syn forms structures that share some features with amyloid-like fibrils. Using a P/DHA ratio of 1:50, ThT-negative aggregates with small amount of β-structure are formed.
Morphological Characterization: Oligomeric and Fibrillar State
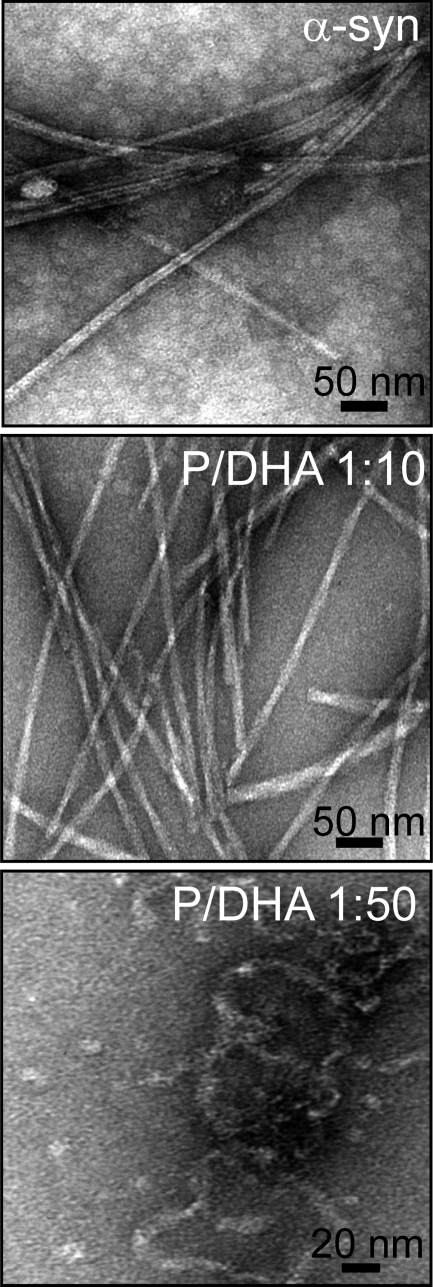
Fig. 4 shows TEM images of aggregates formed by α-syn in the absence and in the presence of DHA after 1 week of incubation. In samples corresponding to α-syn alone and in the presence of DHA (P/DHA 1:10), linear unbranched fibrils were observed. In the absence of the fatty acid, the fibrils appear long, laterally aligned, and clustered together with an average diameter of 7 nm. In the presence of DHA (P/DHA 1:10), fibrils are twisted around each other with a diameter of 8–14 nm. For α-syn/DHA 1:50, we observed a heterogeneous population of aggregated species. Spherical oligomers (11 nm) and worm-like aggregates with a characteristic “beaded” appearance are detectable (30).
FIGURE 4.
Analysis of the aggregate morphology by TEM. TEM pictures relative to α-syn samples after 1 week of incubation in the absence (top panel) and in the presence of DHA (molar ratio P/DHA 1:10 (middle panel); P/DHA 1:50 (bottom panel)) were reported.
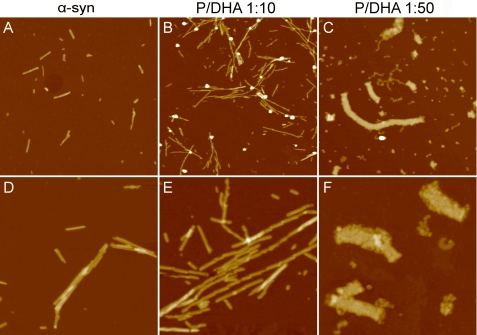
Fig. 5 shows tapping mode AFM images comparing the morphologies of α-syn aggregates formed after 1 month of incubation in the absence and in the presence of DHA. Fibrillar structures are observed for both α-syn and α-syn/DHA 1:10 (Fig. 5, A and D and B and E, respectively). However, a larger number of fibrillar structures are formed in the presence of DHA. On average, these fibrils are longer than those observed for α-syn alone and are composed of shorter segments. The statistical analysis of AFM data yields a mean segment length of 204 ± 6 nm for α-syn alone and 98 ± 3 nm for α-syn/DHA 1:10. The fibril height is 7.7 ± 0.2 nm for α-syn alone, whereas a significantly larger value of 8.5 ± 0.2 nm was obtained for α-syn/DHA 1:10. A completely different behavior was found for α-syn/DHA 1:50. In this case, ribbon-like structures are formed, with a mean height of 12.2 ± 0.2 nm. These structures display a beaded ultrastructure, as they seem to result from the lateral assembly of spheroidal aggregates and coexist with beaded protofibrils (Fig. 5, C and F).
FIGURE 5.
Analysis of the aggregate morphology by AFM. Tapping mode AFM images (height data) of α-syn aggregates were obtained after 1 month of incubation in the absence (A and D) and in the presence of DHA at a molar ratio P/DHA 1:10 (B and E) and 1:50 (C and F). Scan size was 2.4 μm (A–C) and 1.0 μm (D–F); Z range was 25 nm (A, B, D, and E) and 30 nm (C and F).
Chemical Characterization of Aggregated Species Formed in the Presence of DHA
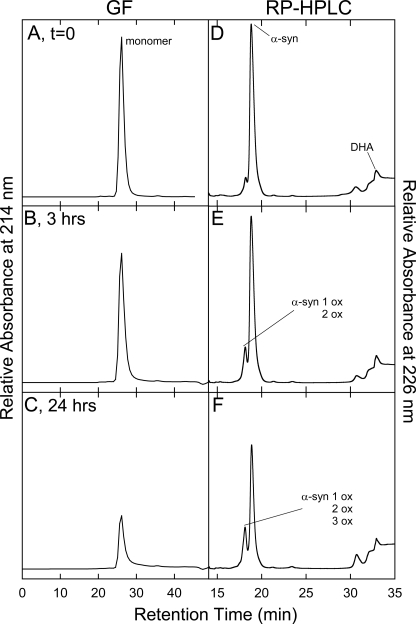
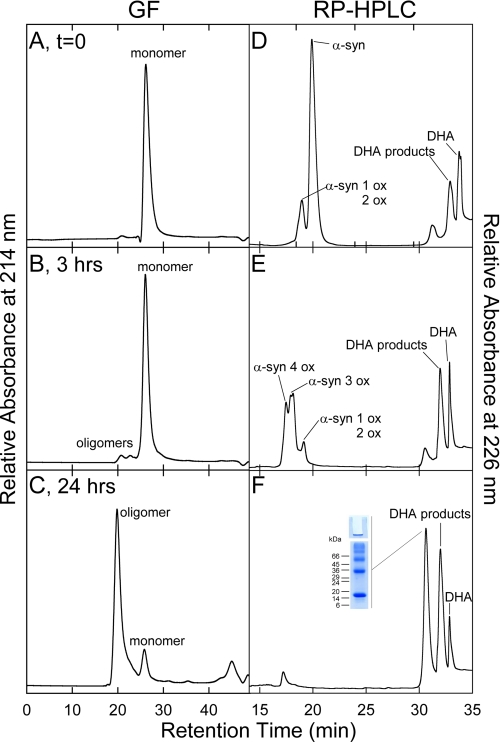
The mixtures of α-syn and DHA (molar ratio P/DHA 1:10 and 1:50) were analyzed by GF chromatography and RP-HPLC during incubation, with the purpose of correlating the physical properties of the samples with their chemical composition. The protein material eluted by GF was characterized by RP-HPLC and mass spectrometry (supplemental Fig. S3). Aliquots corresponding to different times of incubation (from 0 to 24 h) of the mixture composed of α-syn and DHA (molar ratio P/DHA 1:10) were loaded onto a Superdex 75 column. A progressive reduction of the peak relative to α-syn was observed without formation of an appreciable amount of other protein species (Fig. 6 and Table 2). The same behavior was observed in the case of samples of α-syn incubated without the fatty acid (data not shown). In Fig. 7 the GF chromatograms relative to 0, 3, and 24 h of the aggregation mixture of α-syn in the presence of DHA, in a molar ratio of 1:50, are reported. The GF profile shows a major species eluting at ∼28 min (Fig. 7A) and a minor species (1%) with lower retention time (RT of 20 min). After 3 h of incubation, the fraction of the low RT species increases, and after 24 h this species is the main component of the mixture (Fig. 7, B and C). The mixture of α-syn and DHA was also directly injected in RP-HPLC (Fig. 7, right column). The chromatogram corresponding to the starting condition (Fig. 7D) shows two groups of peaks. The first peak is around 18 min, and the other peak is centered at 32 min and includes three peaks (RT of 30.5, 32, and 33 min). As incubation proceeds, the peaks with RT of 18 and 33 min decrease in intensity, whereas the peak with a RT of 30.5 min increases.
FIGURE 6.
Chromatographic analysis of the aggregation mixture of α-syn/DHA 1:10. A gel filtration (left column) analysis was conducted on samples withdrawn from the aggregation mixture of α-syn in the presence of DHA (P/DHA 1:10) and after 0 (A), 3 (B), and 24 (C) h of incubation. A Superdex 75 10/300GL column was used and eluted with 20 mm Tris-HCl, 150 mm NaCl, pH 7.4, at a flow rate of 0.4 ml/min. The same samples were also analyzed by RP-HPLC (right column, D–F), using a Jupiter C4 column. The chemical identity of the peaks was assessed by mass spectrometry (Table 2).
TABLE 2.
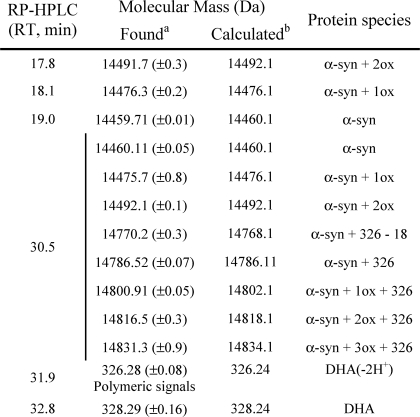
Molecular masses of material contained in the major fractions of the chromatograms RP-HPLC reported in Fig. 6 (right column)
a Experimental molecular masses were determined by ESI-MS.
b Molecular masses were calculated from the amino acid sequence of α-syn (49), and in the case, of DHA, only the mono-charged signal has been found.
FIGURE 7.
Chromatographic analysis of the aggregation mixture of α-syn/DHA 1:50. A gel filtration (left column) analysis was conducted on samples withdrawn from the aggregation mixture of α-syn in the presence of DHA (P/DHA 1:50) and after 0 (A), 3 (B), and 24 (C) h of incubation. A Superdex 75 10/300GL column was used, eluted with 20 mm Tris-HCl, 150 mm NaCl, pH 7.4, at a flow rate of 0.4 ml/min. The same samples were also analyzed by RP-HPLC (right column, D–F), using a Jupiter C4 column. The chemical identity of the peaks was assessed by mass spectrometry (Table 3).
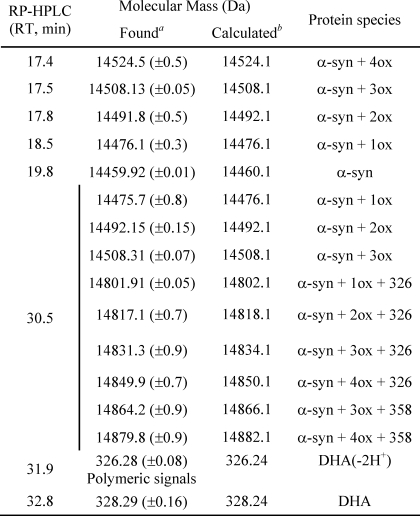
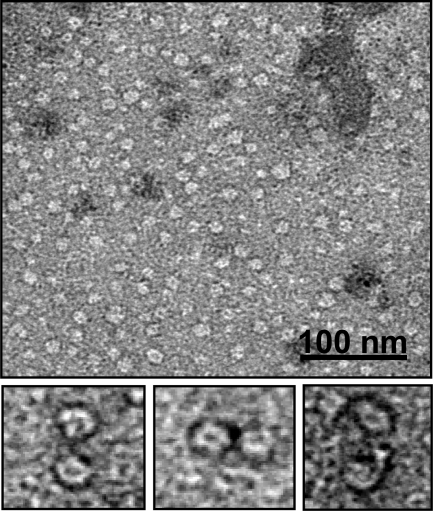
To identify the peak eluting at 28 min in GF corresponding to the group of peaks eluting at about 18 min in RP-HPLC (Fig. 7D), the protein material was analyzed by ESI-MS. From the MS spectra, α-syn is present both as native (14,460.1 Da) and as oxidized protein (increased by 16 and 32 Da) (Table 2). α-syn polypeptide chain contains four methionine residues, easily oxidized (20). Mapping of the peptides formed after trypsin digestion of the oxidized protein showed the presence of peptide peaks containing oxidized Met residues (supplemental Fig. S2 and supplemental Table S1). As incubation proceeds, the species corresponding to oxidized α-syn increase, and after 24 h, only tetra-oxidized protein (+64 Da) is present (Table 3). In analogy, we analyzed the GF fraction eluting at 20 min and the corresponding group of peaks centered at 32 min in RP-HPLC. This group contains both protein material (RT of 30.5 min) and DHA-derived products (RT of 32–33 min). The fact that this material elutes in RP so late suggests that it is either very hydrophobic, aggregated, or chemically modified. Indeed, MS analysis (Table 3 and supplemental Fig. S3) shows that the 30.5-min peak contains oxidized and chemically modified forms of α-syn, whereas the 32–33-min peaks contain DHA (328.2 Da), its early peroxidation products (326.2 Da) (supplemental Figs. S4 and S5), and polymeric forms of the fatty acid. In detail, after 3 h of incubation α-syn is mono-, bi-, and tri-oxidized (+16, +32, and +48 Da), as suggested by the MS spectrum relative to the peak with RT of 30.5 (supplemental Fig. S3). In addition, a series of signals with a mass increase of 326 and 358 Da (Table 3) was observed. These mass differences are consistent with the covalent modification of the protein for the addition of allylic radical of DHA (326 Da) and hydroperoxide radical (358 Da), the earlier products of DHA autoxidation (31). The MS analysis of the same peak corresponding to 24 h contains tetra-oxidized α-syn and modified protein species. The material corresponding to this peak was loaded onto SDS-PAGE, showing that stable SDS-resistant species are present (Fig. 7F, inset). To assess the stability of these aggregates, we re-loaded the fraction eluted in GF (RT of 20 min) verifying the absence monomer species (data not shown). Moreover, TEM analysis of this fraction (Fig. 8) shows the presence of uncompleted and completed annular structures. The latter species have a diameter of about 13 nm, with a 5-nm cavity.
TABLE 3.
Molecular masses of material contained in the major fractions of the RP-HPLC chromatograms reported in Fig. 7 (right column)
a Experimental molecular masses were determined by ESI-MS.
b Molecular masses were calculated from the amino acid sequence of α-syn (49), and in the case of DHA, only the mono-charged signal has been found.
FIGURE 8.
TEM image of α-syn oligomers isolated by gel filtration (Fig. 7C, RT of 20.5 min) after 24 h of incubation of α-syn in the presence of DHA (P/DHA 1:50). A gallery of panels relative to magnification of some annular structures is reported below.
Chemical Characterization of Fibrils Formed in the Presence of DHA (P/DHA 1:10)
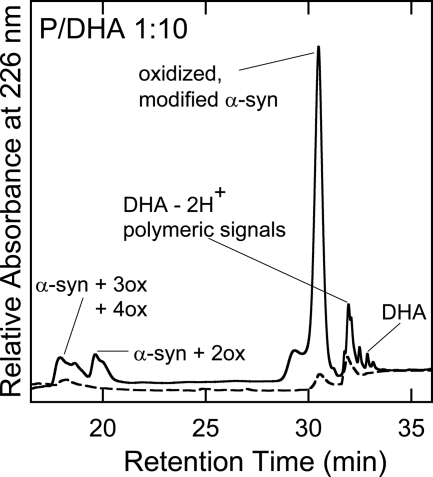
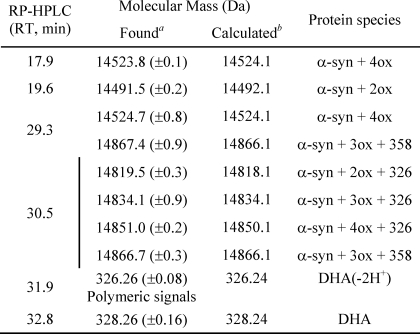
The α-syn fibrils formed after 15 days of incubation in the presence of DHA (P/DHA 1:10) were purified from nonaggregated soluble material by ultracentrifugation. The main fraction of the total α-syn content was found in the pellet, indicating that almost all protein material aggregated. The composition of the species in the pellet and supernatant was checked by RP-HPLC under the same conditions used for the analysis of the mixture P/DHA 1:50 (Fig. 9). To conduct the RP-HPLC analysis, the pellet and supernatant were treated with 7.4 m guanidine hydrochloride to dissolve the aggregates. In the isolated pellet (Fig. 9, continuous line), oxidized forms of α-syn, protein molecules modified by allylic radicals, and hydroperoxide radicals of DHA were detected (Fig. 9 and Table 4). Interestingly, DHA molecules were found in the pellet, suggesting that the fatty acid is a component of the fibril.
FIGURE 9.
Chromatographic analysis of the aggregation mixture α-syn/DHA 1:10. RP-HPLC analysis of the aggregation mixture of α-syn in the presence of DHA (P/DHA 1:10), after ultracentrifugation at 380,000 × g for 90 min. The pellet (continuous line) was resuspended in 7.4 m guanidine hydrochloride overnight and loaded into Jupiter C4 column using the gradient already described for the chromatogram in Fig. 6. The supernatant is represented by a dashed line. The chemical identity of the peaks was assessed by mass spectrometry (Table 3).
TABLE 4.
Molecular masses of material contained in the major fractions of the RP-HPLC chromatograms reported in Fig. 9
a Experimental molecular masses were determined by ESI-MS.
b Molecular masses were calculated from the amino acid sequence of α-syn (49), and in the case of DHA, only the mono-charged signal has been found.
α-Syn/DHA Oligomers Are Toxic to Cultured SH-SY5Y Dopaminergic Cells
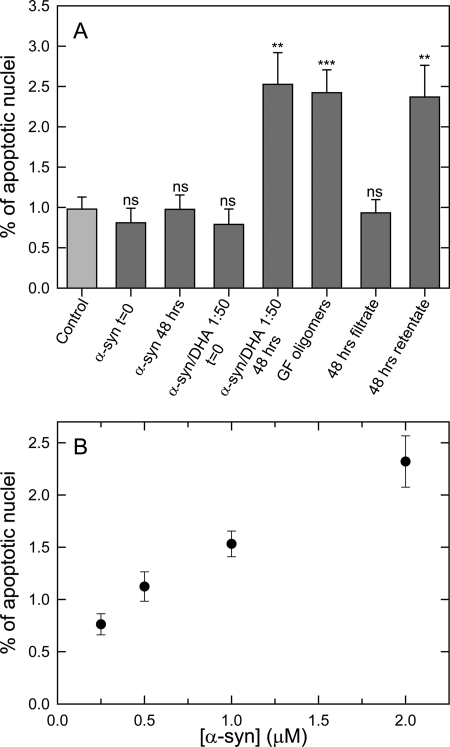
To investigate the effect of the α-syn/DHA samples formed at the P/DHA 1:50 on cell systems, we treated the dopaminergic line SH-SY5Y with oligomeric aggregates induced by DHA. 24 h after treatment, the number of TUNEL-positive cells was increased by α-syn/DHA oligomers (reaction mixture and GF fraction corresponding to the oligomers, see above) compared with mock control or α-syn. To exclude the possibility that the observed toxicity was due to oxidation products of DHA, we used ultrafiltration to separate α-syn/DHA oligomers (retentate fraction) from DHA oxidation products (filtrate fraction). The retentate fraction increased (p > 0.01) the amount of TUNEL-positive cells to the same levels as those treated with the total mixture (p > 0.01) and the GF fraction (p > 0.001) of α-syn/DHA oligomers, whereas the filtrate fraction had an effect on cell viability comparable with control samples (Fig. 10A). We further examined whether there was a dose effect by treatment with α-syn/DHA oligomers purified by GF on cell viability. As shown in Fig. 10B, exposure of increasing concentrations of α-syn/DHA oligomers (from 0.25 to 2 μm of α-syn) proved toxic to cells in a dose-response manner, further supporting the noxious effect of these species.
FIGURE 10.
Cytotoxicity of α-syn/DHA 1:50 oligomers assessed by TUNEL assay. SH-SY5Y cells, at a density of about 105 cells/cm2 (70% confluency), were treated with different types of α-syn aggregation species (in the presence or absence of DHA 0 or 48 h post-aggregation; the GF fraction of the oligomeric P/DHA species; filtrate and retentate fraction of the ultracentrifuged samples) at a α-syn concentration of 0.5 μm or mock control (A). ns, not significant. Then immunostainings with anti-α-syn antibody, Hoechst counterstaining, and TUNEL assay were conducted. The number of TUNEL-positive cells was calculated as a percentage of the total counterstained cells. Quantitation (n = 3 cultures, with 15–30 fields analyzed per culture; error bars indicated the S.E.) indicated that P/DHA oligomers increased the percentage of TUNEL-positive cells in a dose-dependent manner (B). Statistical significance was calculated by one-way ANOVA (p < 0.01 for P/DHA oligomers and the retentate fraction and p < 0.001 for the GF fraction compared with mock control or samples α-syn without DHA).
DISCUSSION
Oligomers and β-sheet-containing amyloid fibrils of α-syn are hallmarks in the pathogenesis of PD. Their formation is associated with the progressive loss of dopaminergic neurons (32), excessive accumulation of iron and other transition metals (33), the generation of reactive oxygen species (34), alterations in the concentration of dopamine or its metabolites (35), and also genetic factors (1–3, 36). The lipid binding property of α-syn could be another key aspect in the onset and progression of PD. This likelihood is suggested both by the appearance of toxic α-syn multimers in cultured cells after PUFA treatment (15, 16) and by the ability of the protein to alter fatty acid metabolism (11, 12). However, it is not clear how a direct effect of the fatty acids on the protein structure and function can alter the normal neuronal functions and lead to neurodegeneration.
In this study, we have analyzed the effect of DHA oil droplets on the kinetic of amyloid-like aggregation of α-syn and the morphology and structure of the aggregates. We found that α-syn aggregation is promoted by the presence of DHA, but the aggregation products are structurally and morphologically different as a function of the ratio between the protein and the fatty acid. Moreover, DHA induces chemical modifications on α-syn, methionine oxidation, and formation of adducts with the early peroxidation products of DHA. We hypothesize that these chemical modifications modulate the structure and the stability of the oligomeric species.
α-Syn-DHA interaction affects the kinetics of protein aggregation in a concentration-dependent manner. The presence of DHA (P/DHA molar ratio 1:10) increases the speed of amyloid-like fibrils formation. The protein undergoes structural conversion to a cross-β-sheet structure, as seen by both CD and FTIR spectroscopies. The fibrils are long and unbranched, as assessed by TEM and AFM. However, there are some differences with fibrils formed in the absence of DHA. The height evaluated by AFM clearly indicates that these fibrils are larger than those obtained in the absence of DHA. They present a twisted morphology and seem to be composed of short segments partially overlapped. Moreover, the lower cross-β-structure content and higher amount of random contributions deduced by FTIR spectroscopy suggest a less packed structure in comparison with α-syn fibrils. These results lead to the hypothesis that DHA is a constituent of the aggregated structure. As part of the fibril, DHA could affect both the fraction and the packing of the β-strands in the structure, which can result in the observed difference in the size of the fibril. Another remarkable point concerns the protein intermediates in the aggregation process conducted using P/DHA 1:10. Dimers, trimers, and higher molecular weight species are visible on native gel (Fig. 1B) but not on gel filtration (Fig. 6), indicating that these species are transient and unstable. A P/DHA molar ratio of 1:50 leads to formation of stable oligomeric species. These oligomers are DMSO- and SDS-resistant, do not bind ThT, and lack seeding properties, suggesting that they are off-pathway in the aggregation process. Structurally, they contain a moderate amount of β-sheet structure and a high content of α-helical and random structure. Moreover, the oligomers mainly have spherical and annular morphologies.
Our results indicate that the presence of the fatty acid affects both the environment and the structure of α-syn. Under our experimental conditions (25 °C, pH 7.4), above a critical concentration, DHA forms oil droplets as described previously (23, 37). Oil droplets, at variance from vesicles, do not present a bilayer and consist of a core of neutral molecules surrounded by a slightly negatively charged monolayer. DHA lipid droplets recruit α-syn on their surface, favoring protein aggregation. The close contact between the protein molecules increases the local protein concentration, and the energy barrier for nucleation is overcome (38). In addition to the effect on the environment, DHA exerts a direct effect on the protein structure. We have shown that there is a specific interaction between DHA droplets and α-syn in the monomeric state. The protein undergoes a two-state structural transition, acquiring an α-helical conformation (23). Under these conditions, the amino-terminal region (the first 70 residues) is stably bound to the lipid, whereas the central region (segment 70–100) encompassing the NAC, which is able to prompt fibril formation, is transiently exposed (23). A similar finding was also obtained by NMR in the case of α-syn interacting with phospholipids, where the hydrophobic NAC region is dynamically disordered and is prone to intermolecular interactions that progress toward the formation of disease-associated oligomers and fibrils (39, 40). Under our experimental conditions, using a P/DHA of 1:10, about 65% of the free protein molecules are in equilibrium with the bound fraction (23). These bound molecules can act as an anchor, a starting nucleus, for the progressive binding of the other molecules to form fibrils. In the case of P/DHA 1:50, almost all protein molecules are bound to oil droplets, and there is a negligible fraction of free molecules. Molecules stably bound to the fatty acid and endowed with α-helical conformations are involved in stable oligomer formation.
A common aspect of the two types of aggregates induced by DHA is the presence of oxidative modifications at the level of the four methionine residues and other chemical modifications, including covalent carbonyl adducts on the protein side chain, as assessed by an immunological test using 2,4-dinitrophenylhydrazine (supplemental Fig. S6A) (41) and ESI-MS (Figs. 6, 7, and 9 and supplemental Fig. S3). We found mass differences that are consistent with the covalent addition of the earlier products of DHA peroxidation to the protein (supplemental Figs. S4 and S5) (31, 42). An important issue is to understand whether these chemical modifications are a requirement for the aggregation process. In the presence of lipids and fatty acids, these types of modifications, such as protein oxidations and aliphatic carbonyl adducts formation, have been observed both in vivo and in vitro (18, 43, 44). They are generated by radicals, hydroperoxides, and successively highly reactive aldehydes, produced by peroxidation of lipids. This phenomenon can be initiated by enzymes, but the autoxidation of DHA and other PUFAs can also be favored by light (45), traces of Fe2+ and Cu+, and molecular oxygen (31, 46). We verified that the commercial sample of DHA already contains 0.3% of fatty acids with conjugated polyenes, the primary oxidation products formed from the double-bond rearrangement of oxidized PUFA (data not shown) (37, 47). These oxidized species can initiate the peroxidation process of DHA during our analyses.
Interestingly, oxidations and covalent modifications were found on both α-syn from isolated fibrils (formed in the presence of DHA, P/fatty acid 1:10) and α-syn embedded in the oligomeric species (produced in the presence of DHA, P/fatty acid 1:50). These data indicate that these chemical modifications do not interfere with the initial mechanism that triggers the fibrillation process but strongly affect the physical-chemical properties of the aggregated species (oligomers and fibrils). A debated question on the oligomer structure regards the possibility that the aggregates formed in the presence of DHA could be covalently linked, as proposed by others (22). We have some evidence in support of this view, such as the resistance to SDS and DMSO solubilization, the stability for repetitive chromatographic steps (the protein material corresponding to a peak fraction from RP or GF can be reloaded retaining its RT and its chemical identity), and the fluorescence emission signal compatible with the presence of di-tyrosine formation(supplemental Fig. S6B) (48). However, we did not find peptides derived from trypsin digestion of oligomeric species containing intermolecular cross-linking bonds (supplemental Fig. S2 and supplemental Table S1).
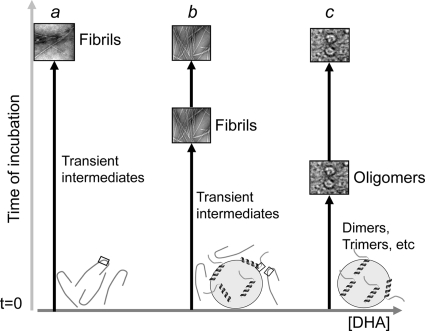
Our in vitro findings demonstrate that DHA exerts an important role in the aggregation of α-syn, recruiting protein molecules on the droplet surface and itself being part of the aggregate structures. To evaluate whether P/DHA oligomers are toxic to cells, we studied their effect on cell viability in the dopaminergic cell line SH-SY5Y, a gold standard model in PD. Cells treated with P/DHA 1:50 oligomers significantly increased the percentage of apoptotic nuclei compared with α-syn, suggesting that P/DHA species are potentially relevant in the pathogenesis of PD. The next important step will be to evaluate whether these species are associated with the pathology and/or their content is increased in post-mortem PD brains compared with controls. In support of our findings, Assayag et al. (16) have shown that only PUFA-induced oligomers, but not inclusions produced after prolonged incubation, decrease cell viability in neuronal cells. Here, we suggest that the two different pathways are possible (Fig. 11). One leads to the formation of amyloid-like fibrils. Another pathway, induced by high amount of DHA, results in the formation of stable toxic oligomers that do not proceed further to other types of structures.
FIGURE 11.
Scheme summarizing the effects of DHA on the aggregation process of α-syn. In the absence of DHA (a), α-syn, unfolded in solution, undergoes structural transition and forms amyloid-like fibrils. The NAC region, able to prompt fibril formation, is highlighted by a square. In the presence of DHA (P/DHA 1:10) (b), free α-syn molecules are in equilibrium with the bound ones. Under this condition, transient intermediates form, and these species evolve in amyloid-like fibrils, as free α-syn molecules are available. The aggregation occurs in shorter time than in the absence of the fatty acid. In the presence of DHA (P/DHA 1:50) (c), all α-syn molecules are bound to the fatty acid, acquiring an α-helical conformation, and only stable oligomerization occurs.
Supplementary Material
Acknowledgments
We thank Dr. Annarita Tedesco, Dr. Valentina Priolo, Dr. Elena Labini, and Dr. Daniela Nichino for help in the experiments.

The on-line version of this article (available at http://www.jbc.org) contains supplemental Figs. S1–S7 and Table S1.
- α-syn
- α-synuclein
- AFM
- atomic force microscopy
- DHA
- 4,7,10,13,16,19-docosahexaenoic acid (22:6n − 3)
- ESI
- electrospray ionization
- PUFA
- polyunsaturated fatty acid
- RT
- retention time
- TEM
- transmission electron microscopy
- PD
- Parkinson disease
- GF
- gel filtration
- RP-HPLC
- reverse phase-HPLC
- ThT
- thioflavin T
- NAC
- non-Aβ component
- P
- protein.
REFERENCES
- 1. Polymeropoulos M. H., Lavedan C., Leroy E., Ide S. E., Dehejia A., Dutra A., Pike B., Root H., Rubenstein J., Boyer R., Stenroos E. S., Chandrasekharappa S., Athanassiadou A., Papapetropoulos T., Johnson W. G., Lazzarini A. M., Duvoisin R. C., Di Iorio G., Golbe L. I., Nussbaum R. L. (1997) Science 276, 2045–2047 [DOI] [PubMed] [Google Scholar]
- 2. Singleton A. B., Farrer M., Johnson J., Singleton A., Hague S., Kachergus J., Hulihan M., Peuralinna T., Dutra A., Nussbaum R., Lincoln S., Crawley A., Hanson M., Maraganore D., Adler C., Cookson M. R., Muenter M., Baptista M., Miller D., Blancato J., Hardy J., Gwinn-Hardy K. (2003) Science 302, 841. [DOI] [PubMed] [Google Scholar]
- 3. Zarranz J. J., Alegre J., Gómez-Esteban J. C., Lezcano E., Ros R., Ampuero I., Vidal L., Hoenicka J., Rodriguez O., Atarés B., Llorens V., Gomez Tortosa E., del Ser T., Muñoz D. G., de Yebenes J. G. (2004) Ann. Neurol. 55, 164–173 [DOI] [PubMed] [Google Scholar]
- 4. Spillantini M. G., Crowther R. A., Jakes R., Hasegawa M., Goedert M. (1998) Proc. Natl. Acad. Sci. U.S.A. 95, 6469–6473 [DOI] [PMC free article] [PubMed] [Google Scholar]
- 5. Davidson W. S., Jonas A., Clayton D. F., George J. M. (1998) J. Biol. Chem. 273, 9443–9449 [DOI] [PubMed] [Google Scholar]
- 6. Hoyer W., Cherny D., Subramaniam V., Jovin T. M. (2004) Biochemistry 43, 16233–16242 [DOI] [PubMed] [Google Scholar]
- 7. Darios F., Ruipérez V., López I., Villanueva J., Gutierrez L. M., Davletov B. (2010) EMBO Rep. 11, 528–533 [DOI] [PMC free article] [PubMed] [Google Scholar]
- 8. Auluck P. K., Caraveo G., Lindquist S. (2010) Annu. Rev. Cell Dev. Biol. 26, 211–233 [DOI] [PubMed] [Google Scholar]
- 9. Burré J., Sharma M., Tsetsenis T., Buchman V., Etherton M. R., Südhof T. C. (2010) Science 329, 1663–1667 [DOI] [PMC free article] [PubMed] [Google Scholar]
- 10. Ruipérez V., Darios F., Davletov B. (2010) Prog. Lipid Res. 49, 420–428 [DOI] [PubMed] [Google Scholar]
- 11. Golovko M. Y., Rosenberger T. A., Faergeman N. J., Feddersen S., Cole N. B., Pribill I., Berger J., Nussbaum R. L., Murphy E. J. (2006) Biochemistry 45, 6956–6966 [DOI] [PMC free article] [PubMed] [Google Scholar]
- 12. Golovko M. Y., Rosenberger T. A., Feddersen S., Faergeman N. J., Murphy E. J. (2007) J. Neurochem. 101, 201–211 [DOI] [PubMed] [Google Scholar]
- 13. Perrin R. J., Woods W. S., Clayton D. F., George J. M. (2001) J. Biol. Chem. 276, 41958–41962 [DOI] [PubMed] [Google Scholar]
- 14. Sharon R., Goldberg M. S., Bar-Josef I., Betensky R. A., Shen J., Selkoe D. J. (2001) Proc. Natl. Acad. Sci. U.S.A. 98, 9110–9115 [DOI] [PMC free article] [PubMed] [Google Scholar]
- 15. Sharon R., Bar-Joseph I., Frosch M. P., Walsh D. M., Hamilton J. A., Selkoe D. J. (2003) Neuron 37, 583–595 [DOI] [PubMed] [Google Scholar]
- 16. Assayag K., Yakunin E., Loeb V., Selkoe D. J., Sharon R. (2007) Am. J. Pathol. 171, 2000–2011 [DOI] [PMC free article] [PubMed] [Google Scholar]
- 17. Grimsrud P. A., Xie H., Griffin T. J., Bernlohr D. A. (2008) J. Biol. Chem. 283, 21837–21841 [DOI] [PMC free article] [PubMed] [Google Scholar]
- 18. Qin Z., Hu D., Han S., Reaney S. H., Di Monte D. A., Fink A. L. (2007) J. Biol. Chem. 282, 5862–5870 [DOI] [PubMed] [Google Scholar]
- 19. Zhu M., Qin Z. J., Hu D., Munishkina L. A., Fink A. L. (2006) Biochemistry 45, 8135–8142 [DOI] [PubMed] [Google Scholar]
- 20. Uversky V. N., Yamin G., Souillac P. O., Goers J., Glaser C. B., Fink A. L. (2002) FEBS Lett. 517, 239–244 [DOI] [PubMed] [Google Scholar]
- 21. Glaser C. B., Yamin G., Uversky V. N., Fink A. L. (2005) Biochim. Biophys. Acta 1703, 157–169 [DOI] [PubMed] [Google Scholar]
- 22. Cole N. B., Murphy D. D., Lebowitz J., Di Noto L., Levine R. L., Nussbaum R. L. (2005) J. Biol. Chem. 280, 9678–9690 [DOI] [PubMed] [Google Scholar]
- 23. De Franceschi G., Frare E., Bubacco L., Mammi S., Fontana A., de Laureto P. P. (2009) J. Mol. Biol. 394, 94–107 [DOI] [PubMed] [Google Scholar]
- 24. Huang C., Ren G., Zhou H., Wang C. C. (2005) Protein Expr. Purif. 42, 173–177 [DOI] [PubMed] [Google Scholar]
- 25. LeVine H., 3rd (1999) Methods Enzymol. 309, 274–284 [DOI] [PubMed] [Google Scholar]
- 26. Gill S. C., von Hippel P. H. (1989) Anal. Biochem. 182, 319–326 [DOI] [PubMed] [Google Scholar]
- 27. Byler D. M., Susi H. (1986) Biopolymers 25, 469–487 [DOI] [PubMed] [Google Scholar]
- 28. Arrondo J. L., Muga A., Castresana J., Goñi F. M. (1993) Prog. Biophys. Mol. Biol. 59, 23–56 [DOI] [PubMed] [Google Scholar]
- 29. Wood S. J., Wypych J., Steavenson S., Louis J. C., Citron M., Biere A. L. (1999) J. Biol. Chem. 274, 19509–19512 [DOI] [PubMed] [Google Scholar]
- 30. Jahn T. R., Radford S. E. (2008) Arch. Biochem. Biophys. 469, 100–117 [DOI] [PMC free article] [PubMed] [Google Scholar]
- 31. Frankel E. N. (1980) Prog. Lipid Res. 19, 1–22 [DOI] [PubMed] [Google Scholar]
- 32. Forman M. S., Trojanowski J. Q., Lee V. M. (2004) Nat. Med. 10, 1055–1063 [DOI] [PubMed] [Google Scholar]
- 33. Dexter D. T., Wells F. R., Lees A. J., Agid F., Agid Y., Jenner P., Marsden C. D. (1989) J. Neurochem. 52, 1830–1836 [DOI] [PubMed] [Google Scholar]
- 34. Halliwell B. (1992) J. Neurochem. 59, 1609–1623 [DOI] [PubMed] [Google Scholar]
- 35. Lotharius J., Brundin P. (2002) Hum. Mol. Genet. 11, 2395–2407 [DOI] [PubMed] [Google Scholar]
- 36. Krüger R., Kuhn W., Müller T., Woitalla D., Graeber M., Kösel S., Przuntek H., Epplen J. T., Schöls L., Riess O. (1998) Nat. Genet. 18, 106–108 [DOI] [PubMed] [Google Scholar]
- 37. Namani T., Ishikawa T., Morigaki K., Walde P. (2007) Coll. Surf. B 54, 118–123 [DOI] [PubMed] [Google Scholar]
- 38. Gorbenko G. P., Kinnunen P. K. (2006) Chem. Phys. Lipids 141, 72–82 [DOI] [PubMed] [Google Scholar]
- 39. Bodner C. R., Dobson C. M., Bax A. (2009) J. Mol. Biol. 390, 775–790 [DOI] [PMC free article] [PubMed] [Google Scholar]
- 40. Bodner C. R., Maltsev A. S., Dobson C. M., Bax A. (2010) Biochemistry 49, 862–871 [DOI] [PMC free article] [PubMed] [Google Scholar]
- 41. Levine R. L., Williams J. A., Stadtman E. R., Shacter E. (1994) Methods Enzymol. 233, 346–357 [DOI] [PubMed] [Google Scholar]
- 42. Liu W., Wang H. J., Wang L. P., Liu S. L., Wang J. Y. (2007) Biochim. Biophys. Acta 1774, 258–266 [DOI] [PubMed] [Google Scholar]
- 43. Liu X., Yamada N., Maruyama W., Osawa T. (2008) J. Biol. Chem. 283, 34887–34895 [DOI] [PMC free article] [PubMed] [Google Scholar]
- 44. Liu W., Wang J. Y. (2008) Curr. Proteomics 5, 62–72 [Google Scholar]
- 45. Trostchansky A., Rubbo H. (2007) Amino Acids 32, 517–522 [DOI] [PubMed] [Google Scholar]
- 46. Shibamoto T. (2006) J. Pharm. Biomed. Anal. 41, 12–25 [DOI] [PubMed] [Google Scholar]
- 47. Frankel E. N. (ed) (2005) Lipid Oxidation, 2nd Ed., The Oily Press, Bridgewater, UK [Google Scholar]
- 48. Kim K. S., Kang J. H. (2005) Bull. Korean Chem. Soc. 26, 1255–1259 [Google Scholar]
- 49. Uéda K., Fukushima H., Masliah E., Xia Y., Iwai A., Yoshimoto M., Otero D. A., Kondo J., Ihara Y., Saitoh T. (1993) Proc. Natl. Acad. Sci. U.S.A. 90, 11282–11286 [DOI] [PMC free article] [PubMed] [Google Scholar]
Associated Data
This section collects any data citations, data availability statements, or supplementary materials included in this article.


