

Abstract
Human chymotrypsin C (CTRC) is a pancreatic protease that participates in the regulation of intestinal digestive enzyme activity. Other chymotrypsins and elastases are inactive on the regulatory sites cleaved by CTRC, suggesting that CTRC recognizes unique sequence patterns. To characterize the molecular determinants underlying CTRC specificity, we selected high affinity substrate-like small protein inhibitors against CTRC from a phage library displaying variants of SGPI-2, a natural chymotrypsin inhibitor from Schistocerca gregaria. On the basis of the sequence pattern selected, we designed eight inhibitor variants in which amino acid residues in the reactive loop at P1 (Met or Leu), P2′ (Leu or Asp), and P4′ (Glu, Asp, or Ala) were varied. Binding experiments with CTRC revealed that (i) inhibitors with Leu at P1 bind 10-fold stronger than those with P1 Met; (ii) Asp at P2′ (versus Leu) decreases affinity but increases selectivity, and (iii) Glu or Asp at P4′ (versus Ala) increase affinity 10-fold. The highest affinity SGPI-2 variant (KD 20 pm) bound to CTRC 575-fold tighter than the parent molecule. The most selective inhibitor variant exhibited a KD of 110 pm and a selectivity ranging from 225- to 112,664-fold against other human chymotrypsins and elastases. Homology modeling and mutagenesis identified a cluster of basic amino acid residues (Lys51, Arg56, and Arg80) on the surface of human CTRC that interact with the P4′ acidic residue of the inhibitor. The acidic preference of CTRC at P4′ is unique among pancreatic proteases and might contribute to the high specificity of CTRC-mediated digestive enzyme regulation.
Keywords: Pancreas, Protease, Protease Inhibitor, Proteolytic Enzymes, Serine Protease, Canonical Inhibitor, Chymotrypsin, Directed Evolution, Elastase, Pacifastin
Introduction
Digestion of dietary proteins in the small intestine is catalyzed by proteases secreted from the pancreas. These proteases are produced as inactive proenzymes (zymogens) and their activation is spatially restricted to the duodenum and proceeds in a cascade-like manner. The membrane-localized serine protease enteropeptidase (enterokinase) activates trypsinogens to active trypsins, which, in turn, activate all other proteolytic proenzymes; in the human these include chymotrypsinogens B1, B2, C, and L1, proelastases 2A, 3A, and 3B, and procarboxypeptidases A1, A2, and B1. This classic textbook paradigm of digestive enzyme activation has been recently revised by the discovery of interactions between digestive proteases that can modulate the ultimate levels of active enzymes. In this regard, we demonstrated that human chymotrypsin C (CTRC)4 regulates activation and degradation of human cationic trypsinogen and trypsin (1, 2). CTRC facilitates trypsin-mediated activation (autoactivation) of cationic trypsinogen by processing the trypsinogen activation peptide, at the Phe18–Asp19 peptide bond, to a shorter form that is more readily cleaved by trypsin (1). Mutation A16V in the trypsinogen activation peptide stimulates CTRC-mediated processing and subjects with this mutation are at increased risk of developing chronic pancreatitis (1, 3). CTRC can also promote degradation of human cationic trypsinogen and trypsin by cleaving the conserved Leu81–Glu82 peptide bond in the calcium binding loop, when the calcium concentration is low and the binding loop is unoccupied (2). The combination of this cleavage and an autolytic cleavage at Arg122 results in the degradation and complete inactivation of cationic trypsin. Hereditary pancreatitis-associated mutation R122H eliminates the Arg122 autolysis site in cationic trypsin(ogen) and prevents CTRC-induced degradation, suggesting that trypsin(ogen) degradation is an important defensive mechanism in the pancreas (2, 4). Consistent with this notion, genetic association studies identified loss-of-function mutations in CTRC as risk factors for chronic pancreatitis (5, 6).
More recently, we found that human CTRC is a physiological co-activator of human procarboxypeptidases A1 and A2 (pro-CPA1 and pro-CPA2) (7). Digestive carboxypeptidases are secreted by the pancreas as inactive proenzymes containing a 94–96-amino acid long propeptide that acts as a strong inhibitor of the enzymes thereby maintaining their zymogen state. Activation of procarboxypeptidases is initiated by trypsin-mediated proteolytic cleavages at the C-terminal end of the propeptides. However, the trypsin-processed propeptides are still inhibitory and subsequent cleavages by CTRC are required for full activation of pro-CPA1 and pro-CPA2. CTRC cleaves the propeptides at multiple sites, but the critical step for activation appears to be cleavage of the conserved Leu96–Leu97 peptide bond in both proenzymes (7).
The CTRC-catalyzed regulatory functions are highly specific as other human pancreatic chymotrypsins and elastases exhibit no such activity (1, 2, 7). This may be partly due to the primary (P1) specificity of CTRC, which is chymotrypsin-like, but CTRC exhibits higher activity on leucyl peptide bonds than chymotrypsin A or B (8–10). However, other determinants may be also important, as suggested by the preponderance of acidic amino acid residues on the prime side of the CTRC-specific regulatory cleavage sites (Table 1). Despite the similarities in these sequences, the number of CTRC-specific cleavage sites identified hitherto is too few to determine the inherent binding site preference of CTRC. Functional importance of individual amino acid residues within a linear binding epitope of substrates can be assessed through mutational replacements, but a complete analysis would require an impractically large number of mutants. If recognition relies on cooperating substrate positions, the combination of mutants required for full coverage of all possible sequence variations would reach astronomical numbers. Directed evolution combines combinatorial mutagenesis with functional selection and provides a straightforward solution to these problems (11). Substrate-like canonical inhibitors mimic natural peptide substrates in their interactions with proteases (12, 13). In the present study we utilized phage display, possibly the most robust directed evolution approach, to define the substrate specificity of human CTRC. We fully randomized six protease binding loop positions in the chymotrypsin inhibitor SGPI-2, displayed the library on M13 phage, and selected tight binding variants against CTRC. Based on the selected sequence pattern, eight SGPI-2 variants designated C1 through C8 were produced and characterized. The results suggest that a unique electrostatic interaction between a cluster of basic residues on CTRC and the P4′ acidic amino acid residue of CTRC substrates is an important determinant of CTRC specificity.
TABLE 1.
Sequence context of CTRC-specific regulatory cleavage sites in human cationic trypsinogen and procarboxypeptidases A1 and A2
| CTRC target proenzymes | CTRC cleavage sites |
|---|---|
| P3 P2 P1 P1′ P2′ P3′ P4′ | |
| Cationic trypsinogen activation peptide | Ala16-Pro17-Phe18-Asp19-Asp20-Asp21-Asp22- |
| Cationic trypsinogen calcium binding loop | -Glu79-Val80-Leu81-Glu82-Gly83-Asn84-Glu85- |
| Procarboxypeptidase A1 propeptide | -Gln94-Ser95-Leu96-Leu97-Asp98-Glu99-Glu100- |
| Procarboxypeptidase A2 propeptide | -Gln94-Val95-Leu96-Leu97-Asp98-Lys99-Glu100- |
EXPERIMENTAL PROCEDURES
Nomenclature
Amino acid residues in human pancreatic proteases were numbered starting with the initiator methionine of the primary translation product; according to the recommendations of the Human Genome Variation Society. Where indicated, the traditional crystallographic numbering system based on the bovine chymotrypsin A sequence was used. Amino acids in SGPI-2 were numbered starting from the first residue in the mature inhibitor (Glu1).
SGPI Library Construction
Library construction was based on the Tag-wtSGPI-2-pGP8 phagemid vector (14), which monovalently displays SGPI-2 on the p8 coat protein of the M13 phage. The library was produced in two successive Kunkel mutagenesis (15) steps to avoid wild-type SGPI-2 contamination. First, the Tag-SGPI-2-pGP8-STOP vector was constructed in which all codons to be randomized were replaced with stop codons using the following primer (where the stop codons are underlined): 5′-GC GGT AGC GAT GGC AAA AGC GCG TAA TGC TAA TAA TAA TAA TGC TAA CAG GGT ACC GGT GGA GG-3′. In the second step, the resulting Tag-wtSGPI-2-pGP8-STOP vector was used as template in a combinatorial Kunkel mutagenesis step modified slightly for large scale generation of diverse libraries (16). Stop codons were replaced with amino acid coding codons randomized using NNK degeneracy, where N denotes nucleotides A, C, G, or T, and K stands for G or T. NNK codons represent a set of 32 codons covering all 20 amino acid residues. The following mutagenesis primer was used (where NNK codons are underlined): 5′-GC GGT AGC GAT GGC AAA AGC GCG NNK TGC NNK NNK NNK NNK TGC NNK CAG GGT ACC GGT GGA GG-3′. The Tag-SGPI-2-pGP8-Lib library construct is illustrated under supplemental Fig. S1. The phagemid library was electroporated into Escherichia coli SS320 cells to generate phage libraries as described (16).
Selection of Inhibitor Phages on CTRC
Human CTRC was immobilized in 12 wells of an Immobilizer Amino plate (Nunc International) using 5 μg of CTRC/well in 100 μl of 10 mm Hepes buffer (pH 7.8) containing 0.15 m NaCl, for 3 h. The wells were rinsed with phosphate-buffered saline (PBS, pH 7.2) and blocked with 200 μl of bovine serum albumin (BSA, 5 mg/ml dissolved in PBS) for 1 h. A control plate was treated with BSA only without adding CTRC. The wells were rinsed four times with PBS containing 0.05% Tween 20 (final concentration). Phages (100 μl, ∼5 × 10¹¹ phage particles per well) were added to the wells in PBS/BSA solution containing 0.05% Tween 20 and incubated for 2 h. Plates were rinsed 12 times with PBS containing 0.05% Tween 20 and bound phages were eluted at pH 1.0 with 100 mm HCl (100 μl/well) for 1 min. The eluted phage solution was neutralized by adding 15% volume of 1 m Tris base solution and phages were amplified in E. coli XL1-Blue. Three selection and amplification cycles were performed as described (16). After the second and third cycles, the inhibitor-phage titers eluted from target and control plates were determined and enrichment values were calculated to characterize the efficiency of the selection process. The enrichment was 40- and 900-fold after the second and third cycles, respectively.
Phage ELISA of Selected Library Members
Individual clones from the third selection cycle were tested in phage ELISA performed as described (16). Clones producing ELISA signals 3-fold higher on CTRC containing plates than on albumin-coated control plates were selected for DNA sequencing.
Sequence Analysis
DNA sequences coding for SGPI-2 variants were PCR amplified from the selected library members with the following primers annealing to invariant vector sequences; forward primer, pTacUp35T7, 5′-CGA AAT TAA TAC GAC TCA CTA TAG GGC TAT AGG GTC TGG ATA ATG TTT TTT GCG CC-3′ and reverse primer, pVIII-rev, 5′-GTT ATG CTA GTT ATT GCT CAG CGG CTT GCT TTC GAG GTG AAT TTC-3′. The forward PCR primer was designed to contain the sequence of the T7 promoter sequencing primer: 5′-CGA AAT TAA TAC GAC TCA CTA TAG GG-3′, which was then used for the sequencing reactions. Clones with unique DNA sequences were aligned and amino acid frequencies at the randomized positions were determined. These frequencies were normalized to the expected codon frequencies in the NNK degenerated set, to eliminate the effects of codon bias. For logo representation of the normalized results an input sequence dataset containing 100 sequences was generated representing the normalized amino acid frequencies at each randomized position. Sequence logos were generated by the web-based application WebLogo (17).
Expression and Purification of SGPI-2 Variants
Recombinant SGPI-2 variants were expressed into the periplasm of E. coli as maltose binding protein fusions (18). PCR amplified genes of SGPI-2 variants were subcloned into the pMal-p2G vector (New England Biolabs) using EcoRI and HindIII restriction sites. The following universal 5′ primer was used, which contained an EcoRI site (underlined), a TEV protease cleavage site coding segment (bold), a Ser-Gly-Ser linker coding segment (italic), and the first six codons of the SGPI-2 gene (italic and underlined): 5′-A CTG GAA TTC GAA AAC CTG TAT TTT CAG GGA TCC GGC GAG GTG ACC TGC GAA CCG-3′. Each 3′ primer contained a variant-specific segment and a common segment with two consecutive stop codons and a HindIII restriction site. The expression plasmid is illustrated under supplemental Fig. S1. E. coli BL21 StarTM (Invitrogen) cells transformed with the appropriate expression vector were grown in 1 liter of LB/ampicillin medium at 37 °C until the optical density of the culture measured at 600 nm reached 0.5 and expression was induced overnight with 0.3 mm isopropyl 1-thio-β-d-galactopyranoside (final concentration). Cells were harvested by centrifugation (10 min, 6,000 × g at 4 °C), resuspended in 80 ml of ice-cold 1 mm MgCl2 solution, and kept frozen at −20 °C overnight. The next morning the suspension was thawed and cells were removed by centrifugation (10 min, 15,000 × g at 4 °C). The supernatant containing the periplasmic fraction was treated with 20 units/ml of BenzonaseTM (Novagen) overnight at room temperature to eliminate nucleic acid contamination. Ammonium sulfate was added to 90% saturation and precipitated proteins were recovered by centrifugation (10 min, 15,000 × g at 4 °C). Proteins were suspended in 70 ml of 2.5 mm HCl and dialyzed against the same solution twice for 2 h each. Precipitated proteins were removed by centrifugation (10 min, 15,000 × g at 4 °C). The pH of the supernatant was adjusted to 8.0 by adding Tris-HCl buffer to a 50 mm final concentration and the maltose binding protein-SGPI-2 fusion was purified on a 5-ml HiTrap Q HP (GE Healthcare Life Sciences) ion-exchange column using the same buffer and a linear 0–0.5 m NaCl gradient on a GE Healthcare FPLC system. The fusion protein eluted at 0.25 m NaCl concentration. Two or three peak fractions (1 ml each) were pooled; and AcTEVTM protease (10,000 units/ml containing 5 mm DTT; Invitrogen) was added to attain a 100 units/ml protease concentration and 50 μm final DTT concentration. The sample was incubated overnight at room temperature and completeness of the cleavage reaction was verified by SDS-PAGE and Coomassie Blue staining. The sample was then loaded on a column containing immobilized amylose (New England Biolabs) to capture the released maltose binding protein tag. The flow-through containing the SGPI-2 variant was filtered through a 22-μm membrane and loaded onto a Jupiter C4 300A (250 × 10 mm) RP HPLC column (Phenomenex). Solvent A was 0.1% trifluoroacetic acid (TFA) and solvent B was acetonitrile with 0.08% TFA. SGPI-2 variants eluted as symmetrical peaks and were found to be homogeneous and of correct size by mass spectrometry on an HP1100 HPLC-ESI-MS system (Agilent Technologies). Purified SGPI-2 variants were lyophilized and dissolved in 10 mm Tris-HCl (pH 8.0) before use.
Expression and Purification of Human Pancreatic Proteases
Human cationic trypsin (PRSS1), human anionic trypsin (PRSS2), chymotrypsins CTRB1, CTRB2, CTRC, CTRL1, and elastases ELA2A, ELA3A, and ELA3B were expressed as inactive precursors (zymogens) either in E. coli BL21(DE3) or in HEK 293T cells and purified as previously described (Ref. 7 and references therein). CTRB1, CTRB2, CTRC, CTRL1, and ELA3B zymogens were activated with immobilized bovine trypsin (Pierce; Thermo Fisher Scientific, Rockford, IL) and the trypsin-containing beads were removed by centrifugation. ELA3A and ELA2A precursors were activated with human cationic trypsin and anionic trypsin, respectively, and trypsin was removed by passing the activation mixtures through a ∼1-ml benzamidine column (GE Healthcare). Active proteases were stored in 0.1 m Tris-HCl (pH 8.0) and 0.05% Tween 20 (final concentrations) at 4 °C. Protease concentrations were verified before each experiment either by active site titration or activity assay.
Concentration Determinations
Bovine trypsin (Worthington Biochemicals) was dissolved in 0.1 m Tris-HCl (pH 8.0), 1 mm CaCl2 at a concentratin of ∼50 μm and active site-titrated using p-nitrophenyl p′-guanidinobenzoate, as described (19). The pan-protease inhibitor ecotin (20, 21) was overexpressed in E. coli BL21(DE3) and purified from the periplasm as described previously (22). The concentration of ecotin was determined by titration against the active site-titrated bovine trypsin. This ecotin batch served then as a universal titrant for all human pancreatic proteases studied. We have determined the equilibrium dissociation constants (KD) of ecotin with human pancreatic proteases (supplemental Table S1) and titrations were performed using protease concentrations at least 2 orders of magnitude above the KD values, with the exception of ELA3A, which was titrated at a concentration ∼5 times above KD. The concentration of SGPI-2 and its variants was determined by titration against CTRC. Immediately before the binding experiments, all tight-binding protease-inhibitor pairs were re-titrated against each other to ensure “self-consistent” concentrations.
Equilibrium Binding Assays
Binding of SGPI-2 variants to human chymotrypsins and elastases was characterized by determining the KD value of the reaction in equilibrium, according to the method of the Laskowski laboratory (23). A fixed protease concentration (between 0.5 and 10 nm) was reacted with increasing concentrations of the inhibitor, and the free (unbound) protease concentration was determined by enzymatic assays using appropriate fluorogenic or chromogenic peptide substrates (listed in supplemental Table S2). Inhibitors and proteases were incubated in 0.1 m Tris-HCl (pH 8.0), 1 mm CaCl2, and 0.05% Tween 20 (final concentrations) for 1 h at 22 °C in microtiter plates in a 100-μl final volume and substrates were given in a 5-μl volume so as not to perturb the equilibrium. The free protease concentration was plotted as a function of the total inhibitor concentration and the experimental points were fitted with the following equation: y = E − (E + x + K-sqrt((E + x + K)2 − 4Ex))/2, where the independent variable x represents the total inhibitor concentration, the dependent variable y is the free protease concentration in equilibrium, K is KD, and E designates the total protease concentration.
Structural Modeling of the CTRC-C6 Complex
Several homology models of human CTRC were constructed using the SWISS-MODEL Workspace (24) using porcine elastase bound to Ascaris chymotrypsin/elastase inhibitor (PDB code 1EAI chain A; 52% identity) (25), bovine chymotrypsin bound to pacifastin inhibitor PMP-C (PDB code 1GL1 chain A, 36% identity) (26), and bovine chymotrypsinogen C (PDB code 1PYT chain D; 80% identity) (27) as templates. Because substantial conformational changes throughout the substrate binding cleft take place upon serine protease activation, we chose the model based on porcine elastase as the best approximation of the active CTRC structure. The three homology models were quite similar overall but differed considerably over a 5-residue loop (residues 238–242 in the human CTRC sequence) that in the elastase-based model clashed with the anticipated orientation of the C6 inhibitor; these residues were replaced with the corresponding residues from the homology model based on bovine chymotrypsinogen C. A homology model of the C6 inhibitor was constructed in the SWISS-MODEL Workspace using as a template PMP-C (PDB code 1GL1 chain I; 76% identity) (26). The homology models of human CTRC and inhibitor C6 were first docked manually based on the orientation of PMP-C and chymotrypsin in PDB code 1GL1, and then a local docking search with energy minimization of side chain rotamers at the intermolecular interface was performed using the RosettaDock server (28).
RESULTS
Analysis of CTRC Specificity through Phage Display Selection of Substrate-like SGPI-2 Inhibitor Variants
To identify determinants of CTRC substrate specificity, we utilized a phage display approach, in which a library of inhibitor variants was constructed and phages carrying tight-binding inhibitors were selected. We used SGPI-2, a chymotrypsin inhibitor from the desert locust Schistocerca gregaria as our scaffold for inhibitor selection (Fig. 1A) (29–32). The 35-amino acid SGPI-2, which belongs to the pacifastin inhibitor family, had already been efficiently displayed on the surface of M13 phage (14). Wild-type SGPI-2 inhibited human chymotrypsins and elastases with KD values ranging from 0.2 nm to 2 μm, and generally stronger inhibition was apparent for chymotrypsins (Table 2). To display SGPI-2 on the surface of the M13 phage, it was fused to the N terminus of the p8 coat protein. Six positions in the reactive loop of SGPI-2 were fully randomized, which included P4, P2, P1, P1′, P2′, and P4′ (Fig. 1A, supplemental Fig. S1A). The P3 and P3′ Cys residues are structurally indispensable and these were therefore conserved. Selection of tight-binding clones was performed against immobilized human CTRC. Three selection cycles were performed and tight binding inhibitor containing phages were verified by ELISA and subjected to DNA sequencing.
FIGURE 1.

Phage display-selected S. gregaria chymotrypsin inhibitor (SGPI-2) variants. A, primary structure of wild-type SGPI-2. The amino acid positions within the reactive loop that were randomized in the phage display library are highlighted as white letters on a black background. The disulfide bonds are indicated. B, sequence logo representation of the reactive loop of phage-selected CTRC inhibitors. The logo was generated with the WebLogo program. The overall height of the stack of symbols indicates the sequence conservation at that position, whereas the height of symbols within the stack indicates the relative frequency of each amino acid. The colors indicate the chemical properties of the amino acid side chains; aliphatic is green, aromatic is orange, acidic is red, basic is dark blue, and polar with no charge is light blue. Note that the Cys residues shown in gray at the P3 and P3′ positions were not randomized. Their symbol height represents the maximal height corresponding to a completely conserved residue. C, reactive loop sequences of eight SGPI-2 variants designed to test the significance of the P1 (Met or Leu), P2′ (Leu or Asp), and P4′ (Glu, Asp, or Ala) positions in binding affinity. The corresponding P4-P4′ segment in wild-type SGPI-2 is indicated in panel A. These eight inhibitors as well as wild-type SGPI-2 were expressed, purified, and their inhibitory activity was tested on human pancreatic chymotrypsins and elastases. See text for further details.
TABLE 2.
Inhibition of human pancreatic chymotrypsins and elastases by S. gregaria chymotrypsin inhibitor (SGPI-2) and phage display-selected SGPI-2 variants
Equilibrium dissociation constants (KD) shown in bold were determined as described under “Experimental Procedures” and expressed in nanomolar units of concentration. To quantify the selectivity of the inhibitors, KD values were normalized to the CTRC KD, which was set to equal one. These selectivity values are shown in italics below their corresponding KD. Values above one were rounded to the nearest whole number. See Fig. 1 for the primary structure of the inhibitors used.

Selected Tight Binding SGPI-2 Variants Reveal Unexpected Acidic Residues at P4′ Position of the Reactive Loop
From the sequence analysis of 32 inhibitor phage clones, 22 were unique at the DNA level, indicating that these were the results of independent selection events. The reactive loop sequence of the individual clones is listed under supplemental Table S3. To define the characteristic sequence pattern for CTRC inhibition, we created a codon-normalized sequence logo from the individual sequences, in which symbol height was used to represent sequence conservation at positions P4 through P4′ (Fig. 1B). The normalized sequence pattern indicated selection of Met and Leu amino acid residues at the P1 position, which corresponded to the expected P1 specificity of CTRC. The P2 position showed a strong consensus for Thr; however, this most likely reflects stabilizing interactions between the reactive loop and the inhibitor core (see “Discussion”). A slight predominance of Ala and Gly were detected at the P4 position, which showed the lowest degree of sequence conservation of all positions randomized. On the prime side of the reactive loop, both the P1′ and P2′ positions showed a clear preference for hydrophobic side chains, Met and Leu, respectively. Interestingly, acidic amino acid residues Asp and Glu were also selected at the P2′ position, although with a lower frequency than Leu. Finally, the most striking feature of the sequence logo was the almost exclusive presence of acidic Glu and Asp amino acid residues at position P4′. Taken together, the phage display results suggest that the sequence pattern of the reactive loop of SGPI-2 variants that most likely bind to CTRC with high affinity is Xaa-Cys-Thr-Met/Leu-Met-Leu-Cys-Glu/Asp.
Phage Display-evolved CTRC Inhibitors Exhibit Improved Binding Affinity Relative to Parent SGPI-2
On the basis of the reactive loop sequence pattern derived from tight binding inhibitor-phage clones, we have designed six SGPI-2 inhibitor variants, in which positions P1 (Met or Leu), P2′ (Leu or Asp), and P4′ (Glu or Asp) were varied, whereas positions P4 (Ala), P2 (Thr), and P1′ (Met) were fixed (see Fig. 1C). In addition, to test the contribution of the P4′ acidic side chain to binding affinity, we designed two inhibitors with P4′ Ala (Fig. 1C). The eight inhibitors were expressed in E. coli, purified to homogeneity, and their binding to CTRC was characterized by determining the equilibrium dissociation constants (KD). Representative binding experiments are shown in Fig. 2A and the KD values for CTRC are demonstrated by Fig. 2B. KD values for the eight inhibitors were also measured with the full complement of human pancreatic chymotrypsins and elastases (Table 2). To better illustrate the selectivity of the inhibitors, KD values were also expressed after normalization to the CTRC KD, which was set to equal one (Table 2). Full characterization of wild-type SGPI-2 and phage display-selected variants required 88 independent KD determinations in the present work.
FIGURE 2.

Inhibition of human CTRC by phage display-selected SGPI-2 variants. A, representative inhibitor-binding experiments with the C4 and C6 SGPI-2 variants using 0.5 nm CTRC concentration. B, equilibrium dissociation constant (KD) values determined for eight CTRC-specific inhibitors. Measurements were carried out as described under “Experimental Procedures.”
As expected, compared with the inhibition of CTRC by the parent molecule SGPI-2 (KD 11.5 nm, see Table 2), all eight SGPI-2 variants exhibited significantly higher binding affinities, with KD values ranging from 0.02 to 0.9 nm, which corresponded to 13- to 575-fold improvement. Interestingly, relative to inhibition by the parent molecule SGPI-2, chymotrypsins CTRB1, CTRB2, and CTRL1 were inhibited by the CTRC-selected inhibitors less strongly, whereas inhibition of elastases ELA2A, ELA3A, and ELA3B showed a tendency for improvement. With respect to binding affinity, the best CTRC inhibitor was C4 (KD 20 pm), which also exhibited good selectivity (range 46–12,650-fold) against other pancreatic chymotrypsins and elastases. With respect to selectivity, the best inhibitor was C6, with a KD value of 110 pm and a selectivity that ranged from 225- to 112,664-fold (Table 2).
Leu at P1 Affords Tighter Binding Than Met
According to the sequence logo, Met or Leu at P1 should result in comparable inhibition of CTRC. Surprisingly, however, when purified inhibitors with P1 Leu or Met were compared, inhibitors with Leu consistently showed stronger inhibition of CTRC by about an order of magnitude (average 12-fold; range 8–16-fold) (cf. C1 with C4, C2 with C5, and C3 with C6, in Figs. 2B and 3 and Table 2). CTRB2 exhibited a similarly strong P1 preference for Leu and the same general trend was apparent for other chymotrypsins and elastases, although the magnitude of the difference between inhibition by Leu and Met P1 was typically smaller than seen with CTRC (Fig. 3, Table 2). Consequently, relative to Met, the Leu P1 not only increased affinity for CTRC but also increased the selectivity of the CTRC inhibitors against other chymotrypsins and elastases by an average of 4-fold (range 1–12-fold) (Table 2). Interestingly, the presence of Asp (versus Leu) at the P2′ position mitigated the Leu P1 preference of CTRC and CTRB2 by 2- and 5-fold, respectively (cf. Fig. 3, C with A and B).
FIGURE 3.

The effect of the P1 residue (Leu or Met) on the inhibition of human pancreatic chymotrypsins and elastases by phage display-selected SGPI-2 variants. Pairwise comparison of relative KD values (P1 Leu set to equal one) is shown for inhibitor pairs differing only at the P1 position. The amino acid residues found at P2′ and P4′ are also indicated.
Acidic Amino Acid Residues at P4′ Markedly Increase Inhibitor Affinity to CTRC
The essentially exclusive selection of Glu and Asp residues at the P4′ position in tight binding inhibitor-phage clones suggested that acidic residues are important determinants of inhibitor and substrate binding to CTRC. In agreement with these expectations, the equilibrium binding experiments demonstrated that CTRC binds inhibitors with P4′ Glu about an order of magnitude stronger (average 13-fold, range 8–18-fold) than inhibitors with P4′ Ala (cf. C4 with C7 and C6 with C8 in Fig. 4 and Table 2). In contrast, other chymotrypsins generally bound inhibitors with P4′ Glu more weakly than those with P4′ Ala, whereas in the case of elastases the Glu versus Ala exchange at P4′ had no effect on inhibitor binding (Fig. 4). Binding affinities of inhibitors with P4′ Glu or Asp were comparable (cf. inhibitors C1 with C2 and C4 with C5 in Table 2), although inhibitors with P4′ Asp showed a tendency toward slightly weaker binding, but the difference was within experimental error. Interestingly, the P2′ position had a small, but measurable influence on the effect of the P4′ position on chymotrypsins (cf. C4 with C6 and C7 with C8 in Fig. 4). The P2′ Asp (versus Leu) reduced the affinity increasing effect of the P4′ Glu (versus Ala) toward CTRC by about 2-fold, whereas it enhanced the unfavorable effect of the P4′ Glu on binding affinity toward CTRB1 and CTRB2 by about 3-fold.
FIGURE 4.

The effect of the P4′ residue (Glu or Ala) on the inhibition of human pancreatic chymotrypsins and elastases by SGPI-2 variants. Pairwise comparison of relative KD values (P4′ Glu set to equal one) is shown for inhibitor pairs differing only at the P4′ position. The amino acid residues found at P1 and P2′ are also indicated.
Because the positive effect of the P4′ Glu/Asp on inhibitor binding is highly specific for CTRC, this residue is also the most important determinant of inhibitor selectivity against other pancreatic chymotrypsins and elastases. CTRC inhibitors with P4′ Glu (versus Ala) are on average 10-fold (range 6–13-fold) more selective against elastases and on average 55-fold (range 12–100-fold) more selective against other chymotrypsins (cf. C4 with C7 and C6 with C8 in Table 2).
The P2′ Asp Decreases Binding Affinity but Increases Selectivity of SGPI-2 Variants
The phage-selected sequence pattern suggests that the optimal residue at P2′ for CTRC binding is Leu. However, contrary to our expectations, acidic residues (Asp or Glu) were also selected at this position. This observation suggested that acidic residues at P2′ offer a non-homologous alternative solution for binding to the S2′ site of CTRC without significant loss of affinity. Binding experiments with purified inhibitors confirmed that, relative to a P2′ Leu, the presence of P2′ Asp caused only an average of 3.6-fold (range 2.5–5.5-fold) decrease in binding affinity toward CTRC (cf. C1 with C3, C4 with C6 and C7 with C8 in Fig. 5 and Table 2). Binding to CTRB1 and CTRB2 was similarly affected. In contrast, the P2′ Asp caused a much more significant (on average ∼25-fold, range 5–49-fold) decrease in the inhibition of elastases and CTRL1 (Fig. 5). Because of this difference, the P2′ Asp appreciably (on average ∼7-fold, range 2–17-fold) increased the selectivity of the CTRC inhibitors against elastases and CTRL1 (Table 2).
FIGURE 5.

The effect of the P2′ residue (Leu or Asp) on the inhibition of human pancreatic chymotrypsins and elastases by phage display-selected SGPI-2 variants. Pairwise comparison of relative KD values (P2′ Leu set to equal one) is shown for inhibitor pairs differing only at the P2′ position. The amino acid residues found at P1 and P4′ are also indicated.
Modeling Suggests That a Cluster of Positively Charged CTRC Residues Interact with the Acidic P4′ Residue of the Inhibitor
The most intriguing finding from the phage display selection was the preference of CTRC for acidic residues at the P4′ position; this preference is unique among pancreatic proteases. To gain insight into potential structural determinants of this aspect of CTRC specificity, we generated homology models of CTRC (modeled on porcine elastase and bovine CTRC zymogen) and the C6 inhibitor (modeled on PMP-C, a homologous inhibitor from Locusta migratoria). We docked the CTRC-C6 model complex using a local docking search with energy minimization of side chain rotamers at the intermolecular interface. The resultant C6 inhibitor orientation and placement of residues occupying the P4-P4′ positions closely mimic those observed in the crystal structure of the complex formed by bovine chymotrypsin with PMP-C (PDB code 1GL1) (26), lending support to the validity of our model. In examining the environment surrounding the P4′ Glu residue in the model, we observed a cluster of basic residues that apparently interact with and stabilize the negative charge borne by this residue (Fig. 6). In the model, the side chain carboxylate oxygens of the P4′ Glu form salt bridges with Lys51 and Arg80, with distances of about 2.6 and 3.4 Å, respectively, and the backbone carbonyl oxygen of the P4′ Glu accepts an H-bond from nearby Arg56. We hypothesize that these interactions contribute to the preference of CTRC for acidic residues at the P4′ position.
FIGURE 6.

Structural modeling predicts specificity determinants. A, overview of homology model of the CTRC-C6 complex. CTRC is surface rendered in gray, with a cluster of three basic residues surrounding the P4′ binding site highlighted in blue (nitrogens) and yellow (carbons); the inhibitor is shown in orange. B, enlarged view of the P4′ binding site, showing interactions of Lys51, Arg56, and Arg80 with the P4′ Glu residue of the C6 inhibitor.
Beyond the P4′ position, we examined the CTRC-C6 model for insights into binding specificity at additional prime side subsites of CTRC, which differ from those of typical chymotrypsins and elastases. At the P1′ position, mammalian chymotrypsins typically show a preference for basic residues Arg and Lys, which has been attributed to interactions with conserved acidic residues Asp35 and Asp64 (chymotrypsin numbering) (33). In human CTRC, each of these Asp residues is substituted with the bulkier, uncharged Tyr, potentially explaining a preference for the shorter, hydrophobic side chain of Met at the P1′ position. At the P2′ position, human CTRC proved to be unexpectedly permissive of acidic side chains Asp and Glu; this may be due to the positioning of the bound P2′ residue between the basic side chains of Arg56 (distance ∼5 Å) and Arg162 (distance ∼6 Å). Although these distances may not suggest particularly close ion pair contacts, it has been well documented that electrostatic interactions in the range of 4–7 Å can contribute substantially to the energetics of protein-protein association, depending upon the local environment (34).
Mutational Analysis of CTRC Residues Lys51, Arg56, and Arg80 Supports Their Interaction with the Acidic P4′ Residue of the Inhibitor
To test the predictions of our CTRC model with respect to the binding of the P4′ Glu amino acid residue of inhibitors, we mutated Lys51 and Arg56 to Ala, individually (single mutants K51A and R56A) and in combination (double mutant K51A,R56A). We also mutated Arg80 to Leu (mutant R80L). Leu was used at this position because in most mammalian CTRC molecules Arg80 is not conserved and Leu is found in its place. Finally, to test the effect of an unfavorable negative charge within this basic amino acid cluster, Arg56 was changed to Glu (mutant R56E). The CTRC mutants were expressed and purified and kinetic parameters were determined on the peptide substrate Suc-Ala-Ala-Pro-Phe-p-nitroanilide. As shown under supplemental Table S4, the kcat, Km, and kcat/Km values for the six mutants were comparable with those of wild-type CTRC, indicating that the mutations did not perturb the catalytic machinery of CTRC to a significant extent. Binding of the wild-type SGPI-2 inhibitor by the CTRC mutants was slightly improved (single mutants K51A and R56A and double mutant K51A,R56A) or unchanged (mutant R56E), with the exception of the R80L mutant, which bound SGPI-2 almost 10-fold stronger than wild-type CTRC (supplemental Table S5). This latter effect is probably due to the elimination of a repulsive interaction between Arg80 on CTRC and the P1′ Lys residue in SGPI-2 (not shown).
To determine whether the three mutated basic residues contribute to binding the P4′ Glu of CTRC inhibitors, we compared binding of two inhibitor pairs (C4–C7 and C6–C8) differing only in the P4′ position (Glu versus Ala). Table 3 lists the KD values measured. The single neutral mutations (K51A, R56A, and R80L) in CTRC decreased binding affinity to inhibitors with P4′ Glu by an average of 6-fold (range 4–9-fold), and this effect was additive in the double mutant K51A,R56A, which caused an average 31-fold (range 21–40-fold) decrease. Binding of these CTRC mutants to inhibitors carrying a P4′ Ala was only slightly weakened (on average 1.7-fold, range 0.4–4-fold), and in some cases the mutations actually improved affinity (R80L with C7 and C8, and K51A,R56A with C7, see Table 3). Similarly, the negative charge of the R65E mutant more significantly compromised binding to inhibitors with a P4′ Glu (average 33-fold, range 21–46-fold) than those with Ala (average 6-fold, range 4–7-fold). To visualize the effects of the mutations on the P4′ Glu specificity, the ratio of the KD values for inhibitors containing Ala versus Glu at P4′ were graphed. Fig. 7 demonstrates that individual mutations of Lys51 and Arg56 decreased, whereas double mutation of these residues (K51A,R56A) or mutation of Arg80 alone (R80L) abolished the P4′ Glu specificity. Introduction of a negative charge in place of Arg56 (mutation R56E) also reduced the P4′ Glu preference of CTRC. Taken together, the mutagenesis results are consistent with the predictions of the modeling and confirm that Lys51, Arg56, and Arg80 participate in stabilizing interactions with the P4′ Glu of phage-selected CTRC inhibitors.
TABLE 3.
Effect of mutations of Lys51, Arg56, and Arg80 in CTRC on the binding of SGPI-2 variants
Equilibrium dissociation constants (KD) were determined as described under “Experimental Procedures” and expressed in nanomolar units of concentration. See Fig. 1 for the primary structure of the inhibitors used.
| C4 | C6 | C7 | C8 | |
|---|---|---|---|---|
| CTRC | 0.02 | 0.11 | 0.35 | 0.88 |
| K51A | 0.08 | 0.99 | 0.51 | 3.3 |
| R56A | 0.13 | 0.90 | 0.63 | 0.89 |
| K51A, R56A | 0.42 | 4.4 | 0.25 | 3.6 |
| R80L | 0.12 | 0.69 | 0.14 | 0.55 |
| R56E | 0.41 | 5.0 | 1.4 | 6.5 |
FIGURE 7.
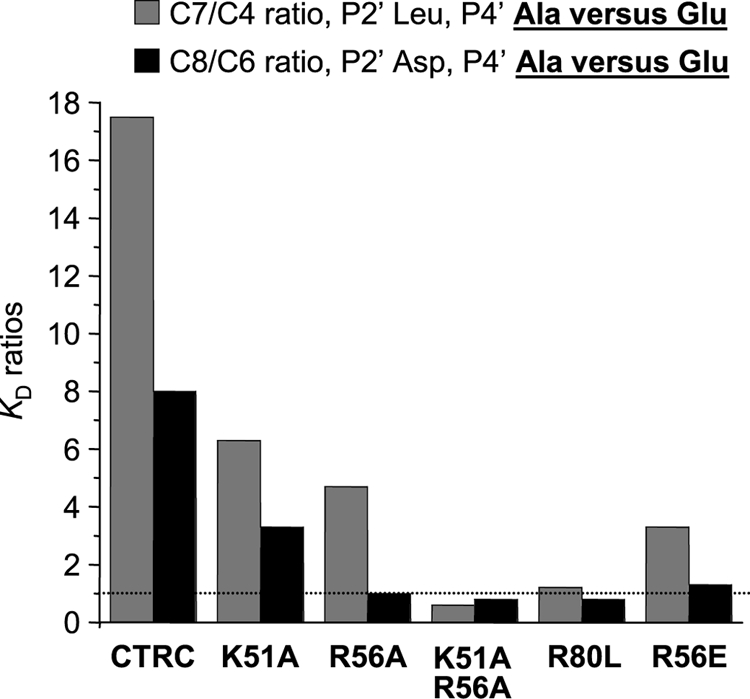
Effect of CTRC mutations on binding to SGPI-2 variants differing in the P4′ position only (Ala versus Glu). Equilibrium dissociation constants (KD) were determined for the C7/C4 and C8/C6 inhibitor pairs, as described under “Experimental Procedures.” The ratio of the KD values (Ala over Glu) was plotted. A high ratio signifies preference for Glu-containing inhibitors, whereas a low ratio indicates loss of P4′ specificity. The dotted line indicates a ratio of 1, with no discrimination between inhibitors containing Ala or Glu at P4′ in their reactive loop.
DISCUSSION
Recent studies highlighted human CTRC as a unique digestive enzyme with the ability to regulate the activity levels of other digestive proteases, trypsins, and carboxypeptidases in particular, through promotion of their activation or degradation (1, 2, 7). These regulatory functions, reviewed in detail under the Introduction, are highly specific to CTRC as other human pancreatic chymotrypsins and elastases exhibit no such activity. The CTRC specificity is partly explained by the known affinity of CTRC for leucyl peptide bonds (8–10). However, taking into account that Leu is the most abundant amino acid in proteins, other recognition determinants in the regulatory CTRC cleavage sites should be also relevant. In this respect, alignment of sequences flanking the regulatory cleavage sites in human cationic trypsinogen (Phe18-Asp19 and Leu81-Glu82) and in human pro-CPA1/pro-CPA2 (Leu96–Leu97) reveals a clustering of acidic amino acid residues on the prime side of the scissile peptide bonds, from P1′ through P4′ (Table 1). To define the cleavage specificity of CTRC and thereby gain further insight into its physiological function, in the present study we utilized a phage display approach to select tight-binding substrate-like chymotrypsin inhibitor variants. To borrow the title of a recent comprehensive review by Zani and Moreau (36), “phage display is a powerful tool to engineer protease inhibitors”; either to gather information on protease specificity or to generate specific reagents for inhibition studies (35). Here, we used SGPI-2, an arthropod-derived small chymotrypsin inhibitor from the pacifastin family (29–32) as a scaffold and fully randomized six positions in the reactive loop, spanning from P4 through P4′, with the exception of the structurally essential P3 and P3′ Cys residues (see Fig. 1).
The results of the phage display selection against CTRC yielded SGPI-2 variants with a reactive loop sequence pattern that identified the amino acid preference of CTRC at five of the six positions randomized, i.e. at P4, P1, P1′, P2′, and P4′. The sole exception was position P2, where a Thr residue was selected predominantly. The P2 Thr is a characteristic feature of many canonical protease inhibitors and it is also strictly conserved in the pacifastin family (32, 33). Both NMR and crystal structures demonstrated that in SGPI homologues the P2 Thr in the reactive loop and Asn15 in a supporting loop participate in a stabilizing H-bond network (26, 37–45). Consequently, conservation of the P2 Thr upon phage display evolution simply recapitulates natural evolution and does not represent the selection of a true protease specificity determinant. From the five positions allowing insight into CTRC specificity, four (P1, P1′, P2′, and P4′) demonstrated a clear predilection toward certain amino acid residues, whereas selection at position P4 was diverse, with only a small preference for small amino acid residues Ala and Gly. On the basis of the sequence pattern selected we have designed and expressed eight SGPI-2 variants and studied their binding to CTRC and a panel of human chymotrypsins and elastases. All eight variants showed significantly improved binding to CTRC relative to the parent SGPI-2 molecule. The C4 variant with the highest affinity (KD 20 pm) represented a 575-fold improvement over wild-type SGPI-2.
With respect to the primary (P1) specificity determinant, the large majority of selected phage clones carried SGPI-2 variants with Met or Leu residues at this position. These two residues are characteristically found in the reactive site of naturally occurring chymotrypsin inhibitors. In a now classic project, the Laskowski laboratory (46) purified and sequenced ovomucoid third domains from 153 bird species, and in the P1 position of the reactive loop found Met and Leu 60 and 66 times, respectively. Nevertheless, when we compared purified SGPI-2 variants in direct binding experiments, the inhibitors containing a P1 Leu bound to human CTRC with an order of magnitude higher affinity than those with P1 Met (see Fig. 3). Thus, Leu is the preferred amino acid residue at the P1 position for human CTRC, which is consistent with the known activity of porcine and bovine CTRC on leucyl peptide bonds (8–10). The comparable selection of phage clones with Met and Leu at P1 suggests that a binding equilibrium has not been reached in our selection experiments. Several phage display studies established that ratios of normalized amino acid frequencies correlate with affinity ratios of the corresponding variants (47–50). However, this correlation applies only when the selection process reaches binding equilibrium, which for high affinity variants with slow off rates may take longer than an experimentally practical time frame.
On the prime side of the reactive loop of selected SGPI-2 variants hydrophobic amino acid residues Met and Leu dominated at the P1′ and P2′ positions, respectively. The P1′ preference of human CTRC resembles that of trypsin rather than chymotrypsin. Thus, bovine cationic and rat anionic trypsin prefer Met side chains at P1′, whereas bovine and rat chymotrypsin prefer positively charged Arg or Lys side chains at this position (30, 34, 51–54). The characteristic Arg/Lys P1′ preference of chymotrypsin is attributed to electrostatic interactions with two negatively charged residues, Asp35 and Asp64 (chymotrypsin numbering), which are not conserved in human CTRC (34). The selection of Leu at P2′ matches the published P2′ preference of rat chymotrypsin determined from measurements of acyl transfer to pentapeptide nucleophiles (51). In addition to the preferred Leu, some of the phage clones selected contained Asp or Glu at the P2′ position of the SGPI-2 reactive loop (see Fig. 1B and supplemental Table S3). This finding was unexpected, as the aforementioned acyl-transfer experiments indicated that acidic side chains at P2′ are poorly recognized by rat chymotrypsin or rat anionic trypsin (52), but was consistent with potentially stabilizing electrostatic interactions with Arg56 and Arg162 identified in our structural model. Binding experiments with SGPI-2 variants carrying a P2′ Asp revealed that binding affinity to CTRC was only moderately compromised (on average ∼3.6-fold versus Leu P2′) but the P2′ Asp increased the selectivity of the inhibitors more significantly, particularly against pancreatic elastases (see discussion on selectivity below).
Arguably, the most exciting observation from the present study was the highly restricted selection of acidic Asp and Glu amino acid residues at the P4′ position of the reactive loop of SGPI-2 variants. Binding experiments comparing inhibitors with P4′ Glu versus Ala demonstrated that the acidic side chain at P4′ increases binding affinity by an order of magnitude on average. Furthermore, inspection of known regulatory cleavage sites for human CTRC in digestive proenzymes reveals that an acidic residue at P4′ is present in all four sequences (Table 1). Taken together, the observations strongly suggest that an interaction between CTRC and the P4′ position of substrates and inhibitors is a major determinant of CTRC recognition and specificity. This property of CTRC appears unique among the pancreatic digestive proteases, as no P4′ preference has been described for trypsin, chymotrypsin, or pancreatic elastase so far. Interestingly, a similar but less pronounced acidic P4′ preference was reported for human granzyme B, a serine protease found in the granules of cytotoxic lymphocytes (55, 56).
In the reactive loop of natural canonical inhibitors that inhibit pancreatic proteases the presence of an acidic Glu or Asp at P4′ is unusual, and Pro is often found here. Among the 153 ovomucoid third domains isolated by Laskowski and co-workers (46) the P4′Pro is strictly conserved. Within the 20 known members of the pacifastin family Pro occupies the P4′ position in eight inhibitors (including SGPI-2), other hydrophobic residues (Leu, Ile, Val, or Ala) are present in seven cases, whereas Arg is found in four members and Gln in one (32). Examination of crystal structures of pacifastin inhibitors bound to serine proteases reveals that in the complex between bovine chymotrypsin and PMP-C a P4′ Pro stacks against Phe39 (chymotrypsin numbering) of the enzyme (26). The same packing interaction was found between P4′ Pro of SGTI and Phe39 (chymotrypsin numbering) of crayfish trypsin (42, 44). In the complex between Fusarium oxysporum trypsin and LMPI-3 the P4′ Arg participates in an H-bond with Asn37 (chymotrypsin numbering) of the enzyme (45). On the other hand, in the complex of bovine chymotrypsin and a P1-P1′ mutant of PMP-D2, in which the P4′ residue is Gln, there is no detectable P4′-S4′ interaction (26). These structural examples indicate that the P4′ position can contribute to inhibitor binding, although functional studies confirming the significance of the P4′-S4′ interactions in these complexes are lacking. We also note that the interacting loop of SGPI-2 is flexible (41), and the P4′ position, being the penultimate residue in SGPI-2, may be conformationally less constrained than in other canonical inhibitors.
To identify the amino acid residues in human CTRC that interact with a P4′ Glu/Asp side chain, we created a model of the CTRC-C6 inhibitor complex using homology modeling. On the basis of this model, we then subjected three positively charged residues (Lys51, Arg56, and Arg80) to mutagenesis and confirmed that this cluster of basic residues on the surface of CTRC is responsible for the observed acidic preference at P4′. Interestingly, Arg80 is not conserved in the bovine, rat, mouse, horse, and dog CTRC, whereas pig CTRC lacks Lys51, suggesting that the strong P4′ Glu/Asp reference may be a distinctive property of the human enzyme.
The SGPI-2 variants selected against CTRC exhibited not only high binding affinity but also good selectivity against other pancreatic chymotrypsins and elastases. In this respect, the best inhibitor was C6, which was from 225- to 112,664-fold more selective toward CTRC than other proteases. The highest selectivity was observed against ELA3A, whereas the lowest was against CTRL1 and ELA2A. Selectivity was determined by amino acids at P1, P2′ and P4′ positions of the reactive loop. P1 Leu (versus Met) increased selectivity by an average of 4-fold. The P2′ Asp (versus Leu) increased selectivity on average 7-fold against elastases and CTRL1 but it had only a small impact on selectivity against CTRB1 and CTRB2. Finally, the most important determinant of selectivity was the P4′ Glu amino acid residue, which increased selectivity (over P4′ Ala) on average by 10-fold against elastases and 55-fold against chymotrypsins.
In summary, we selected novel small protein inhibitors against human CTRC using a phage display approach and identified a functionally important interaction between the acidic P4′ amino acid residue of inhibitors and a basic amino acid cluster in CTRC. The high affinity and strong selectivity of the inhibitors developed in the present study opens up new avenues for experiments on the physiological function of CTRC in digestion and on the pathological role of CTRC mutants in the development of chronic pancreatitis.
Supplementary Material
Acknowledgments
We thank Péter Medveczky, Melinda Bence, and Richárd Szmola for help in CTRC expression and purification. G. P. acknowledges László Gráf for initiating the studies on the SGPI inhibitors at the Department of Biochemistry, Eötvös Loránd University, Budapest, Hungary, in the 1990s.
This work was supported, in whole or in part, by National Institutes of Health Grants R01 DK082412-S2 (ARRA), R01 DK082412, and R01 DK058088 (to M. S.-T.), Hungarian Scientific Research Fund (OTKA) Grants NK81950 and K68408, the European Union and European Social Fund (TÁMOP) Grant 4.2.1./B-09/KMR-2010-0003, and a János Bolyai Research Fellowship (to G. P.).

The on-line version of this article (available at http://www.jbc.org) contains supplemental Fig. S1 and Tables S1–S5.
- CTRC
- chymotrypsin C
- pro-CPA
- procarboxypeptidase A
- PDB
- Protein Data Bank
- SGPI-2
- Schistocerca gregaria protease inhibitor-2.
REFERENCES
- 1. Nemoda Z., Sahin-Tóth M. (2006) J. Biol. Chem. 281, 11879–11886 [DOI] [PMC free article] [PubMed] [Google Scholar]
- 2. Szmola R., Sahin-Tóth M. (2007) Proc. Natl. Acad. Sci. U.S.A. 104, 11227–11232 [DOI] [PMC free article] [PubMed] [Google Scholar]
- 3. Witt H., Luck W., Becker M. (1999) Gastroenterology 117, 7–10 [DOI] [PubMed] [Google Scholar]
- 4. Whitcomb D. C., Gorry M. C., Preston R. A., Furey W., Sossenheimer M. J., Ulrich C. D., Martin S. P., Gates L. K., Jr., Amann S. T., Toskes P. P., Liddle R., McGrath K., Uomo G., Post J. C., Ehrlich G. D. (1996) Nat. Genet. 14, 141–145 [DOI] [PubMed] [Google Scholar]
- 5. Rosendahl J., Witt H., Szmola R., Bhatia E., Ozsvári B., Landt O., Schulz H. U., Gress T. M., Pfützer R., Löhr M., Kovacs P., Blüher M., Stumvoll M., Choudhuri G., Hegyi P., te Morsche R. H., Drenth J. P., Truninger K., Macek M., Jr., Puhl G., Witt U., Schmidt H., Büning C., Ockenga J., Kage A., Groneberg D. A., Nickel R., Berg T., Wiedenmann B., Bödeker H., Keim V., Mössner J., Teich N., Sahin-Tóth M. (2008) Nat. Genet. 40, 78–82 [DOI] [PMC free article] [PubMed] [Google Scholar]
- 6. Masson E., Chen J. M., Scotet V., Le Maréchal C., Férec C. (2008) Hum. Genet. 123, 83–91 [DOI] [PubMed] [Google Scholar]
- 7. Szmola R., Bence M., Carpentieri A., Szabó A., Costello C. E., Samuelson J., Sahin-Tóth M. (2011) J. Biol. Chem. 286, 1819–1827 [DOI] [PMC free article] [PubMed] [Google Scholar]
- 8. Folk J. E., Schirmer E. W. (1965) J. Biol. Chem. 240, 181–192 [PubMed] [Google Scholar]
- 9. Folk J. E., Cole P. W. (1965) J. Biol. Chem. 240, 193–197 [PubMed] [Google Scholar]
- 10. Keil-Dlouha V., Puigserver A., Marie A., Keil B. (1972) Biochim. Biophys. Acta 276, 531–535 [DOI] [PubMed] [Google Scholar]
- 11. Sidhu S. S., Fairbrother W. J., Deshayes K. (2003) Chembiochem. 4, 14–25 [DOI] [PubMed] [Google Scholar]
- 12. Radisky E. S., Koshland D. E., Jr. (2002) Proc. Natl. Acad. Sci. U.S.A. 99, 10316–10321 [DOI] [PMC free article] [PubMed] [Google Scholar]
- 13. Bode W., Huber R. (1992) Eur. J. Biochem. 204, 433–451 [DOI] [PubMed] [Google Scholar]
- 14. Szenthe B., Patthy A., Gáspári Z., Kékesi A. K., Gráf L., Pál G. (2007) J. Mol. Biol. 370, 63–79 [DOI] [PubMed] [Google Scholar]
- 15. Kunkel T. A., Roberts J. D., Zakour R. A. (1987) Methods Enzymol. 154, 367–382 [DOI] [PubMed] [Google Scholar]
- 16. Sidhu S. S., Lowman H. B., Cunningham B. C., Wells J. A. (2000) Methods Enzymol. 328, 333–363 [DOI] [PubMed] [Google Scholar]
- 17. Crooks G. E., Hon G., Chandonia J. M., Brenner S. E. (2004) Genome Res. 14, 1188–1190 [DOI] [PMC free article] [PubMed] [Google Scholar]
- 18. Simonet G., Claeys I., Huybrechts J., De Loof A., Vanden Broeck J. (2003) Protein Expr. Purif. 31, 188–196 [DOI] [PubMed] [Google Scholar]
- 19. Chase T., Jr., Shaw E. (1967) Biochem. Biophys. Res. Commun. 29, 508–514 [DOI] [PubMed] [Google Scholar]
- 20. Pál G., Sprengel G., Patthy A., Gráf L. (1994) FEBS Lett. 342, 57–60 [DOI] [PubMed] [Google Scholar]
- 21. Pál G., Szilágyi L., Gráf L. (1996) FEBS Lett. 385, 165–170 [DOI] [PubMed] [Google Scholar]
- 22. Lengyel Z., Pál G., Sahin-Tóth M. (1998) Protein Expr. Purif. 12, 291–294 [DOI] [PubMed] [Google Scholar]
- 23. Empie M. W., Laskowski M., Jr. (1982) Biochemistry 21, 2274–2284 [DOI] [PubMed] [Google Scholar]
- 24. Arnold K., Bordoli L., Kopp J., Schwede T. (2006) Bioinformatics 22, 195–201 [DOI] [PubMed] [Google Scholar]
- 25. Huang K., Strynadka N. C., Bernard V. D., Peanasky R. J., James M. N. (1994) Structure 2, 679–689 [DOI] [PubMed] [Google Scholar]
- 26. Roussel A., Mathieu M., Dobbs A., Luu B., Cambillau C., Kellenberger C. (2001) J. Biol. Chem. 276, 38893–38898 [DOI] [PubMed] [Google Scholar]
- 27. Gomis-Rüth F. X., Gómez M., Bode W., Huber R., Avilés F. X. (1995) EMBO J. 14, 4387–4394 [DOI] [PMC free article] [PubMed] [Google Scholar]
- 28. Lyskov S., Gray J. J. (2008) Nucleic Acids Res. 36, W233–W238 [DOI] [PMC free article] [PubMed] [Google Scholar]
- 29. Hamdaoui A., Wataleb S., Devreese B., Chiou S. J., Vanden Broeck J., Van Beeumen J., De Loof A., Schoofs L. (1998) FEBS Lett. 422, 74–78 [DOI] [PubMed] [Google Scholar]
- 30. Malik Z., Amir S., Pál G., Buzás Z., Várallyay E., Antal J., Szilágyi Z., Vékey K., Asbóth B., Patthy A., Gráf L. (1999) Biochim. Biophys. Acta 1434, 143–150 [DOI] [PubMed] [Google Scholar]
- 31. Boigegrain R. A., Pugnière M., Paroutaud P., Castro B., Brehélin M. (2000) Insect Biochem. Mol. Biol. 30, 145–152 [DOI] [PubMed] [Google Scholar]
- 32. Breugelmans B., Simonet G., van Hoef V., Van Soest S., Vanden Broeck J. (2009) Peptides 30, 622–632 [DOI] [PubMed] [Google Scholar]
- 33. Simonet G., Claeys I., Broeck J. V. (2002) Comp. Biochem. Physiol. B Biochem. Mol. Biol. 132, 247–255 [DOI] [PubMed] [Google Scholar]
- 34. Kurth T., Ullmann D., Jakubke H. D., Hedstrom L. (1997) Biochemistry 36, 10098–10104 [DOI] [PubMed] [Google Scholar]
- 35. Schreiber G., Fersht A. R. (1995) J. Mol. Biol. 248, 478–486 [DOI] [PubMed] [Google Scholar]
- 36. Zani M. L., Moreau T. (2010) Biochimie 92, 1689–1704 [DOI] [PubMed] [Google Scholar]
- 37. Mer G., Kellenberger C., Koehl P., Stote R., Sorokine O., Van Dorsselaer A., Luu B., Hietter H., Lefèvre J. F. (1994) Biochemistry 33, 15397–15407 [DOI] [PubMed] [Google Scholar]
- 38. Mer G., Hietter H., Lefèvre J. F. (1996) Nat. Struct. Biol. 3, 45–53 [DOI] [PubMed] [Google Scholar]
- 39. Mer G., Hietter H., Kellenberger C., Renatus M., Luu B., Lefèvre J. F. (1996) J. Mol. Biol. 258, 158–171 [DOI] [PubMed] [Google Scholar]
- 40. Gáspári Z., Patthy A., Gráf L., Perczel A. (2002) Eur. J. Biochem. 269, 527–537 [DOI] [PubMed] [Google Scholar]
- 41. Szenthe B., Gáspári Z., Nagy A., Perczel A., Gráf L. (2004) Biochemistry 43, 3376–3384 [DOI] [PubMed] [Google Scholar]
- 42. Fodor K., Harmat V., Hetényi C., Kardos J., Antal J., Perczel A., Patthy A., Katona G., Gráf L. (2005) J. Mol. Biol. 350, 156–169 [DOI] [PubMed] [Google Scholar]
- 43. Gáspári Z., Szenthe B., Patthy A., Westler W. M., Gráf L., Perczel A. (2006) FEBS J. 273, 1831–1842 [DOI] [PubMed] [Google Scholar]
- 44. Fodor K., Harmat V., Neutze R., Szilágyi L., Gráf L., Katona G. (2006) Biochemistry 45, 2114–2121 [DOI] [PubMed] [Google Scholar]
- 45. Leone P., Roussel A., Kellenberger C. (2008) Acta Crystallogr. D Biol. Crystallogr. 64, 1165–1171 [DOI] [PubMed] [Google Scholar]
- 46. Apostol I., Giletto A., Komiyama T., Zhang W., Laskowski M., Jr. (1993) J. Protein Chem. 12, 419–433 [DOI] [PubMed] [Google Scholar]
- 47. Weiss G. A., Watanabe C. K., Zhong A., Goddard A., Sidhu S. S. (2000) Proc. Natl. Acad. Sci. U.S.A. 97, 8950–8954 [DOI] [PMC free article] [PubMed] [Google Scholar]
- 48. Pal G., Kossiakoff A. A., Sidhu S. S. (2003) J. Mol. Biol. 332, 195–204 [DOI] [PubMed] [Google Scholar]
- 49. Pál G., Kouadio J. L., Artis D. R., Kossiakoff A. A., Sidhu S. S. (2006) J. Biol. Chem. 281, 22378–22385 [DOI] [PubMed] [Google Scholar]
- 50. Pál G., Fong S. Y., Kossiakoff A. A., Sidhu S. S. (2005) Protein Sci. 14, 2405–2413 [DOI] [PMC free article] [PubMed] [Google Scholar]
- 51. Schellenberger V., Turck C. W., Hedstrom L., Rutter W. J. (1993) Biochemistry 32, 4349–4353 [DOI] [PubMed] [Google Scholar]
- 52. Schellenberger V., Turck C. W., Rutter W. J. (1994) Biochemistry 33, 4251–4257 [DOI] [PubMed] [Google Scholar]
- 53. Grahn S., Kurth T., Ullmann D., Jakubke H. D. (1999) Biochim. Biophys. Acta 1431, 329–337 [DOI] [PubMed] [Google Scholar]
- 54. Patthy A., Amir S., Malik Z., Bódi A., Kardos J., Asbóth B., Gráf L. (2002) Arch. Biochem. Biophys. 398, 179–187 [DOI] [PubMed] [Google Scholar]
- 55. Sun J., Whisstock J. C., Harriott P., Walker B., Novak A., Thompson P. E., Smith A. I., Bird P. I. (2001) J. Biol. Chem. 276, 15177–15184 [DOI] [PubMed] [Google Scholar]
- 56. Van Damme P., Maurer-Stroh S., Plasman K., Van Durme J., Colaert N., Timmerman E., De Bock P. J., Goethals M., Rousseau F., Schymkowitz J., Vandekerckhove J., Gevaert K. (2009) Mol. Cell. Proteomics 8, 258–272 [DOI] [PubMed] [Google Scholar]
Associated Data
This section collects any data citations, data availability statements, or supplementary materials included in this article.