

Abstract
The adaptor protein ankyrin-R interacts via its membrane binding domain with the cytoplasmic domain of the anion exchange protein (AE1) and via its spectrin binding domain with the spectrin-based membrane skeleton in human erythrocytes. This set of interactions provides a bridge between the lipid bilayer and the membrane skeleton, thereby stabilizing the membrane. Crystal structures for the dimeric cytoplasmic domain of AE1 (cdb3) and for a 12-ankyrin repeat segment (repeats 13–24) from the membrane binding domain of ankyrin-R (AnkD34) have been reported. However, structural data on how these proteins assemble to form a stable complex have not been reported. In the current studies, site-directed spin labeling, in combination with electron paramagnetic resonance (EPR) and double electron-electron resonance, has been utilized to map the binding interfaces of the two proteins in the complex and to obtain inter-protein distance constraints. These data have been utilized to construct a family of structural models that are consistent with the full range of experimental data. These models indicate that an extensive area on the peripheral domain of cdb3 binds to ankyrin repeats 18–20 on the top loop surface of AnkD34 primarily through hydrophobic interactions. This is a previously uncharacterized surface for binding of cdb3 to AnkD34. Because a second dimer of cdb3 is known to bind to ankyrin repeats 7–12 of the membrane binding domain of ankyrin-R, the current models have significant implications regarding the structural nature of a tetrameric form of AE1 that is hypothesized to be involved in binding to full-length ankyrin-R in the erythrocyte membrane.
Keywords: Electron Paramagnetic Resonance (EPR), Erythrocyte, Membrane Biophysics, Membrane Structure, Spectroscopy
Introduction
Human erythrocytes exhibit an unusual biconcave disc shape and remarkable plasma membrane mechanical stability and deformability, all of which are necessary for their survival in the circulatory system. It is now well established that the unusual cell shape and membrane mechanical properties are due in large part to the presence of an extensive membrane skeleton, composed primarily of the proteins spectrin and actin, that lines the inner membrane surface and to specific bridging interactions between this membrane skeleton and intrinsic membrane proteins in the lipid bilayer. The spectrin-actin skeleton associates with the membrane bilayer via two types of contacts, one involving short actin protofilaments and protein 4.1, which interact with the cytoplasmic domain of glycophorin C, and the second involving the bridging protein ankyrin-R and protein 4.2, which interact with the cytoplasmic domain of the anion exchange protein (AE1)3 also known as band 3. Alterations in this second class of interactions often result in spherical erythrocytes with decreased cell size and increased fragility, a condition known clinically as hereditary spherocytosis. Hereditary spherocytosis is a spectrum of inherited diseases, occurring in one family out of 2,000–3,000, which present clinically as varying degrees of hemolytic anemia resulting from hemolysis of the spherical erythrocytes as they flow through the microcirculation. Recent data have indicated that 15–20% of hereditary spherocytosis cases are attributable to AE1 mutations and that ∼50% of hereditary spherocytosis cases result from ankyrin-R mutations (1).
The ankyrin family of adaptor proteins, which includes the three isoforms ankyrin-R, ankyrin-G, and ankyrin-B in vertebrates, serves critical functions in cells by linking the lipid bilayer to the spectrin-actin-based membrane skeleton as well as assembling proteins in specialized membrane domains (reviewed in Refs. 2–4). Like the other two isoforms, ankyrin-R contains an N-terminal membrane binding domain, a central spectrin binding domain, and a C-terminal regulatory domain. The membrane binding domain is composed of 24 ankyrin repeat modules, each of which contains two anti-parallel α-helices and a long loop. The individual repeats are connected by a β-hairpin, giving rise to stacking of the ankyrin repeats in a superhelical spiral (5). Proteolysis studies have shown that the 24 repeats in ankyrin-R, the isoform in human erythrocytes, can be subdivided into four groups of six repeats each (D1, D2, D3, and D4). This same study demonstrated that the full-length membrane binding domain of ankyrin-R bound two cdb3 dimers with positive cooperativity. One binding site was located in domain 2 (AnkD2; repeats 7–12), and the second binding site was located in domains 3 and 4 (AnkD34; repeats 13–24) (6).
Previous studies have indicated that a “tetramer” of AE1, rather than the fundamental dimer, is involved in binding ankyrin-R (e.g. Refs. 7 and 8). Interestingly, a stable subpopulation of AE1 tetramers can be extracted by non-ionic detergents from erythrocyte ghost membrane preparations (e.g. Refs. 9–11). What is not known is whether interaction of two cdb3 dimer domains of AE1 with the two cooperative binding sites on ankyrin-R (6) drives the formation of a true tetramer of cdb3 or whether the structure is more accurately described as a dimer of dimers with no major structural rearrangements of the individual dimer units.
Now that crystal structures are available for isolated cdb3 (12) and for isolated ankyrin-R repeats 13–24 (AnkD34 (5)), it is possible to determine the structure of the complex formed between one cdb3 dimer and AnkD34 using modern protein-docking algorithms in conjunction with structural constraints obtained from site-directed spin labeling studies (e.g. Refs. 13–15). In the present studies, site-directed spin labeling and EPR have been employed to map the binding interfaces on cdb3 and on AnkD34 under conditions where the proteins form a stable complex. Distance measurements using double electron-electron resonance (DEER) between pairs of spin labels in cdb3 and AnkD34 have shown that the global structure of neither protein is significantly altered upon complex formation. All of these data have been utilized to build a family of structural models using the ROSETTA suite of docking algorithms (reviewed in Ref. 16) that are compatible with the experimental data. The models indicate that a large section of the peripheral domain of cdb3 interacts with ankyrin repeats 18–20 on the top loop region of AnkD34 primarily through hydrophobic interactions. The binding surface on AnkD34 is remote from the ankyrin groove, which has been hypothesized to be involved in binding to a number of membrane proteins. In preliminary docking studies, the ankyrin groove of AnkD34 was hypothesized to be involved in binding to cdb3 (5). The models presented in this work indicate that the ankyrin groove is not the binding interface, and they also place restrictions on whether a second cdb3 dimer could bind to the D2 domain of ankyrin-R to form a true tetramer of cdb3.
EXPERIMENTAL PROCEDURES
Protein Preparation and Spin Labeling
The preparation and spin labeling of wild-type and single or double Cys mutants of cdb3 have been described in previous work (17). The cDNA encoding ankyrin repeats 13–24 plus 12 residues from the spectrin binding domain (AnkD34; residues 403–827) of ankyrin-R were provided by Dr. Peter Michaely (University of Texas, Southwestern). The DNA construct for wild type-AnkD34 was inserted into the pGEX-2T expression vector (GE Healthcare) wherein the two endogenous cysteines at positions 476 and 531 were converted to Ser and Ala, respectively. Cys-less and single or double Cys mutants were constructed using the QuikChange site-directed mutagenesis kit (Stratagene, La Jolla, CA). The GST fusion protein was overexpressed in BL21 Gold (DE3)-competent cells by incubating the culture at 17 °C for 3.5–4 h in the presence of 1 mm isopropyl-β-thiogalactoside and purified using a GST affinity chromatography system (GE Healthcare) following the manufacturer's instructions. Before being cleaved from the resin, single or double Cys mutants of AnkD34 were reacted with a 10-fold molar excess of 1-oxyl-2,2,5,5,-tetramethyl-Δ3-pyrroline-3-methyl methanethiosulfonate (MTSSL) spin label (Toronto Research Chemicals, North York, ON, Canada; Fig. 1) in the binding buffer plus 0.1% (v/v) octaethylene glycol monododecyl ether (C12E8) at room temperature for 2 h and then at 4 °C overnight. Unreacted spin label was removed by flowing excess washing buffer (50 mm sodium phosphate buffer containing 500 mm NaCl, 2 mm EDTA, pH 7.0) through the column until no spin label was detected in the flow-through by EPR. Spin-labeled AnkD34s were released from the immobilized GST tag by thrombin cleavage in binding buffer, which contained 50 mm sodium phosphate, 500 mm NaCl, 2 mm EDTA, and 10% (w/v) glycerol, pH 7.0. Upon completion of the cleavage reaction, benzamidine-Sepharose (GE Healthcare) was added to remove the residual thrombin from the protein solution. Protein purity was assessed by SDS-PAGE as described in previous work (18). All samples used in the studies were >95% pure as judged by Coomassie Blue staining intensity. Protein concentrations were determined either by using the Bradford assay with bovine serum albumin as a standard or by measuring absorbance at 280 nm with the calculated extinction coefficients for each protein construct (cdb3, 33,920 m−1cm−1; AnkD34, 15,930 m−1cm−1).
FIGURE 1.
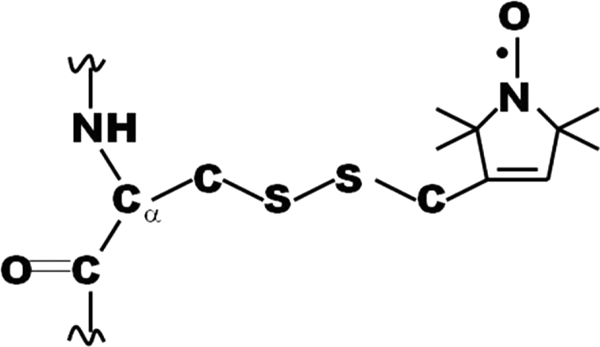
The spin-labeled side chain resulting from reaction of MTSSL with cysteine.
GST Pulldown Binding Assay
To assess the effect of mutation and concomitant spin labeling on the binding affinity of singly labeled cdb3 mutants, a known amount (0.5–1 nmol) of wt-ankD34-GST fusion protein was immobilized on the GST resin. To each aliquot of 50% (v/v) suspension, a 4-fold molar excess amount of a singly labeled cdb3 mutant was added. After overnight incubation at 4 °C, the column was washed with washing buffer three times to remove the unbound cdb3. The resultant resin was directly loaded onto a SDS-PAGE gel, and the band intensities of each protein were analyzed using a UN-SCAN-IT gel digitizing system (Silk Scientific, Orem, UT). The amount of bound cdb3 was assessed from the band intensity ratio between bound cdb3 and normalized wt-AnkD34 fusion protein. The relative binding affinity of each spin-labeled cdb3 mutant was estimated by comparing the bound fraction of a mutant with that of wt-cdb3. Likewise, the binding affinities of singly labeled AnkD34 mutants were evaluated in the same manner as described above using a series of singly labeled AnkD34-GST fusion proteins that were immobilized on the resin and wt-cdb3. The data from these experiments are provided in supplemental Figs. S2 and S3.
Complex Formation
Complexes between spin-labeled AnkD34s and cdb3s were prepared by incubating wild-type or specific spin-labeled proteins in the same binding buffer defined above at 4 °C overnight. Both proteins were concentrated to the desired range using a centrifugal membrane filter device (30-kDa molecular mass cutoff; Millipore, Billerica, MA) before complex formation.
Chemical Cross-linking of cdb3-AnkD34 Complexes
Cross-linking of the complex between a pair of Cys residues from each protein was accomplished using a homo-bifunctional maleimide cross-linker, bismaleimidoethane (BMOE, Pierce Biotechnology), following the manufacturer's instructions. Briefly, each pair of single Cys mutants of cdb3 and AnkD34 was mixed at an equimolar ratio (10 μm final concentration of each protein) and allowed to form a complex in binding buffer containing 5 mm EDTA as mentioned above. To 100 μl of protein mix, freshly prepared BMOE stock solution (20 mm in N,N-dimethylformamide) was added to give 30 μm final concentration. After a 1-h incubation at room temperature, the reaction was quenched with Laemmli sample buffer supplemented with 5 mm SDS and 10 mm DTT, and the formation of the cross-linked complex in the reaction mixture was visualized by SDS-PAGE as described in previous work (18).
EPR Measurements
EPR spectra were collected at X-band (9.8 GHz) on a Bruker EMX spectrometer fitted with a TM110 cavity (BrukerBiospin, Billerica, MA) using 5 milliwatts of microwave power and 1 Gauss of field modulation at 100 kHz. Samples were prepared in the binding buffer in the 80–120 μm concentration range, and spectra were collected at room temperature in 50-μl glass capillaries (Kimble Glass, Inc., Vineland, NJ). For the measurement of spin label side chain accessibilities, a singly labeled protein mixed with a 4 m excess amount of its non-labeled binding partner was used to ensure saturation of binding sites. NiEDDA accessibility of individual sites on each protein was measured using a gas-permeable TPX (a tradename for polymethylpentene) capillary and an ER4123D resonator (BrukerBiospin) as described previously (17). Accessibilities are expressed numerically as dimensionless Π values, which were calculated from the following equation
where P½ is the half-saturation power in the presence of NiEDDA or N2 and ΔH0 is the field width of the central peak. Short inter-probe distances (<20 Å) were measured on samples in binding buffer plus 50% glycerol at 2 °C. The resulting EPR spectra were analyzed using the convolution method, which assumes Gaussian distance distributions as described in previous work (e.g. Refs. 19 and 20).
Four-pulse DEER Measurements and Data Analysis
The four-pulse DEER experiment was performed at X-band (9.5 GHz) on a Bruker EleXsys 580 spectrometer equipped with a Bruker split ring resonator (ER 4118X-MD5). A standard four-pulse sequence was employed with a 32-ns π pulse and a 16-ns π/2-pulse sequence. All measurements were recorded at 80 K. Samples were prepared in binding buffer containing 30% (w/w) glycerol in the 150–250 μm concentration range and loaded into 2.4-mm inner diameter quartz capillaries (Wilmad LabGlass, Buena, NJ). Although the inter-protein distances were measured from a complex composed of two labeled proteins in an equimolar ratio, for the intra-protein distances, labeled proteins were allowed to form a complex with a 1.5–2 m excess amount of its diamagnetic binding partner prior to the measurement. All DEER data were analyzed using software developed in-house, which simultaneously fits the background signal as a function of an effective spin concentration and radius of the molecule or complex while determining the specific interactions of interest using a distance distribution defined as a sum of Gaussians.4 This approach, which takes into account the excluded volume of the molecule or complex, typically gave better fits to the data than those obtained using a priori background correction. All of the DEER data shown in the figures are with the background removed subsequent to the analysis. The calculated average distances and distance distributions were similar to those obtained using the conventional Tikhonov regularization method (21).
Molecular Modeling
The structure refinement process was carried out by first generating a large number of docked cdb3-AnkD34 complexes. The experimental results presented in Figs. 2 and 3, below, indicate that neither the cdb3 homo-dimer nor the AnkD34 fragment undergoes any major global conformational changes upon complex formation. Therefore, the RosettaDock program (22) was used to perform rigid docking calculations with the x-ray crystal structures for cdb3 (Protein Data Bank (PDB) code 1HYN) and AnkD34 (PDB code 1N11). 100,000 docked complexes were generated using unrestrained rigid body docking to explore all plausible docking orientations as shown in Fig. 9, upper panel, below. Next, a filtering protocol was devised to screen the 100,000 candidate complexes to eliminate all the models that were clearly inconsistent with the experimental DEER distance measurements. In the first-pass filter, the Cβ-Cβ distance was measured for a pair of spin-labeled sites in cdb3 and AnkD34 from each docking model. To take the extrinsic distance between the nitroxide electron and the Cβ carbon (∼7 Å) into account, Cβ-Cβ distance ± 14 Å cutoff was applied to select acceptable models in the first-pass filter process. Because cdb3 is a homo-dimer, spin label positions in each subunit were considered in the filtering process. Using this cutoff criterion and 20 experimental DEER distance measurements, it was determined that 811 docked poses from the RosettaDock calculations were compatible with the distance constraints as shown in Fig. 9, middle panel. All other docking poses had at least one (and generally many) spin label pair distance violation that exceeded the Cβ-Cβ ± 14 Å tolerance value.
FIGURE 2.

Inter-subunit distances between spin-labeled side chains of cdb3 before and after complex formation with AnkD34 measured by DEER. Three pairs of surface sites consisting of identical positions from each monomer were selected as depicted by the spheres (84 positions, red; 302 positions, orange; 340 positions, yellow) in the upper panel. The DEER data (black dots) and fits to the data (blue (before complex formation) and red (after complex formation)) are shown as solid lines in the stacked plots in the lower panel. The resultant average distances and distance distributions from fitting the data (Å) are shown in the insets.
FIGURE 3.

Intra-protein distances in AnkD34 measured by DEER. The residue pairs are defined by the structure in the upper panel, and representative DEER data before and after complex formation with cdb3 are shown in the lower panel. The DEER data (black dots) and fits to the data before complex formation (blue) and after complex formation (red)red) are shown as solid lines in the stacked plots in the lower panel. The resultant average distances and distance distributions from fitting the data (Å) are shown in the insets.
FIGURE 9.
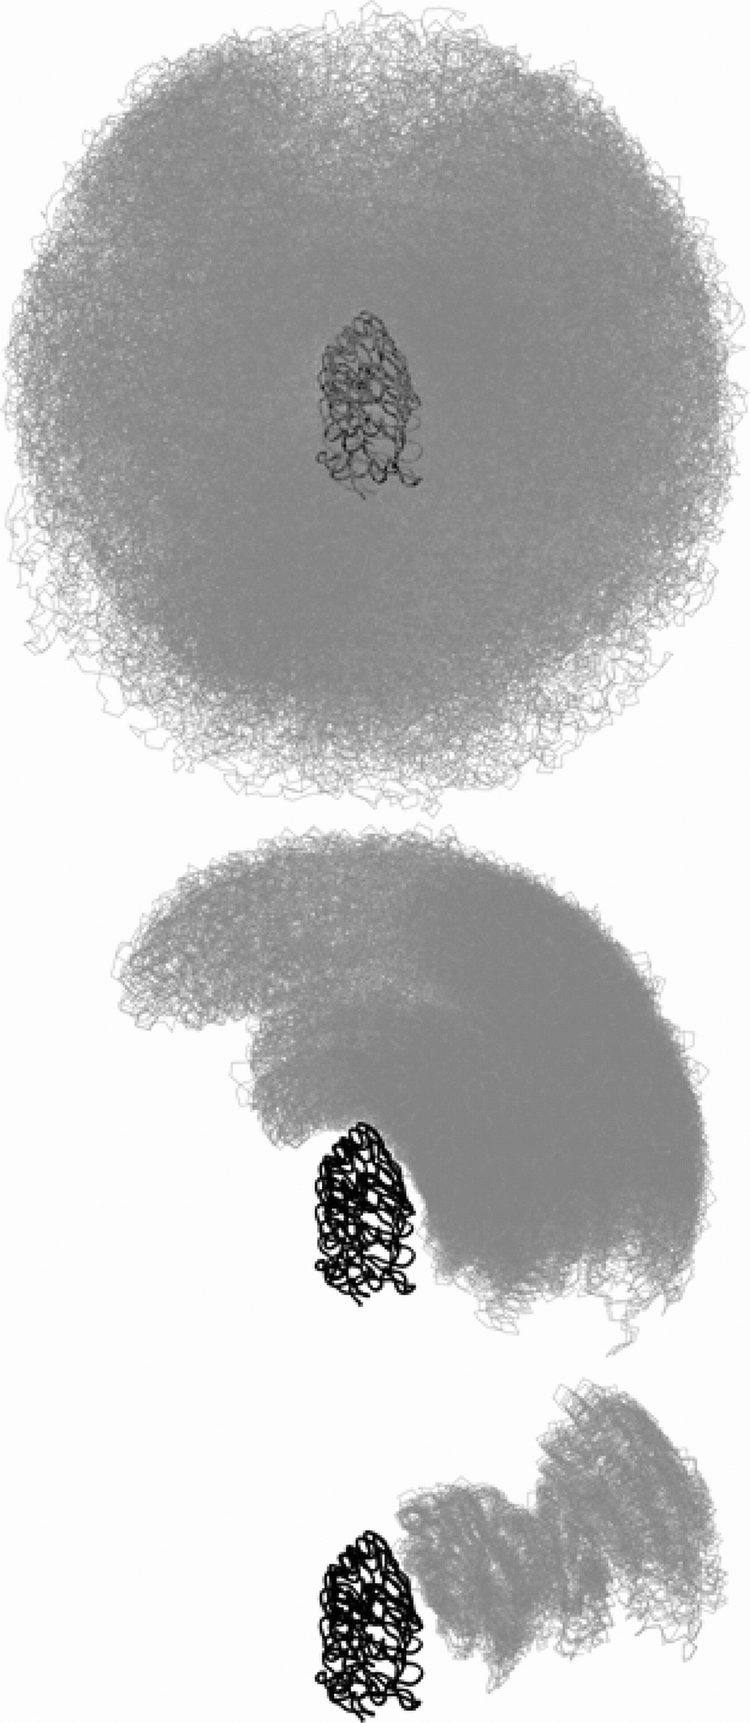
Ensemble of structural models for the cdb3-AnkD34 complex superimposed on the crystal structure of AnkD34. The top panel shows 500 representative poses from the 100,000 generated by RosettaDock using no constraints to guide how the proteins could interact. The center panel shows how filtering these 100,000 poses using the 20 inter-protein distance constraints from DEER measurements reduced the number of poses to 811 and gave a strong indication of the surfaces of the two proteins that formed the binding interface, the potential orientations of cdb3 relative to AnkD34, and which ankyrin repeats were likely involved in binding. The bottom panel shows the top 30 structures that were obtained by filtering the 811 poses in the center panel with the solvent accessibility data as described under “Experimental Procedures.”
A second-stage filter was then implemented to select candidate structures that were consistent with experimental data for spin label side chain accessibility. Using MSMS software (23), per-residue solvent-accessible surface areas were computed for five sites that caused large reductions in complex formation upon mutation (cdb3, 72, 129, 158; AnkD34, 596 and 629) and nine sites that exhibited large changes in NiEDDA accessibility (i.e. changes in Π values of <−8; see Tables 1 and 2) upon formation of the complex (cdb3, 137, 148, 160, 166, 254; AnkD34, 598, 631, 662, 664). Using canonical surface areas for fully exposed side chains in GXG tripeptides (24), the raw surface area computed for each of the wild-type residues was normalized to a value between 0 and 1, with 1 representing a fully exposed residue and 0 representing a fully buried residue. The normalized values were summed together to form an accessibility score, where a small score corresponds to more buried surface and therefore better agreement with the experiment. The top 100 structures were sorted based upon increasing accessibility score, and every 10 structures were then binned cumulatively from the top.
TABLE 1.
NiEDDA accessibility of surface sites on the peripheral domain of cdb3
Standard deviations from triplicate measurements are shown in parentheses. Π values are dimensionless quantities as defined under “Experimental Procedures.” Residues 126 through 141 are in the α2 helix. Residues 148–155 are in the α3 helix. Residues 179–183 are in the β6-β7 hairpin loop. Residues 70, 160, 166, 216, 254, 293 and 302 are distributed over the peripheral domain of cdb3.

TABLE 2.
NiEDDA accessibility of surface sites on AnkD34
Π values are dimensionless quantities as defined under “Experimental Procedures”.

An overall backbone r.m.s.d. was then computed for all structures in each of the bins, and the r.m.s.d. values versus bin size were plotted. The larger bins, with 40 or more structures, contained structures with accessibility scores that were a minimum of 28% larger than the best overall score of 1.96. In addition, the slope of the r.m.s.d. versus bin size plot is much steeper beginning with a bin size of 40, indicating that besides significantly worse accessibility scores, the larger bins contain structures that look significantly different from the best-scoring structure (r.m.s.d. from the mean of as high as 6.1 Å in the 40-structure bin, moving higher from there). Given these statistics, the top 30 structures were chosen as the final solution set, which spans a range of accessibility scores from 1.96–2.48 and has an average pairwise r.m.s.d. value of 2.68 Å over all backbone atoms.
It should be noted that it is also possible to more precisely model the orientation of the R1 side chain, thereby lowering the ± 14 Å tolerance value used in this work (e.g. (15, 25–29). However, having extensive interface mapping data from solvent accessibility measurements permitted the determination of structural models without the need for these approaches.
RESULTS
cdb3 and AnkD34 Form a Complex without Any Major Changes in Their Global Structures
The first questions that were addressed were whether the global structures of either cdb3 or AnkD34 were significantly altered upon complex formation. This question was addressed for cdb3 by spin labeling selected sites on the cdb3 dimer and then observing dipolar couplings by EPR for sites at the dimer interface or by DEER at selected sites remote from the dimer interface in the absence and then the presence of bound wt-AnkD34. As shown by the representative data in Fig. 2 and by additional data in supplemental Fig. S1, there were no significant changes in inter-probe distances as a result of complex formation, indicating that the global structure of the cdb3 dimer was not altered even under conditions where a wt-AnkD34 was bound to the peripheral domain of each monomer. The analyses of the DEER data in Fig. 2 are shown in tabular form in supplemental Table S1. Likewise, when two cysteine residues were introduced into Cys-less AnkD34 at sites in the groove region or along the convex backbone and DEER measurements were made on the spin-labeled proteins, there were no significant changes in inter-probe distances following complex formation with wt-cdb3 as shown in Fig. 3 and as given in tabular form in supplemental Table S2. Collectively, these data indicated that modeling of the structure of the complex formed between cdb3 and AnkD34 to a first approximation would only require rigid body docking of the two proteins using binding interface information obtained from EPR experiments (i.e. what surfaces of the two proteins are in close contact) and inter-protein distance constraints obtained from EPR or DEER experiments (i.e. what is the relative spatial positioning of the two proteins). This basic approach has been described and successfully utilized in previous work on other protein complexes by other investigators (e.g. Refs. 13–15).
Determination of the Binding Interface on cdb3
Studies by a number of investigators (e.g. Refs. 30–33) as well as our own previous studies (34) have indicated that residues on the peripheral domains of the cdb3 dimer are involved in binding to ankyrin-R. The binding interface is further defined by the EPR data in Fig. 4 where specific sites on the α2-helix, on the α3-helix, and on the β6/β7-hairpin loop of cdb3 show significant changes in spin label side chain mobility when wt-AnkD34 is bound. In addition, spin-labeled side chains at residues 160 and 254 also showed changes in mobility upon complex formation. When spin-labeled side chains were introduced at residues 70, 72, 129, 155, and 158, binding affinity to wt-AnkD34 was reduced by greater than 60% (see binding data in supplemental Fig. S2), suggesting that these residues are in close contact with residues in AnkD34 in the complex and that a spin-labeled side chain at these positions disrupts critical contacts between the two proteins. These changes in side chain mobility are mapped onto the crystal structure of cdb3 in Fig. 5, upper panel. Spin-labeled side chains at many other positions on the peripheral domains and at the dimer interface showed no changes in side chain mobility upon complex formation (Ref. 34 and data not shown), consistent with the observation of no changes in the global structure of cdb3 when it is bound to AnkD34. The binding interface was further defined by measuring the solvent accessibility of the same sites using NiEDDA as the paramagnetic broadening agent. As shown in Fig. 5, lower panel, and in tabular form in Table 1, solvent accessibility mirrors the changes in spin-labeled side chain mobility, providing further evidence for the surface on cdb3 that is involved in direct interaction with AnkD34.
FIGURE 4.
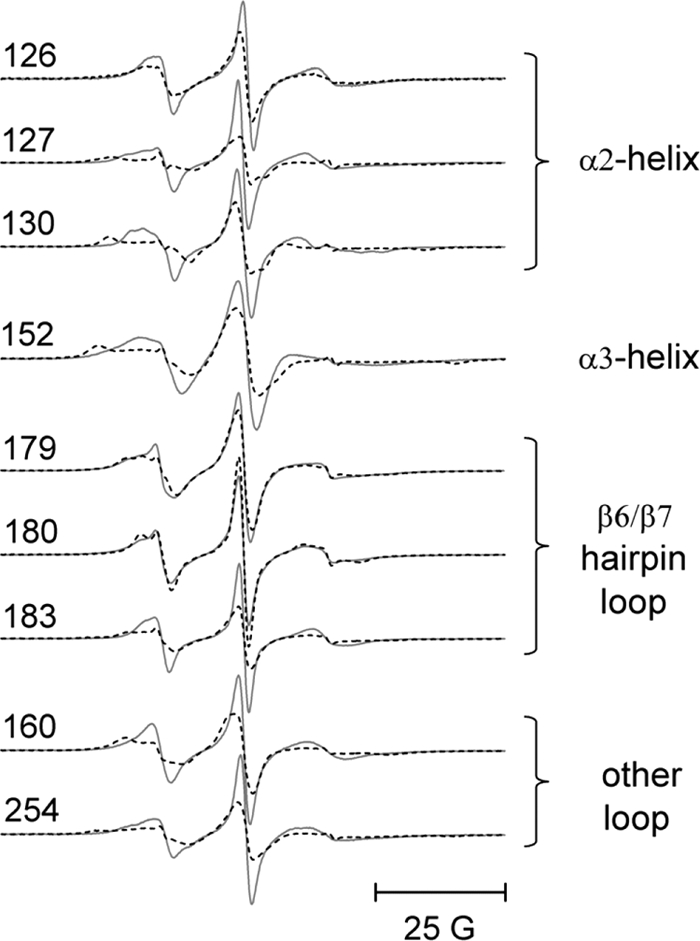
Representative EPR spectra from spin-labeled side chains incorporated into the α2 helix (126, 127, and 130), the α3 helix (152), and the β6/7 hairpin loop (179, 180, and 183) in the peripheral domain of cdb3. The spectra in solid lines were recorded in the absence of wt-AnkD34. The superimposed spectra in dashed lines were recorded after complex formation with wt-AnkD34. Also shown are the data from sites 160 and 254, which lie outside these three structured domains but which showed significant changes upon binding of wt-AnkD34. There were no changes in EPR line shapes upon complex formation at sites 133, 134, 137, 140, and 141 in the α1 helix, at sites 148 and 151 in the α2 helix, and at site 181 in the β6/7 hairpin loop (data not shown). 25 G, 25 Gauss.
FIGURE 5.

Changes in spin label side chain mobility (upper panel) and solvent accessibility (lower panel) as assessed by collision frequency with NiEDDA mapped onto the crystal structure of cdb3. The red residues in the upper panel showed a decrease in side chain mobility upon complex formation, the black residues showed no change, and the blue residues showed significantly impaired complex formation when the wt residue was changed to cysteine and spin-labeled with MTSSL. The same color scheme is used for the NiEDDA accessibility data in the lower panel for the black and blue residues, whereas the residues that showed changes in accessibility were displayed with three different colors based on their ΔΠ (Πcomplex-Πcdb3) values (red, ΔΠ < −15.0; hot pink, −15.0 ≤ ΔΠ < −5.0; pale pink, −5.0 ≤ ΔΠ < −2.0).
Determination of the Binding Interface on AnkD34
Early work by Michaely and Bennett (6) showed that binding of cdb3 to ankyrin repeats 13–24 was salt-independent, unlike the binding to ankyrin repeats 7–12, which was salt-dependent. This important observation provided evidence that the binding of cdb3 to AnkD34 was likely to be dominated by hydrophobic interactions. In agreement with this hypothesis, placing spin-labeled side chains in the groove of ankyrin repeats in AnkD34, which contain a number of charged and polar residues, showed no changes in mobility upon complex formation (data not shown). However, as shown in Fig. 6, when spin-labeled side chains were incorporated into the top linker surface of ankyrin repeats 18, 19, and 20 in AnkD34, there were significant changes in mobility when a complex was formed with wt-cdb3. Introduction of spin-labeled side chains at equivalent structural positions in repeats 17 and 21 showed no changes in mobility upon complex formation (data not shown). Incorporation of a spin-labeled side chain at residue 596 in ankyrin repeat 18 and at position 629 in ankyrin repeat 19 (Fig. 7, blue residues) inhibited binding affinity of wt-cdb3 by greater than 80% (see supplemental Fig. S3), suggesting that these residues are critical for binding of the two proteins. The side chain mobility data are mapped onto the x-ray crystal structure of AnkD34 in Fig. 7, upper panel. The binding interface was further defined by measuring the solvent accessibility of the same sites using NiEDDA as the paramagnetic broadening agent. Consistent with the mobility measurements, the residues that show most of the major changes in NiEDDA accessibility (Table 2; residues 590, 598, 623, 631, 662, 664) are clustered on the top linker surface together with residues 596 and 629. Note that the residues that reside on the same linkers, but whose side chains are facing the groove in the crystal structure (Table 2; residues 599, 603, and 636), showed no change in solvent accessibility. Overall, as shown in Fig. 7, lower panel, solvent accessibility again mirrors the changes in spin-labeled side chain mobility, providing further evidence for the surface on AnkD34 that is involved in direct interaction with cdb3.
FIGURE 6.
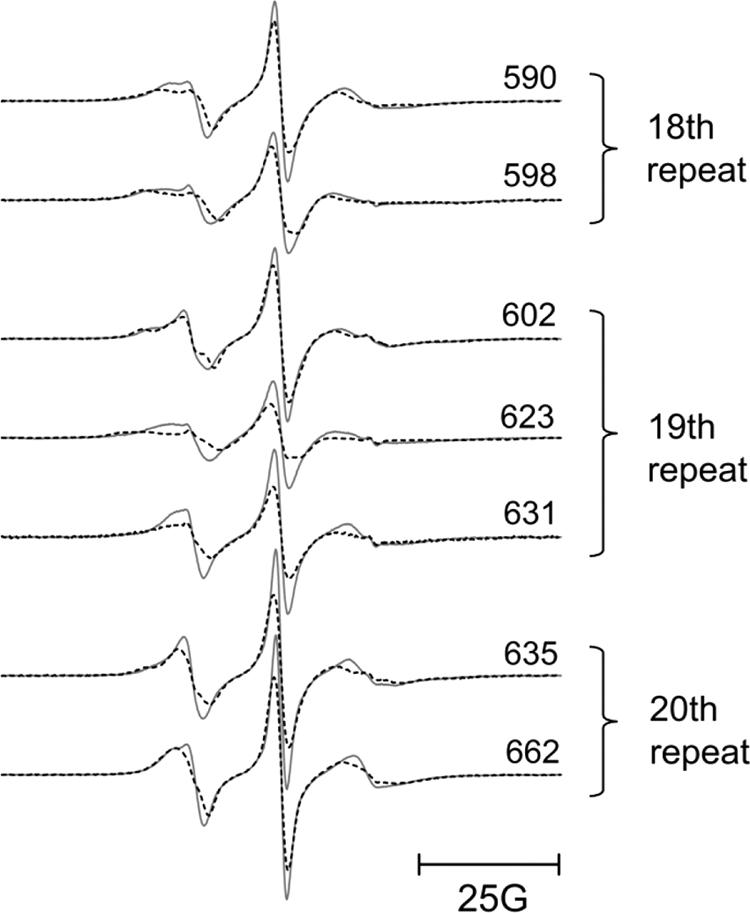
Representative EPR spectra from spin-labeled side chains incorporated into the top loop regions of ankyrin repeat 18 (590 and 598), ankyrin repeat 19 (602, 623, and 631), and ankyrin repeat 20 (635 and 662) in AnkD34. The spectra in gray solid lines were recorded in the absence of wt-cdb3. The superimposed spectra in black dashed lines were recorded after complex formation with wt-cdb3. 25G, 25 Gauss.
FIGURE 7.

Changes in spin label side chain mobility (upper panel) and solvent accessibility as assessed by collision frequency with NiEDDA (lower panel) mapped onto the x-ray crystal structure of AnkD34. The red residues in the top panel showed a decrease in side chain mobility upon complex formation, the black residues showed no change, and the blue residues showed significantly impaired complex formation when the wt residue was changed to cysteine and spin-labeled with MTSSL. The same color scheme is used for the NiEDDA accessibility data in the lower panel for the black and blue residues, whereas the residues that showed changes in accessibility were displayed with three different colors based on their ΔΠ (Πcomplex-ΠAnkD34) values (red, ΔΠ < −14.0; hot pink, −14.0 ≤ ΔΠ < −5.0; pale pink, −5.0 ≤ ΔΠ < −2.0).
Inter-protein Distance Constraints from DEER Measurements
Having determined the surfaces on cdb3 and on AnkD34 that were at the binding interface, it was possible to rationally choose residues on each protein for introduction of single Cys mutations, spin labeling, and making DEER measurements of inter-protein distances. The inter-protein distance data make it possible to spatially orient the two proteins relative to each other (13–15). Fig. 8 shows the 20 inter-protein distances that were chosen along with representative DEER data and analysis from three of the spin label pairs. The results of the analyses of all of the DEER data from the 20 pairs are listed in Table 3, and the experimental spectra from the remaining 17 pairs of sites are shown in supplemental Fig. S4. Most of the DEER data from these 20 pairs of sites (13 out of 20) gave rise to a single average distance and distance distribution without interference from the intra-dimer spin label on cdb3. However, analysis of data involving sites 70, 141, 148, 179, and 302 on cdb3 gave rise to two distance components, one from the intra-dimer dipolar coupling of spin labels on cdb3 and one from the inter-protein dipolar interaction of spin labels on cdb3 and AnkD34. The intra-dimer distances were easily analyzed by extending the modulation time window in the DEER experiment and extraction of both inter-probe distances by a bimodal distance distribution as shown by the data presented in supplemental Fig. S4.
FIGURE 8.

The 20 inter-protein distances between selected sites on cdb3 and on AnkD34 that were used to refine the structural model for the complex shown in Fig. 10. The distances measured by DEER are shown superimposed on a selected model for the complex in the upper panel. Representative DEER data (dots) and the fits to these data (solid red lines) from three of the label pairs are shown in the lower panel. In the lower panel, the insets show the average distances and distance distributions that were recovered from fitting the experimental data as described under “Experimental Procedures.” The data and analyses from the remaining 17 pairs are shown in supplemental Fig. S4, and the data from all pairs are summarized in Table 3.
TABLE 3.
Inter-protein DEER distances from 20 pairs of surface sites on cdb3 and AnkD34
The numbers in parentheses are the widths of the distance distributions recovered from fitting the experimental DEER data.
| Number | Sample |
Inter-protein DEER distance | Inter-subunit distance in cdb3a | |
|---|---|---|---|---|
| cdb3 | AnkD34 | |||
| Å | ||||
| 1 | 70 | 707 | 30.6 (1.7) | 76.2 |
| 2 | 70 | 722 | 27.1 (2.0) | 76.2 |
| 3 | 127 | 509 | 29.9 (0.7) | 70.0 |
| 4 | 130 | 491 | 37.4 (2.1) | 67.9 |
| 5 | 130 | 509 | 34.5 (1.3) | 67.9 |
| 6 | 130 | 524 | 24.7 (4.9) | 67.9 |
| 7 | 130 | 608 | 28.6 (0.7) | 67.9 |
| 8 | 130 | 656 | 28.2 (3.7) | 67.9 |
| 9 | 141 | 524 | 33.9 (5.1) | 46.5 |
| 10 | 148 | 608 | 38.1 (3.1) | 53.0 |
| 11 | 166 | 608 | 20.2 (1.3) | 67.8 |
| 12 | 166 | 623 | 30.3 (4.2) | 67.8 |
| 13 | 166 | 707 | 26.9 (3.5) | 67.8 |
| 14 | 166 | 722 | 31.9 (4.2) | 67.8 |
| 15 | 179 | 623 | 25.7 (3.9) | 59.6 |
| 16 | 254 | 600 | 19.6 (2.3) | 72.3 |
| 17 | 254 | 616 | 30.0 (2.2) | 72.3 |
| 18 | 254 | 623 | 24.8 (2.8) | 72.3 |
| 19 | 302 | 524 | 28.9 (4.3) | 53.8 |
| 20 | 302 | 623 | 32.1 (2.8) | 53.8 |
a Cβ-Cβ distance between two equivalent sites from each subunit obtained from the crystal structure of a cdb3 homodimer.
Molecular Models of the Complex Based on Long Range Distance Constraints
The unconstrained rigid docking calculations yielded 100,000 candidate complexes that span the full range of possible cdb3-ankyrin orientations, as shown in Fig. 9, upper panel. This result provides compelling evidence that no possible docking orientations were excluded in our modeling process. The first-pass distance filter reduced the solution set to 811 candidate structures, shown in Fig. 9, middle panel. When these candidate structures are superimposed on ankyrin, cdb3 dimers are localized in a radial band that extends from one side of the ankyrin molecule, across the convex surface, and to the opposite side. This filter yielded a 99% reduction in the solution set size, but as the figure shows, there is still considerable variability in this data set. The accessibility filter results exhibit a sharp increase in the model r.m.s.d. versus accessibility score when more than 30 best scoring candidates are considered. As seen in Fig. 9, lower panel, the set of top 30 candidates forms a tightly clustered group on the side of the top loop surface of ankyrin, which agrees well with the empirically defined binding interface of AnkD34 from the mobility and accessibility measurements of spin-labeled side chains. This collection of structures, which is shown in an expanded view in Fig. 10, upper panel, predicts an average buried surface area of 1103 Å2 and represents the best current solution set. This set of structures will constitute the starting point for more detailed structural refinement in future work where both the spin-labeled side chains will be explicitly modeled for interpretation of inter-probe distances and the local structures of cdb3 and AnkD34 at the binding interface will be allowed to relax.
FIGURE 10.

Color representation for the complex formed between cdb3 and AnkD34. In the upper panel, the α-carbon trace of AnkD34 (orange) has been held constant, and the 30 poses of the cdb3 dimer (green/blue) are positioned relative to AnkD34. In the lower panel, the pose of cdb3 that is closest to the mean of the 30 poses in the upper panel is shown docked with AnkD34. The view in the lower panel is rotated ∼90° from that shown in the upper panel to clearly see the positions of residues 160 and 254 on cdb3 and residues 598 and 631 on AnkD34, shown as silver balls at the binding interface. These residues showed high efficiency cross-linking with BMOE, as shown in Fig. 11. Also shown as blue balls are residues 133, 151, and 181 on cdb3 and residues 590, 623, and 656 on AnkD34. These residues showed exchange and dipolar couplings upon complex formation, as shown in Fig. 12. The β6-β7 hairpin loop is shown in red. Ankyrin repeats 13–16 and 23–24 have been cropped in the lower panel to allow expansion of repeats 18–20 at the binding interface.
Model Validation
The model of the complex in Fig. 10, lower panel, predicts residues that are in close proximity at or near the binding interface. As a check on the validity of the model, two types of experiments were carried out. First, single Cys mutants of cdb3 at residues 160 and 254 were prepared. These residues are at the interface but do not inhibit complex formation, as shown by the binding data in supplemental Fig. S2. Single Cys mutants of AnkD34 were made at residues 616, 619, and 623 on the back convex surface of repeat 19, at residue 613 on the short linker, and at residues 598 and 631 on the top convex surface. Residues 598 and 631, which are predicted by the model in Fig. 10, lower panel, to be at the binding interface, do not interfere with complex formation, as shown in supplemental Fig. S3. The model predicts that both residues 160 and 254 on cdb3 and residues 598 and 631 on AnkD34 are within 10 Å in the complex. It further predicts that residues 160 and 254 on cdb3 are greater than 20 Å from residues 613, 616, 619, and 623 on AnkD34. To test these predictions, the short cross-linking reagent BMOE was used to see which pairs of cysteines could be cross-linked and which could not. As shown by the SDS-PAGE gel in Fig. 11, residues 160 and 254 on cdb3 were efficiently cross-linked to residues 598 and 631 on AnkD34. However, no cross-links to residues 613, 616, 619, or 623 on AnkD34 were formed. The latter results not only agree with the model for the complex in Fig. 10, lower panel, but they also support the binding interface data for cdb3 and AnkD34 in Figs. 5 and 7.
FIGURE 11.

Chemical cross-linking of cysteine residues at single sites on cdb3 and at single sites on AnkD34. The models in Fig. 10 predict residues that are at the protein-protein interface of the complex. These predictions were tested using the short cross-linking reagent BMOE. The SDS-PAGE results confirm that residues 160 and 254 on cbd3 are in close proximity to residues 598 and 631 on AnkD34. However, residues 160 and 254 on cdb3 do not form cross-links with residue 613 in the linker region of AnkD34 or with residues 616, 619, or 623 on the back convex surface.
The second set of experiments involved measuring inter-protein dipolar coupling between spin label pairs, one on cdb3 and the other on AnkD34. This was accomplished by placing a spin-labeled side chain, one at a time, on cdb3 at residues 133, 151, and 181. All of these residues are near the binding interface based upon the model presented in Fig. 10, lower panel; introduction of a cysteine and spin labeling do not alter binding affinity (supplemental Fig. S2), and none show significant changes in EPR line shape upon complex formation. Similarly, spin-labeled side chains were incorporated in AnkD34 at residue 590 on the 18th ankyrin repeat, at residue 623 on the 19th ankyrin repeat, and at residue 656 on the 20th ankyrin repeat. Each of these residues are at structurally equivalent positions at the base of the outer helix of the respective ankyrin repeat motifs. The structural model for the complex presented in Fig. 10, lower panel, predicts that a spin-labeled side chain at residue 133 in cdb3 should be in close proximity (<10 Å) to a spin-labeled side chain at residue 590 in AnkD34, that a spin-labeled side chain at residue 151 in cdb3 should be in close proximity to a spin-labeled side chain at residue 623 in AnkD34, and that a spin-labeled side chain at residue 181 in cdb3 should be in close proximity to residue 656 in AnkD34. Fig. 12 shows that this is the case as strong exchange and dipolar coupling are observed for each of these three inter-protein pairs. The models are also compatible with the additional data in supplemental Fig. S5, which show weaker dipolar coupling between a spin-labeled side chain at residue 133 on cdb3 and one at residue 623 on AnkD34 but no significant dipolar coupling to one on residue 656 on AnkD34. Similarly, the models predict weaker dipolar coupling between a spin-labeled side chain at residue 151 on cdb3 and on residues 590 and 656 on AnkD34. Finally, the models predict very weak dipolar coupling between a spin-labeled side chain at residue 181 in cdb3 and at residues 623 and 590 on AnkD34. Collectively, the cross-linking data and the dipolar coupling data verify that the models of the complex are able to correctly predict these experimental observations, thereby adding confidence that the essential features of the models are correct.
FIGURE 12.
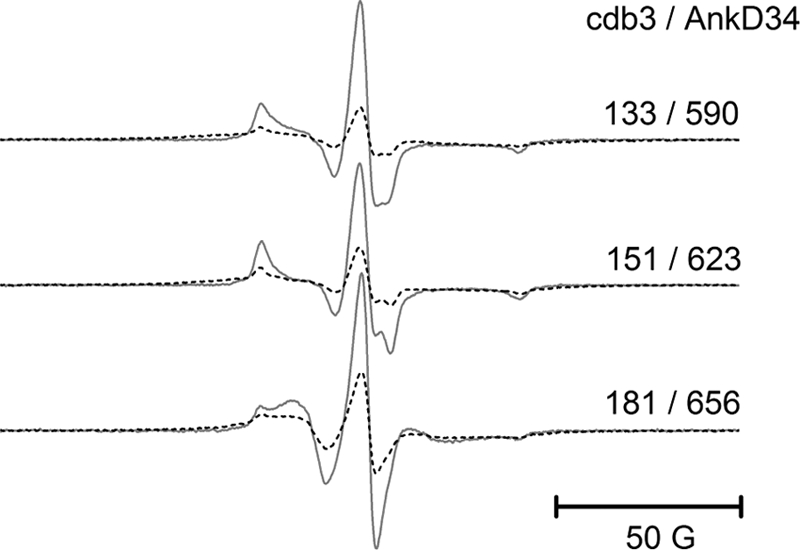
Exchange and dipolar coupling between spin-labeled sites on cdb3 and on AnkD34 that are predicted from the models in Fig. 10 to be at the binding interface. EPR spectra from the complexes (dashed lines) were superimposed on the sum of single spectra (solid lines) after baseline correction and normalization of the spectra. 50 G, 50 Gauss.
DISCUSSION
The ankyrin family of adaptor proteins is able to recognize and bind to the cytoplasmic domains of a wide range of intrinsic membrane proteins via their membrane binding domains (reviewed in Ref. 2) and thereby form a link between the cytosolic surface of the membrane and the underlying spectrin meshwork through binding of ankyrin to spectrin via its spectrin binding domain. Some of the ankyrin binding partners that have been reported include the Na+/K+-ATPase (35), sodium channel β subunits (36), the cardiac Na+/Ca2+ exchanger (37), glycoprotein GP85 (38), nervous system cell adhesion molecules including neurofascin, L1, neuronal cell adhesion molecule, neuron-glia cell adhesion molecule, and neuroglian (39), the InsP3 receptor (40), clathrin (41), and the ryanodine receptor (42) in addition to the cytoplasmic domain of the anion exchange protein in erythrocytes (43). Interestingly, no clear patterns of which surfaces on ankyrin are involved in these many binding interactions and what structural elements on their target binding proteins serve for binding recognition have emerged. In fact, extensive data in the literature indicate that different surfaces of the ankyrin membrane binding domain can interact with different proteins. To date, there have been relatively few structures determined at, or near, atomic resolution for many of the known complexes. Thus, it is of considerable interest to understand what the structures of representative members of these classes of complexes are and what drives the high affinity binding interactions that are essential to normal cellular function and organization.
The association of cdb3 with the AnkD34 region of the membrane binding domain of ankyrin-R has been examined in detail in previous biochemical and mutagenesis studies on cdb3 and on AnkD34. Studies on cdb3 have indicated that there are interactions of residues 1–75 in the N-terminal domain and residues 118–141, 155–160, and 174–193 in the peripheral domain of cdb3 with AnkD34 (31, 33, 44–47). The data in Figs. 4 and 5 and the binding data in supplemental Fig. S2 agree with these previous conclusions as specific residues in each of these regions after spin labeling have been observed to show changes in side chain dynamics, to show changes in solvent accessibility, and/or to result in diminished binding affinity when bound to AnkD34. A previous study by Michaely and Bennett (6) indicated that cdb3 binding to AnkD34 involves ankyrin repeats both in the 13–18 range and in the 19–24 range. Specifically, this study showed that cdb3 did not bind to ankyrin repeats 13–18 (the AnkD3 domain) nor repeats 19–24 alone (the AnkD4 domain), both of which formed stable folded structural domains, suggesting that the binding interface involved repeats that span the junction between the D3 and D4 domains. The data in Figs. 6 and 7 indicate that ankyrin repeats 18–20, which span this junction, serve as primary sites of contact between cdb3 and AnkD34. The models for the complex presented in Fig. 10 do not indicate any direct interactions between the peripheral domain of cdb3 and ankyrin repeats 22 and 23, although previous studies have shown that these repeats are important for high affinity binding (6, 44). In previous work, it has been shown that the N-terminal domain of cdb3, which is composed of residues 1–54, is dynamically disordered in solution with no observable interactions between this domain and the central folded domain of cdb3 (17). However, when spin label side chains are placed at sequential positions along the central portion of the N-terminal domain, a restricted motion signal is observed when cdb3 is bound to AnkD34 (data not shown). Given that previous studies have indicated a role for the N-terminal domain in the cdb3-AnkD34 interaction (31, 33, 45–47), these results suggest that the N-terminal domain may be involved in interactions with ankyrin repeats 22 and 23. This working hypothesis will be tested in subsequent studies.
Studies by Chang and Low (30) indicated that the β6-β7 hairpin loop on cdb3 was essential for binding to AnkD34. Specifically, replacing the entire loop composed of residues 175–185 with a diglycine bridge greatly reduced binding affinity to levels essentially the same as reported for the kidney isoform of cdb3. Replacement of the loop with the diglycine bridge did not result in any significant global disruptions of the structure of cdb3, as judged by pH-induced conformational changes, by binding to protein 4.1, and by binding of the N terminus to glycolytic enzymes. The role of this loop was later tested in an in vivo mouse model (32), where again results indicated a role for the β6-β7 hairpin loop in ankyrin binding.
Once the crystal structures for cdb3 (12) and for AnkD34 (5) became available, it was possible to construct docked structures for the complex using available rigid body docking software packages. Michaely and co-workers (5) used the FT-DOCK software (48) to construct a model of the complex where the biochemical and mutagenesis data from previous studies served as a guide for orienting the two proteins relative to each other. The model proposed showed extensive interactions of the peripheral domain of cdb3 including α-helices 2 and 3 with the ankyrin groove and bottom surfaces of ankyrin repeats 18–20 on the concave surface of AnkD34 and additional interactions between the β6-β7 hairpin loop with ankyrin repeats 22 and 23 (5). The tips of the linker surface on the membrane binding domain of ankyrin-R, which contains many charged residues, has recently been shown by Mohler and co-workers (49) to be involved in binding of the Na+/Ca2 exchanger to the membrane binding domain of ankyrin-B in cardiomyocytes.
Site-directed spin labeling, in conjunction with conventional continuous wave EPR and modern methods of pulsed dipolar EPR including DEER, has emerged as a powerful approach for determining the structures of complexes of proteins (e.g. Refs. 13–15). This methodology is applicable to determination of structural features of complexes of proteins in solution without the necessity of generating ordered single crystal samples of the complex as required by x-ray crystallography and is not limited by the size of the complex as NMR can be. Starting with each crystal structure of the two proteins, it is possible to strategically incorporate spin-labeled side chains at selected positions to define the interacting surfaces through changes in side chain mobility and solvent accessibility upon complex formation, as shown in Figs. 4–7. These data demonstrated that residues in and around α-helices 2 and 3 in the peripheral domain of cdb3 showed substantial changes in mobility and solvent accessibility upon complex formation, in agreement with data in the literature described in the preceding paragraphs. Also, spin labels at some positions in the β6-β7 hairpin loop showed spectral changes in agreement with previous work by site-directed fluorescence labeling, which showed modest changes in solvent accessibility when the complex with wt-AnkD34 was formed (34). However, spin-labeled side chains incorporated into the tips of the loop regions in ankyrin repeats 16–21 showed no changes in side chain mobility or in solvent accessibility upon complex formation with wt-cdb3 (data not shown). By placing spin-labeled side chains on all four surfaces of AnkD34 in the present work, it was shown that the top linker surface of AnkD34 showed spectral changes, as shown in Figs. 4–7, whereas the others did not. The models presented in Fig. 10 agree with the previous modeling work with regard to which ankyrin repeats in AnkD34 interact with the peripheral domain of cdb3. However, these models do not agree with the interacting surface being located in the ankyrin groove and bottom surfaces of AnkD34. Thus, the present work provides direct new experimental evidence for a previously uncharacterized surface of AnkD34 being involved in binding to cdb3. The model in Fig. 10, lower panel, does not indicate a direct interaction between the β6-β7 hairpin loop of cdb3 and AnkD34, although changes in spectroscopic observables suggest that this loop senses the binding interaction. None of the other 29 poses shown in Fig. 10, upper panel, indicate a direct interaction either. It is possible that this loop is necessary for structural rearrangements of residues on cdb3 that are at the protein-protein interface. It should be emphasized that although the data in Figs. 2 and 3 as well as those in supplemental Fig. S1 demonstrate that there are no significant global structural changes in either cdb3 or AnkD34 upon complex formation, it is likely that there are side chain rearrangements and possibly small changes in positioning of secondary structural elements of both proteins at the binding interface. Such localized changes could lead to additional interactions that are not revealed using rigid body docking as a first approximation for determining the major features of the structure of the complex. Thus, it will require additional refinement of the rigid body docked structures using molecular dynamics approaches to draw final conclusions about the exact role of the β6-β7 hairpin loop in the binding interaction. These additional refinements are currently underway.
Two cdb3 dimers may bind to ankyrin-R, one to AnkD2 and the other to AnkD34, either separately (6) or as a tetramer (5). The models in Fig. 10 showing how one cdb3 dimer binds to AnkD34 likely preclude the possibility that the second cdb3 dimer could simultaneously bind to AnkD2 and the first cdb3 dimer in the orientation consistent with the previously proposed tetramer structure (12) unless: 1) there is a significant structural rearrangement of the membrane binding domain as a result of binding two dimers of cdb3 or 2) the major binding interaction between cdb3 and the AnkD2 domain involves the extended N terminus of cdb3. Further studies on the structure of the complex formed between cdb3 and the AnkD2 domain or studies on binding two dimers to the full-length membrane binding domain will be required to discriminate between these two possibilities.
Supplementary Material
Acknowledgment
We greatly appreciate receiving the cDNA encoding AnkD34 from Dr. Peter Michaely at the University of Texas, Southwestern.
This work was supported, in whole or in part, by National Institutes of Health Grant P01 GM080513 (to A. H. B.).

The on-line version of this article (available at http://www.jbc.org) contains supplemental Figs. S1–S5 and Tables S1 and S2.
E. J. Hustedt, manuscript in preparation.
- AE1
- anion exchanger 1
- cdb3
- cytoplasmic domain of band 3
- AnkD34
- ankyrin repeats 13–24 of human erythrocyte ankyrin-R
- DEER
- double electron-electron resonance
- MTSSL
- 1-oxyl-2,2,5,5,-tetramethyl-Δ3-pyrroline-3-methyl methanethiosulfonate spin label
- NiEDDA
- nickel (II) ethylenediamine diacetic acid
- BMOE
- bis-maleimidoethane
- r.m.s.d.
- root mean square deviation.
REFERENCES
- 1. Delaunay J. (2002) Acta Haematol. 108, 210–218 [DOI] [PubMed] [Google Scholar]
- 2. Bennett V., Baines A. J. (2001) Physiol. Rev. 81, 1353–1392 [DOI] [PubMed] [Google Scholar]
- 3. Nilsson K. R., Jr., Bennett V. (2009) J. Cardiovasc. Pharmacol. 54, 106–115 [DOI] [PubMed] [Google Scholar]
- 4. Cunha S. R., Mohler P. J. (2011) Semin. Cell Dev. Biol. 22, 166–170 [DOI] [PMC free article] [PubMed] [Google Scholar]
- 5. Michaely P., Tomchick D. R., Machius M., Anderson R. G. (2002) EMBO J. 21, 6387–6396 [DOI] [PMC free article] [PubMed] [Google Scholar]
- 6. Michaely P., Bennett V. (1995) J. Biol. Chem. 270, 22050–22057 [DOI] [PubMed] [Google Scholar]
- 7. Che A., Morrison I. E., Pan R., Cherry R. J. (1997) Biochemistry 36, 9588–9595 [DOI] [PubMed] [Google Scholar]
- 8. Thevenin B. J., Low P. S. (1990) J. Biol. Chem. 265, 16166–16172 [PubMed] [Google Scholar]
- 9. Blackman S. M., Piston D. W., Beth A. H. (1998) Biophys. J. 75, 1117–1130 [DOI] [PMC free article] [PubMed] [Google Scholar]
- 10. Casey J. R., Reithmeier R. A. (1991) J. Biol. Chem. 266, 15726–15737 [PubMed] [Google Scholar]
- 11. Hanspal M., Golan D. E., Smockova Y., Yi S. J., Cho M. R., Liu S. C., Palek J. (1998) Blood 92, 329–338 [PubMed] [Google Scholar]
- 12. Zhang D., Kiyatkin A., Bolin J. T., Low P. S. (2000) Blood 96, 2925–2933 [PubMed] [Google Scholar]
- 13. Hilger D., Polyhach Y., Padan E., Jung H., Jeschke G. (2007) Biophys. J. 93, 3675–3683 [DOI] [PMC free article] [PubMed] [Google Scholar]
- 14. Park S. Y., Borbat P. P., Gonzalez-Bonet G., Bhatnagar J., Pollard A. M., Freed J. H., Bilwes A. M., Crane B. R. (2006) Nat. Struct. Mol. Biol. 13, 400–407 [DOI] [PubMed] [Google Scholar]
- 15. Bhatnagar J., Borbat P. P., Pollard A. M., Bilwes A. M., Freed J. H., Crane B. R. (2010) Biochemistry 49, 3824–3841 [DOI] [PMC free article] [PubMed] [Google Scholar]
- 16. Kaufmann K. W., Lemmon G. H., Deluca S. L., Sheehan J. H., Meiler J. (2010) Biochemistry 49, 2987–2998 [DOI] [PMC free article] [PubMed] [Google Scholar]
- 17. Zhou Z., DeSensi S. C., Stein R. A., Brandon S., Dixit M., McArdle E. J., Warren E. M., Kroh H. K., Song L., Cobb C. E., Hustedt E. J., Beth A. H. (2005) Biochemistry 44, 15115–15128 [DOI] [PubMed] [Google Scholar]
- 18. Zhou Z., DeSensi S. C., Stein R. A., Brandon S., Song L., Cobb C. E., Hustedt E. J., Beth A. H. (2007) Biochemistry 46, 10248–10257 [DOI] [PubMed] [Google Scholar]
- 19. Hustedt E. J., Stein R. A., Sethaphong L., Brandon S., Zhou Z., Desensi S. C. (2006) Biophys. J. 90, 340–356 [DOI] [PMC free article] [PubMed] [Google Scholar]
- 20. Rabenstein M. D., Shin Y. K. (1995) Proc. Natl. Acad. Sci. U.S.A. 92, 8239–8243 [DOI] [PMC free article] [PubMed] [Google Scholar]
- 21. Chiang Y. W., Borbat P. P., Freed J. H. (2005) J. Magn. Reson. 172, 279–295 [DOI] [PubMed] [Google Scholar]
- 22. Gray J. J., Moughon S., Wang C., Schueler-Furman O., Kuhlman B., Rohl C. A., Baker D. (2003) J. Mol. Biol. 331, 281–299 [DOI] [PubMed] [Google Scholar]
- 23. Sanner M. F., Olson A. J., Spehner J. C. (1996) Biopolymers 38, 305–320 [DOI] [PubMed] [Google Scholar]
- 24. Chothia C. (1976) J. Mol. Biol. 105, 1–12 [DOI] [PubMed] [Google Scholar]
- 25. Borbat P. P., McHaourab H. S., Freed J. H. (2002) J. Am. Chem. Soc. 124, 5304–5314 [DOI] [PubMed] [Google Scholar]
- 26. Fajer M. I., Li H., Yang W., Fajer P. G. (2007) J. Am. Chem. Soc. 129, 13840–13846 [DOI] [PubMed] [Google Scholar]
- 27. Herrick D. Z., Kuo W., Huang H., Schwieters C. D., Ellena J. F., Cafiso D. S. (2009) J. Mol. Biol. 390, 913–923 [DOI] [PMC free article] [PubMed] [Google Scholar]
- 28. Sale K., Song L.., Liu Y. S., Perozo E., Fajer P. (2005) J. Am. Chem. Soc. 127, 9334–9335 [DOI] [PubMed] [Google Scholar]
- 29. Polyhach Y., Bordignon E., Jeschke G. (2011) Phys. Chem. Chem. Phys. 13, 2356–2366 [DOI] [PubMed] [Google Scholar]
- 30. Chang S. H., Low P. S. (2003) J. Biol. Chem. 278, 6879–6884 [DOI] [PubMed] [Google Scholar]
- 31. Davis L., Lux S. E., Bennett V. (1989) J. Biol. Chem. 264, 9665–9672 [PubMed] [Google Scholar]
- 32. Stefanovic M., Markham N. O., Parry E. M., Garrett-Beal L. J., Cline A. P., Gallagher P. G., Low P. S., Bodine D. M. (2007) Proc. Natl. Acad. Sci. U.S.A. 104, 13972–13977 [DOI] [PMC free article] [PubMed] [Google Scholar]
- 33. Willardson B. M., Thevenin B. J., Harrison M. L., Kuster W. M., Benson M. D., Low P. S. (1989) J. Biol. Chem. 264, 15893–15899 [PubMed] [Google Scholar]
- 34. Zhou Z. (2006) EPR and Fluorescence Studies on Erythrocyte Membrane Skeletal Proteins: cdb3 and Ankyrin. Ph.D. thesis, Vanderbilt University [Google Scholar]
- 35. Nelson W. J., Veshnock P. J. (1987) Nature 328, 533–536 [DOI] [PubMed] [Google Scholar]
- 36. Malhotra J. D., Kazen-Gillespie K., Hortsch M., Isom L. L. (2000) J. Biol. Chem. 275, 11383–11388 [DOI] [PubMed] [Google Scholar]
- 37. Li Z. P., Burke E. P., Frank J. S., Bennett V., Philipson K. D. (1993) J. Biol. Chem. 268, 11489–11491 [PubMed] [Google Scholar]
- 38. Kalomiris E. L., Bourguignon L. Y. (1988) J. Cell Biol. 106, 319–327 [DOI] [PMC free article] [PubMed] [Google Scholar]
- 39. Davis J. Q., Bennett V. (1994) J. Biol. Chem. 269, 27163–27166 [PubMed] [Google Scholar]
- 40. Bourguignon L. Y., Jin H., Iida N., Brandt N. R., Zhang S. H. (1993) J. Biol. Chem. 268, 7290–7297 [PubMed] [Google Scholar]
- 41. Michaely P., Kamal A., Anderson R. G., Bennett V. (1999) J. Biol. Chem. 274, 35908–35913 [DOI] [PubMed] [Google Scholar]
- 42. Bourguignon L. Y., Chu A., Jin H., Brandt N. R. (1995) J. Biol. Chem. 270, 17917–17922 [DOI] [PubMed] [Google Scholar]
- 43. Michaely P., Bennett V. (1993) J. Biol. Chem. 268, 22703–22709 [PubMed] [Google Scholar]
- 44. Davis L. H., Otto E., Bennett V. (1991) J. Biol. Chem. 266, 11163–11169 [PubMed] [Google Scholar]
- 45. Ding Y., Casey J. R., Kopito R. R. (1994) J. Biol. Chem. 269, 32201–32208 [PubMed] [Google Scholar]
- 46. Ding Y., Kobayashi S., Kopito R. (1996) J. Biol. Chem. 271, 22494–22498 [DOI] [PubMed] [Google Scholar]
- 47. Wang C. C., Moriyama R., Lombardo C. R., Low P. S. (1995) J. Biol. Chem. 270, 17892–17897 [DOI] [PubMed] [Google Scholar]
- 48. Gabb H. A., Jackson R. M., Sternberg M. J. (1997) J. Mol. Biol. 272, 106–120 [DOI] [PubMed] [Google Scholar]
- 49. Cunha S. R., Bhasin N., Mohler P. J. (2007) J. Biol. Chem. 282, 4875–4883 [DOI] [PubMed] [Google Scholar]
Associated Data
This section collects any data citations, data availability statements, or supplementary materials included in this article.