

Abstract
HMGCS2 (hydroxymethylglutaryl CoA synthase 2), the gene that regulates ketone body production, is barely expressed in cultured cell lines. In this study, we restored HMGCS2 expression and activity in HepG2 cells, thus showing that the wild type enzyme can induce fatty acid β-oxidation (FAO) and ketogenesis, whereas a catalytically inactive mutant C166A did not generate either process. Peroxisome proliferator-activated receptor (PPAR) α expression also induces fatty acid β-oxidation and endogenous HMGCS2 expression. Interestingly, PPARα-mediated induction was abolished when HMGCS2 expression was down-regulated by RNAi. These results indicate that HMGCS2 expression is both sufficient and necessary to the control of fatty acid oxidation in these cells. Next, we examined the expression pattern of several PPARα target genes in this now “ketogenic” HepG2 cell line. FGF21 (fibroblast growth factor 21) expression was specifically induced by HMGCS2 activity or by the inclusion of the oxidized form of ketone bodies (acetoacetate) in the culture medium. This effect was blunted by SirT1 (sirtuin 1) RNAi, so we propose a SirT1-dependent mechanism for FGF21 induction by acetoacetate. These data suggest a novel feed-forward mechanism by which HMGCS2 could regulate adaptive metabolic responses during fasting. This mechanism could be physiologically relevant, because fasting-mediated induction of liver FGF21 was dependent on SirT1 activity in vivo.
Keywords: Fatty Acid Oxidation, Ketone Bodies, Liver, Mitochondrial Metabolism, NAD, Nuclear Receptors, PPAR, SIRT, FGF21, HMGCS2
Introduction
The liver plays a central role in the adaptive response to fasting. The plasma hormone profile in this situation, low insulin and high glucagon, induces the release of large amounts of fatty acids from the adipose tissue to be used by peripheral tissues to spare glucose consumption. Therefore, the liver of a starved animal actively oxidizes fatty acid, which provides the energy necessary to sustain gluconeogenesis. It also supplies the acetyl-CoA needed for active ketone body synthesis, which replaces glucose as the energy substrate for the brain and other tissues (1).
Two enzymes determine the metabolic fate of fatty acids in the liver of starved animals: carnitine palmitoyltransferase-1 (CPT1) A (EC 2.3.1.21) and hydroxymethylglutaryl CoA synthase 2 (HMGCS2) (EC 4.1.3.5). CPT1A encodes a malonyl-CoA-sensitive protein that regulates mitochondrial long chain fatty acid oxidation (1), whereas HMGCS2 encodes a mitochondrial protein that controls the 3-hydroxy-3-methylglutaryl-CoA (HMG-CoA)5 cycle, by which acetoacetate, β-hydroxybutyrate, and NAD+ are generated (2). The expression of both genes is regulated by peroxisome proliferator-activated receptor α (PPARα) (3–6), a fatty acid-activated nuclear receptor that regulates metabolic changes in the liver associated with starvation (7). Another gene directly regulated by PPARα in liver is FGF21 (fibroblast growth factor 21), a signaling molecule induced in the ketotic state (8, 9).
Consistently, during starvation, PPARα null mice show severe hypoglycemia and hypoketonemia (7). The hypoglycemia is due to a reduced capacity for hepatic gluconeogenesis secondary to a 70% lower rate of fatty acid oxidation (10). However, the decrease in fatty acid oxidation is not due to inappropriate expression of hepatic CPT1A, which is similar in both genotypes, but to impaired HMGCS2 expression in the PPARα null mouse liver (10).
It has been proposed that HMGCS2 interacts with PPARα and acts as a co-activator to up-regulate transcription from the PPRE of its own gene (11, 12). The HMGCS2-PPARα interaction is enhanced by HMGCS2 palmitoylation (12), underlying a putative mechanism by which PPARα is activated by one of its target gene products when fatty acids are available. However, this is a specific mechanism for HMGCS2, because other PPARα target genes are not co-activated by HMGCS2 expression (11).
In addition to this network of genes regulated by PPARα activation, another enzyme may contribute to the metabolic adaptation to fasting: SirT1 (sirtuin 1). This NAD+-dependent protein deacetylase is a general regulator of energy homeostasis in response to nutrient availability (13). Hepatic deletion of SIRT1 alters PPARα signaling, especially the induction of FGF21 mRNA by PPARα ligands (14).
A common feature in hepatoma cell lines is the low capacity for long chain fatty acid oxidation and ketone body production, which correlates with low expression of HMGCS2 (15). Overexpression of PPARα in HepG2 cell can restore the expression of this and other genes, and it induces fatty acid β-oxidation (6). Therefore, we examined whether PPARα-mediated expression of HMGCS2 acts as co-activator of this process.
In this paper we show that, in HepG2 cells, wild type human HMGCS2 expression induces both fatty acid oxidation and ketogenesis. Using shRNAs, we also show that HMGCS2 expression is necessary for PPARα-mediated induction of fatty acid oxidation. In addition, we show that HMGCS2 expression stimulates FGF21 expression. We also report that FGF21 is induced by starvation by a mechanism involving SirT1 activity. Finally, we show that these events are dependent on HMGCS2 activity, because a catalytic dead mutant (C166A) failed to induce either fatty acid β-oxidation or FGF21 expression, whereas acetoacetate (an oxidized form of ketone bodies) can stimulate FGF21 mRNA induction by a SirT1-dependent mechanism. We propose a feed-forward model in which ketogenesis activates a SirT1-mediated response and long chain fatty acid oxidation.
EXPERIMENTAL PROCEDURES
Plasmids
pcDNA3-HMGCS2-wt was cloned by EcoRI digestion of human HMGCS2 cDNA (16) and ligated into pcDNA3. pcDNA3-HMGCS2-C166A mutant plasmid was generated from pcDNA3-HMGCS2-wt by site-directed mutagenesis using QIAquick mutagenesis kit (Qiagen) with the following oligonucleotides: forward, 5′-gataccaccaatgccgcctacggtggtactgcctcc-3′, and reverse, 5′-ggaggcagtaccaccgtaggcggcattggtggtatc-3′, following the manufacturer's instructions. For GST pulldowns, pGEX-4T-human PPARα (17) was used.
Animal Experiments
SirT1 liver-specific knock-out (SirT1-LKO) mice were a gift from Dr. L. Guarente (18). SirT1-LKO mice were generated by crossing a mice with a SirT1 allele containing a floxed exon 4 (19) with Cre-expressing mice driven by the liver-specific albumin promoter on the C57BL/6 background. All of the mice were housed in cages on a 12 h light:12 h dark cycle at controlled temperature (25 ± 1 °C).
Four-month-old SirT1 LKO mice and their age-matched littermate Lox controls (Cre−/−, SirT1flox/flox) were either fed ad libitum a standard laboratory chow diet or subjected to a 15-h overnight fast. All of the animals were sacrificed at Zeitgeber time 3 (i.e. 3 h after the onset of the 12-h light span). The livers were extracted and immediately snap frozen in liquid nitrogen and stored at −80 °C until analysis. Blood was collected by cardiac puncture and kept on ice until centrifugation (1500 × g, 15 min at 4 °C). The serum obtained was either used immediately for assays or stored at −80 °C until analysis. All of the experimental protocols with mice were performed with approval of the animal ethics committee of the University of Barcelona (Barcelona, Spain).
Cell Culture
The human hepatocellular carcinoma cells HepG2 were cultured at 37 °C in a humidified atmosphere containing 5% CO2 in Eagle's minimum essential medium supplemented with 100 units/ml penicillin G, 100 μg/ml streptomycin, and heat-inactivated 10% fetal bovine serum. HEK293 cell line was cultured in DMEM supplemented with antibiotics and 10% fetal bovine serum. All of the cell culture products were obtained from Invitrogen. Acetoacetate and 3-hydroxybutyrate were obtained from Sigma-Aldrich.
Adenoviruses Generation
Recombinant adenoviruses were constructed as described previously (20). Briefly, cDNAs from WT and mutant forms of HMGCS2 were obtained from pcDNA3-HMGCS2-wt and pcDNA3-HMGCS2-C166A, respectively, by KpnI and XhoI digestion and cloned into pAdTrack-CMV shuttle vector. The resultant plasmid was linearized by digesting with PmeI and co-transformed into Escherichia coli BJ5183 cells with pAdEasy-1 plasmid, which contains the adenoviral backbone. This E. coli strains allows homologous recombination between both plasmids, giving rise to recombinant adenoviruses. When their identity had been confirmed by restriction endonuclease analyses, these viruses were transfected into the adenovirus packaging cell line HEK293. Recombinant adenoviruses were amplified in these cells, purified by CsCl gradient and titrated using the Adeno-X rapid titer kit (BD Biosciences). As a negative control, we generated adenoviruses expressing only GFP. The parent plasmids were a gift from B. Vogelstein (The John Hopkins Oncology Center).
Adenoviral Infection
In general, HepG2 cells were seeded 24 h before infection. The cells were infected with minimum essential medium supplemented with 10% FBS at a multiplicity of infection of 40 for 48 h.
HepG2 shRNA Stable Cell Lines
Several retroviral-based plasmids containing a shRNA to human HMGCS2 were purchased from Origene (Rockville, MD). Scrambled shRNA was used as a negative control. The sequence of the human HMGCS2-specific 29-mer shRNA with highest efficacy reported here was CGTCTGTTGACTCCAGTGAAGCGCATTCT. Stable clones were generated using a PhoenixTM retroviral expression system (Orbigen, San Diego, CA). Briefly, Phoenix cells were seeded at 3 × 10⁶ cells/100-mm plate and transfected with 10 μg of shRNA plasmids using Lipofectamine LTX (Invitrogen) according to the manufacturer's recommendations 18 h later. 48 h after transfection, retrovirus in the supernatant were harvested and filtered with a 0.45-μm low binding protein filter and added to HepG2 cells with 4 μg/ml Polybrene (Sigma Aldrich). HepG2 cells were placed under selection with 1.0 μg/ml puromycin (Sigma-Aldrich) until clones were formed. The clones were recovered with glass cylinders (Sigma-Aldrich) and split when they reached confluence. Successful knockdown of specific gene products was confirmed by Western blot.
siRNA Transfection
HepG2 cells were seeded 24 h before transfection at a density of 4 × 10⁵ cells/well in 6-well plates. Specific siGENOME SMARTpool against human HMGCS2 (M-010179-01) and SIRT1 (T2004-01) were purchased from Thermo Scientific Dharmacon. siGENOME nontargeting siRNA 1 (D-001210-01-05) was used as a control. A concentration of 10 nm was transfected with Dharmafect 4 (Thermo Scientific Dharmacon) according to the manufacturer's instructions. The cells were harvested 72 h post-transfection, and successful knockdown was assessed Western blot analysis.
Mitochondria Isolation
To assay HMGCS2 activity, mitochondria were obtained from 48-h infected HepG2 cells with indicated adenoviruses. The cells were harvested in cold PBS and centrifuged (500 × g for 10 min). The pellet obtained was resuspended in 0.4 ml of homogenization buffer (150 mm KCl, 5 mm Tris-HCl, pH 7.2) and lysed by 10 cycles with each of the pestles of a mechanical Douncer homogenizer. The supernatant of a first centrifugation (250 × g for 10 min) was submitted to a second centrifugation (16,000 × g for 30 min). The resulting pellet was resuspended in three volumes of resuspension buffer (0.4 mm DTT, 1.5% Triton X-100, 100 mm Tris-HCl, pH 8) and desalted through a Bio-Spin chromatography columns (Bio-Rad). Mitochondrial protein was quantified following Bradford and stored at −80 °C.
Enzymatic Activity Assay
HMGCS activity determination was carried out as described previously (21). HMGCS activity was measured as the incorporation of [1-14C]acetyl-CoA into HMG-CoA at 30 °C in 10 min. The reaction was initiated by adding mitochondrial protein preparation to a reaction mixture (100 mm Tris-HCl, 1 mm EDTA, 20 μm acetoacetyl-CoA, 200 μm [14C]acetyl-CoA 12,000 cpm/nmol (ITISA Biomedica)) in a final volume of 200 μl. After 10 min, the enzymatic reaction was stopped by adding 300 μl of 6 n hydrochloric acid and was incubated for 2 h at 100 °C. Radiolabeled HMG-CoA was recovered from the vials, diluted in Ecolite scintillation liquid (ICN) and counted in an automatic analyzer. HMGCS activity is expressed as nmol of produced HMG-CoA per minute.
Palmitate Oxidation
Palmitate oxidation was performed in MW24 plates as described previously (22). Briefly, the cells were incubated with 0.5 ml/well of forced medium (glucose and pyruvate-deprived DMEM containing 0.5 mm palmitate, 0.1 mm fatty acid-free BSA, 3 mm glucose, and 0.2 mm carnitine) for 16 h before the assay. Then the cells were incubated for 2 h in forced medium with radiolabeled palmitate at a final concentration of 0.5 mm (2.8 μCi/μmol [1-14C]palmitate; Amersham Biosciences). The reaction was stopped with 0.7 mm perchloric acid, and radiolabeled released 14CO2 was recovered for 1 h in Whatman paper soaked with 25 μl of β-phenylethylamine (Sigma-Aldrich). Then the trapped 14CO2 in the Whatman paper was quantified in a scintillation analyzer. To measure the acid-soluble products, we followed the assay as described previously (23). Briefly, the cells were scrapped, neutralized with 0.5 n KOH, and incubated at 60 °C for 30 min. The medium was then acidified by the addition of 150 mm sodium acetate and 0.3 n H2SO4. The cells were centrifuged at 1,000 × g for 7 min and extracted with 1:1 chloroform/methanol. The aqueous phase was counted in a scintillation analyzer (acid-soluble product). Total palmitate oxidation was calculated as the sum of CO2 trapped plus acid-soluble products recovered.
Ketone Body Determination
The concentration of total ketone bodies in the medium of infected HepG2 cells was determined using Autokit Total Ketone Bodies (Wako, Germany), according to the manufacturer's instructions. When the sample (medium from HepG2) is mixed with R1 (20 mm phosphate buffer, pH 7, 4.27 mm thio-NAD+) and R2 (0.2 m Good's buffer, pH 9.0, 3200 IU/ml 3-hydroxybutyrate dehydrogenase, and 2.65 mm NADH), AcAc, and 3-HB present in the medium are converted to 3-HB and AcAc, respectively, in the presence of 3-hydroxybutyrate dehydrogenase, NADH, and thio-NAD. Then the 3-HB and AcAc produced in the enzymatic reactions are reverted to AcAc and 3-HB, again. During these cyclic reactions, NAD+ and thio-NADH are produced. The concentration of total ketone bodies in each sample is determined by measuring the rate of thio-NADH production. Thio-NADH is measured spectrophotometrically at 405 nm using a calibration curve previously performed by plotting the absorbance corresponding to 3-HB standards of known concentrations.
Western Blot Analysis
Whole protein cell extracts were obtained from infected HepG2 cells or liver of mice. Briefly, the cells were homogenized in Nonidet P-40 lysis buffer (150 mm NaCl, 50 mm Tris-HCl, 1% Nonidet P-40) supplemented with a mixture of protease inhibitors (Sigma Aldrich) and 0.1 mm phenylmethylsulfonyl fluoride (Sigma Aldrich). Proteins from mouse liver were obtained by homogenization in radioimmune precipitation assay buffer (1% Triton X-100, 150 mm NaCl, 5 mm EDTA, 10 mm Tris, pH 7.0) containing protease inhibitor mixture (Sigma Aldrich). Protein extracts were subjected to centrifugation at 16,000 × g for 15 min. The supernatant (whole protein cell extract) was quantified following Bradford and stored at −80 °C. Whole protein cell extracts were loaded in a 8% SDS-PAGE gel and then transferred to Immobilon-P membranes (Millipore, Bedford, MA) and probed with different antibodies. The antibodies used were: human HMGCS2 polyclonal antibody obtained as described previously (24) or mHMGCS from Santa Cruz Biotechnologies (1:500, catalog number sc-33828); SIRT1 antibody from Upstate Biotechnologies (1:1000, catalog number 07-131) or from Santa Cruz Biotechnologies (1:500, catalog number sc-15404); PPARα antibody from Santa Cruz Biotechnologies (1:1000, catalog number sc-1985); RXRα antibody from Santa Cruz Biotechnologies (1:500, catalog number: sc-553); actin antibody from Sigma-Aldrich (1:1000, catalog number A2066); and tubulin antibody from Calbiochem (1:1000, catalog number: CP06). Detection was carried out using an ECL kit Chemiluminiscence detection kit for HRP (Biological Industries).
Immunocytochemistry
HepG2 were seeded onto coverslips (6 × 10⁵ cell/p60) 24 h before infection. HepG2 cells were infected with adenovirus, as indicated in the figure legends, and after 48 h of infection they were fixed with 4% paraformaldehyde. Antibody staining on fixed cells was done using a standard protocol. The cells were permeabilized using 0.1% Triton X-100 (Sigma Aldrich). The primary antibodies used were goat anti-PPARα (1:1000, Santa Cruz Biotechnologies, sc-1985) and rabbit anti-HMGCS2 (1:100, Santa Cruz Biotechnologies, sc-33828). Secondary antibodies were obtained from Invitrogen: Alexa Fluor® 488 donkey anti-goat IgG (H+L) *2 mg/ml (1:1000), Alexa Fluor® 647 chicken anti-rabbit (H+L) *2 mg/ml (1:500). DAPI (6.25 μg/ml; Sigma) was used to label DNA. Fluorochrome-labeled samples were analyzed and captured using a Leica SP2 confocal microscope. Final artwork was processed using ImageJ software.
Pulldown Assay
GST and GST-PPARα fusion proteins were produced in E. coli and purified on glutathione-Sepharose beads (Amersham Biosciences), as described previously (17). The amount and integrity of GST was checked by SDS-PAGE and Coomassie Blue staining. 250 μg of whole cell protein extracts from HepG2-infected cells were incubated in the presence of equivalent amounts of immobilized GST or GST-PPARα (12.5 μg) in 1 ml of binding buffer NETN (20 mm Tris, pH 8, 100 mm NaCl, 1 mm EDTA, 0.5% Nonidet P-40), supplemented with 0.5% nonfat milk, protease inhibitor mixture (Sigma), and 1 mm DTT for 4 h at 4 °C with agitation. The samples were then centrifuged for 1 min at 500 × g, and the resin was washed twice in NETN at room temperature. After that the samples were boiled, mixed with 2× Laemmli buffer and resolved by SDS-PAGE in a 8% polyacrylamide gel. Bound proteins were detected by immunoblot using anti-HMGCS2 (24) or RXRα antibody from Santa Cruz Biotechnologies (1:500, catalog number sc-553).
Real Time RNA Analysis
Total RNA was extracted from cells or liver by Tri-Reagent (Ambion) and was further treated with DNase I (Ambion). For real time PCR analysis, cDNA was synthesized from total RNA by murine leukemia virus reverse transcriptase (Invitrogen) with random hexamers (Roche Diagnostics). cDNA was subjected to PCR real time analysis using TaqMan universal PCR master mix (Invitrogen catalog number 11743) and the specific gene expression primer pair TaqMan probes from Applied Biosystems (for HepG2, human gene probes were used: FGF21, Hs00173927_m1; CPT1A, Hs00157079_m1; HMGCS2, Hs00985427_m1; cytosolic phosphoenolpyruvate carboxykinase 1, Hs00159918_m1; CPT2, Hs00988962_m1; and PPARα, Hs00231882_m1; for mice experiments, mouse probes were used: HMGCS2, Mm00550050_m1; FGF21, Mm00840165_g1; CPT1A, Mm00550438_m1; and SIRT1, Mm00490758_m1). Relative mRNA abundance was obtained by normalizing to 18 S levels (Applied Biosystems).
Measurement of Serum FGF21
Mouse FGF21 ELISA kit was obtained from Millipore (catalog number EZRMFGF21-26K) for the quantification of FGF21 in mice serum. The assay was conducted according to the manufacturer's protocol. Briefly, a calibration curve was constructed by plotting the difference of absorbance values at 450 and 590 nm versus the FGF21 concentrations of the calibrators, and concentrations of unknown samples (performed in duplicate) were determined by using this calibration curve.
Statistical Analysis
The data are expressed as the means ± standard deviation. The significance of differences was determined using SPSS statistical software (SPSS Worldwide Headquarters, Chicago, IL). p < 0.05 was considered statistically significant.
RESULTS
Human HMGCS2 Expression Induces Fatty Acid Oxidation and Ketogenesis in HepG2 Cell Line
Wild type or a mutant form of HMGCS2 enzymes and human PPARα were expressed in HepG2 cell line by using adenoviral vector systems. The HMGCS2 C166A mutant was predicted as a dead enzyme because an equivalent cysteine residue 129 has been characterized as the catalytic site in the homologous HMGCS1, the cytosolic enzyme involved in cholesterol synthesis (25, 26). Fig. 1 shows recombinant expression of human HMGCS2 in terms of activity (Fig. 1A) and protein (Fig. 1C, bottom panels) levels. The HMGCS2 enzymatic activity (approximately 0.5 milliunit/mg) that was achieved from adenoviruses-mediated expression was similar to that observed in liver mitochondria from feed mouse (data not shown and Ref. 27). Fig. 1A also shows that the C166A mutant (AdHMGCS2 MUT) expresses an inactive HMGCS2 enzyme. Fig. 1B shows that expression of HMGCS2 was sufficient to induce ketone body production by the HepG2 cells, and as expected, the expression of the dead enzyme lacks this ability. Interestingly, Fig. 1C shows that recombinant expression of human HMGCS2 was also sufficient to induce fatty acid oxidation. Fig. 1C also shows that the induction of β-oxidation mediated by HMGCS2 expression is similar to the induction mediated by PPARα expression that, as expected (6), also induces HMGCS2 protein levels (Fig. 1C, bottom panels) and HMGCS2, CPT1a, and FGF21 mRNA levels (Table 1). These data suggest that expression of HMGCS2 in HepG2 cell line is sufficient to restore the HMG-CoA cycle (28) and that activation of ketogenesis from acetyl-CoA in turn activates fatty acid β-oxidation.
FIGURE 1.

Effect of wild type or mutant HMGCS2 expression on activity, ketogenesis, and fatty acid β-oxidation. HepG2 cells were infected with adenovirus control (AdGFP) or expressing wild type (AdHMGCS2 WT) or C166A mutant (AdHMGCS2 MUT) human HMGCS2 for 48 h. A, enzymatic activity was measured in dialyzed mitochondria preparation. B, total ketone bodies were determined in the medium. C, total [14C]palmitate oxidation was measured in HepG2 cells infected with adenoviruses expressing human HMGCS2 variants or human PPARα (AdPPARα). The average of three independent experiments is shown. The bottom panel shows a representative Western blot of recombinant PPARα and recombinant (left) or endogenous (right) HMGCS2. 10 μg of whole cell extract were loaded to show recombinant HMGCS2 expression, and 70 μg were loaded to show endogenous HMGCS2. *, p < 0.05, ***, p < 0.001.
TABLE 1.
mRNA induction of different PPARα target genes
HepG2 cells were infected with adenovirus expressing human PPARα or human wild type or C166A mutant of HMGCS2. The mRNA levels were determined by real time PCR. The data represent the fold of induction of the specific mRNA after adenovirus infection of at least three independent experiments. PCK1, cytosolic phosphoenolpyruvate carboxykinase; ND, not determined.
| AdPPARα | AdHMGCS2 WT | AdHMGCS2 MUT | |
|---|---|---|---|
| HMGCS2 | 45.0 ± 15.7a | ND | ND |
| CPT1A | 2.74 ± 0.9b | 1.27 ± 0.7 | 0.86 ± 0.2 |
| CPT2 | 7.35 ± 5.1 | ND | ND |
| PCK1 | 5.95 ± 3.3b | ND | ND |
| FGF21 | 15.4 ± 5.8b | 3.3 ± 1.03b | 1.0 ± 0.3 |
| PPARα | ND | 1.41 ± 0.2 | 1.61 ± 0.3 |
a p < 0.001.
b p < 0.05.
Human HMGCS2 Expression Is Necessary for PPARα-mediated Induction of Fatty Acid Oxidation
PPARα expression in HepG2 cells induces both HMGCS2 and mitochondrial fatty acid oxidation (6). Therefore, we hypothesized that active ketogenesis could be necessary for PPARα-mediated induction of fatty acid β-oxidation. Fig. 2A shows that a specific shRNA abrogated HMGCS2 induction mediated by PPARα. Fig. 2B shows that β-oxidation induction mediated by PPARα was blunted by down-regulation of HMGCS2 expression. These data suggest that PPARα induces fatty acid oxidation but importantly that the expression of the ketogenic key enzyme HMGCS2 is needed for the induction.
FIGURE 2.

Effect of HMGCS2 expression on PPARα-mediated induction of fatty acid β-oxidation. HepG2 stable cell lines expressing a shRNA control (scrambled shRNA) or a shRNA specific for HMGCS2 were infected with human PPARα expressing adenovirus (AdPPARα). A, representative Western blot analysis of recombinant PPARα, endogenous HMGCS2, and actins as loading control. 70 μg of whole cell extract were loaded. B, total [14C]palmitate oxidation was measured in HepG2 cells expressing (scrambled shRNA) or not expressing (HMGCS2 shRNA) HMGCS2. The results are expressed in PPARα fold induction versus GFP infection. The average of three independent experiments is shown. ***, p < 0.001.
HMGCS2 Regulates FGF21 Expression in HepG2 Cell Line
The effect of HMGCS2 on PPARα-mediated stimulation of fatty acid oxidation could be mediated by direct HMGCS2 co-activation (11, 12) or a metabolic effect driven by stimulation of fatty acid degradation (Fig. 2). Therefore, we analyzed the effect of HMGCS2 expression on PPARα target genes. Fig. 3A shows that overexpression of HMGCS2 induced FGF21 expression and that catalytic activity of the enzyme was needed for this mRNA induction. Fig. 3B shows that knockdown of HMGCS2 down-regulated FGF21 mRNA levels in the absence (Fig. 3B, right panel) or presence (Fig. 3B, left panel) of PPARα. This effect was specific for FGF21, because the mRNA levels of other PPARα target genes were not affected by HMGCS2 expression (Table 1).
FIGURE 3.
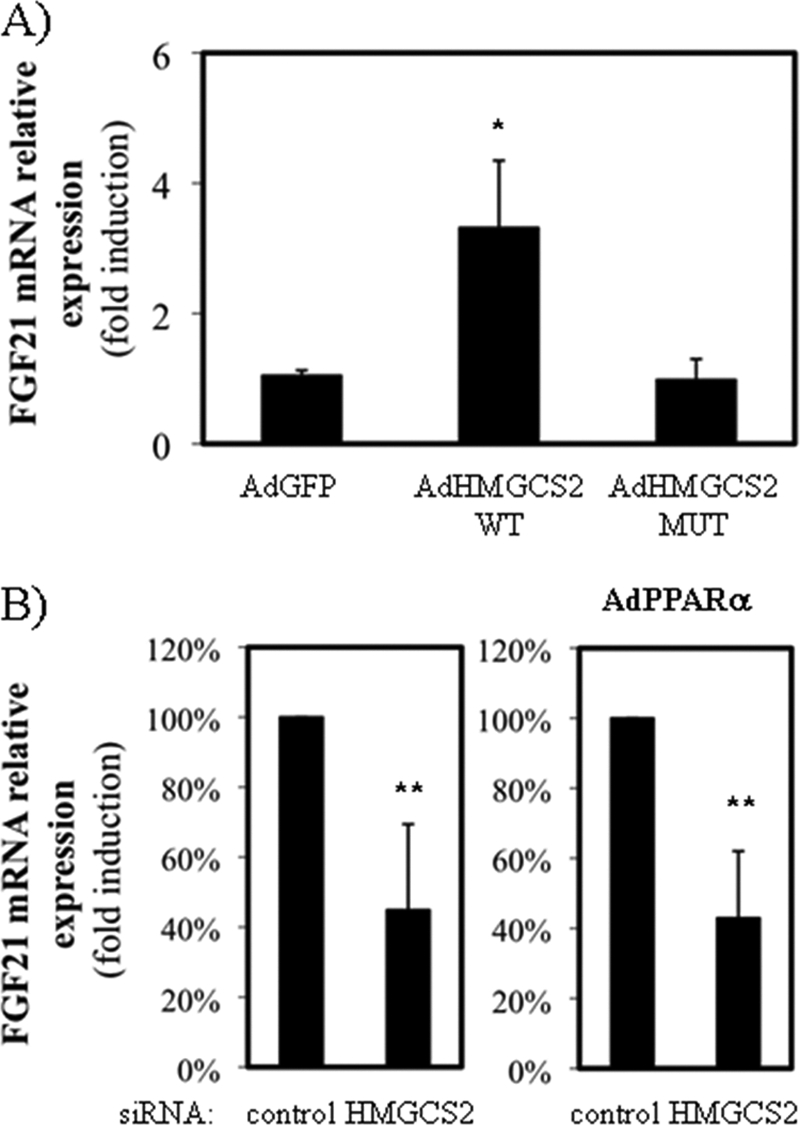
HMGCS2 regulates FGF21 expression in HepG2 cell line. A, FGF21 mRNA levels of cells infected with adenoviruses expressing GFP (AdGFP), wild type (AdHMGCS2 WT), or C166A dead mutant (AdHMGCS2 MUT) human HMGCS2. B, FGF21 mRNA levels of HepG2 transfected with siRNA control siRNA (nontargeting) or specific siRNA against HMGCS2 and infected with adenoviruses expressing GFP (left panel) or human PPARα (AdPPARα; right) is shown. The results are expressed as the percentages of induction by PPARα in the presence of HMGCS2 (100%) or in the absence of HMCGC2. The average of five independent experiments is shown. *, p < 0.05, **, p < 0.01.
To follow the activator effect of HMGCS2, we performed luciferase promoter assays in which no co-activation by HMGCS2 was observed on PPARα mediated-induction of CPT1a or HMGCS2 promoters (data not shown). These data are consistent with the lack of nuclear co-localization of recombinant PPARα and endogenous HMGCS2 shown by immunohistochemistry analysis in HepG2 cells (Fig. 4A). In addition, pulldown experiments showed that no interaction of HMGCS2 overexpressed in HepG2 with the GST-PPARα purified protein that can interact with its RXRα partner (Fig. 4B). These results indicate that the effect on FGF21 expression observed in HepG2 cells was not related to co-activation of PPARα by HMGCS2.
FIGURE 4.

Recombinant PPARα does not co-localize nor interact with endogenous HMGCS2. A, immunohistochemical analysis of recombinant PPARα and endogenous HMMGCS2 expression in HepG2 cell. Cells infected with adenovirus control (AdLacZ) or adenovirus encoding human PPARα (AdPPARα)) were fixed and stained with DAPI and incubated with anti-PPARα or anti-HMGCS2 antibody followed by Alexa Fluor 488 or Alexa Fluor 647, respectively, and viewed with a confocal microscope. B, pulldown experiment of recombinant GST-PPARα. HepG2 cells were infected with adenoviruses expressing GFP (AdGFP), wild type (AdHMGCS2 WT), or C166A dead mutant (AdHMGCS2 MUT) human HMGCS2 were treated (+) or not (−) with palmitate 0.5 mm for 16 h. Whole protein cell extracts of the infected HepG2 cells were incubated with GST-PPARα generated in E. coli. GST recombinant protein was captured by glutathione-Sepharose beads, and the recovered beads were immunoblotted with anti-HMGCS2 and RXRα antibodies. Inputs show endogenous RXRα and recombinant HMGCS2 variants in whole protein cell extracts.
FGF21 Is a SirT1 Target Gene during Fed-to-Fast Transition
An alternative metabolic hypothesis for HMGCS2 stimulation of FGF21 is that the effect of HMGCS2 on ketogenesis and FGF21 expression could be correlated throughout the NAD+ intracellular levels because: (i) ketone body production implies the reduction of acetoacetate to β-hydroxybutyrate with the concomitant generation of NAD+ (2) and (ii) the effect of PPARα ligands on FGF21 expression are dependent on SirT1 activity (14). Therefore, we hypothesize that HMGCS2 could affect FGF21 expression via a mechanism relaying on ketogenesis stimulation of SirT1 activity. To confirm this hypothesis, we studied the mRNA expression FGF21 in wild type or SirT1 liver knock-out mice during the fed-to-starved transition. Fig. 5A shows that FGF21 induction mediated by starvation was dependent on SirT1. Fig. 5A also shows a specific effect for FGF21, because the starvation-associated induction of other PPARα target genes, like CPT1A and HMGCS2, was not affected (black bars compared with dark gray bars). Fig. 5B shows that the circulating levels of FGF21 protein were impaired in starved SirT1 LKO, indicative of the physiological relevance of SIRT1 dependence. Fig. 5C shows that SirT1 is specifically knocked out in the livers of SirT1 LKO mice (18).
FIGURE 5.

FGF21 is a SIRT1 target gene during fed-to-fast transition. A, quantitative RT-PCR analysis of FGF21 (left panel) and HMGCS2 and CPT1A (right panel) gene expression in liver from mice fed ad libitum (AL) or fasted for 15 h normalized to 18 S expression. B, ELISA measurement of FGF21 in serum. C, Western blot of liver extracts from mice WT and LKO between 5 and 10 animals/group were used. Open bars represent WT mice fed ad libitum, pale gray bars represent SIRT1 LKO fed ad libitum, dark gray bars represent 15-h fasted WT mice, and closed bars represent 15-h fasted SIRT1 LKO. *, p < 0.05.
Acetoacetate Modulates FGF21 mRNA Expression by a SirT1-dependent Mechanism
Next, to pursue the hypothesis about NAD+ levels, we treated HepG2 cells with the oxidizing (acetoacetate) or reducing (β-hydroxybutyrate) partners of ketone bodies. Fig. 6A shows that acetoacetate induced FGF21 expression in a dose-dependent manner, whereas β-hydroxybutyrate did so to a lesser extent. Fig. 6B (left panel) shows that acetoacetate mediated induction of FGF21 expression was dependent on SirT1 expression. Fig. 6B (right panel) shows that acetoacetate did not affect endogenous SirT1 levels and that the siRNA treatment was efficient. These results suggest that the products of ketogenesis can stimulate gene expression through the SirT1 activity and therefore that HMGCS2 could control metabolic processes other than ketogenesis in this cell line.
FIGURE 6.

FGF21 is induced by acetoacetate in HepG2 cell line. A, HepG2 cells were treated with acetoacetate 1 (low) or 10 mm (high) or with 3-hydroxybutyrate 2 (low) or 20 mm (high) for 5 h in regular growth medium. Relative expression of FGF21 mRNA was assessed by real time PCR. The average of three independent experiments is shown. B, left panel, levels of mRNA of FGF21 in cells transfected with a siRNA control or siRNA specific for SIRT1 in the absence (open bars) or 10 mm acetoacetate (closed bars). Right panel, the levels of SIRT1 protein cells transfected with a control siRNA or specific SIRT1 siRNA, in the absence (−) or the presence (+) of 10 mm acetoacetate. The average of three independent experiments is shown. *, p < 0.05, **, p < 0.01.
DISCUSSION
Fatty acid β-oxidation and ketogenesis are induced during fasting or lactation (1) and also in pathological situations such as diabetes (reviewed in Ref. 29). PPARα mediates the induction of genes responsible for controlling both processes. The HMGCS2 gene controls ketogenesis (2) and is a PPARα target (4–6). Studies with the homologous HMGCS1 (19, 20) (an isotype that catalyzes the same reaction in the cytosol, where it controls the mevalonate pathway) suggested that cysteine 166 is part of the active site of the mitochondrial HMGCS2 enzyme. Therefore, in this paper, we generated two adenoviruses expressing wild type and a catalytically inactive mutant (C166A; Fig. 1A) of the human HMGCS2. When HMGCS2 activity was expressed, HepG2 cells become ketogenic (Fig. 2B). Interestingly, we also observed that these cells had a greater capacity to oxidize long chain fatty acids. The β-oxidation induction was similar to that seen in PPARα-infected cells (Fig. 1C). These results suggest that expression of the gene not only controls ketogenesis but can also control the β-oxidation pathway in certain circumstances.
Recombinant PPARα expression in HepG2 cells induces β-oxidation of fatty acids and the expression of genes such as FGF21, HMGCS2, and CPT1A (Ref. 6 and Table 1). It has been proposed that HMGCS2 is a co-activator of PPARα (11) through a mechanism involving the HMGCS2 palmitoylation of Cys-166 (12). In fact, we found that expression of HMGCS2 was involved in the induction of fatty acid oxidation mediated by PPARα (Fig. 2). However, our data do not support the role of HMGCS2 as a PPARα co-activator. We did not observe an interaction between PPARα and HMGCS2 nor a nuclear co-localization of both proteins (Fig. 4). In addition, no effect of co-activation was observed at the level of reporter gene even for HMGCS2, which was proposed (12) as the target of PPARα co-activation (data not shown). Therefore, we have sought an alternative hypothesis to explain the role of HMGCS2 in controlling fatty acid oxidation.
Liver synthesizes acetoacetate through the 3-hydroxy-3-methylglutaryl-CoA (HMG-CoA) cycle, which is driven by the three mitochondrial located enzymes acetoacetyl-CoA thiolase (EC 2.3.1.9), hydroxymethylglutaryl-CoA synthase (HMGCS2; EC 4.1.3.5), and hydroxymethylglutaryl-CoA lyase (EC 4.1.3.4) and produces 1 mol of acetoacetate, 1 mol of acetyl-CoA, and 2 mol of free CoA from three molecules of acetyl-CoA (2). Acetoacetate is further reduced to β-hydroxybutyrate through mitochondrial β-hydroxybutyrate dehydrogenase (EC 1.1.1.30), driven by high levels of NADH in hepatic mitochondria. Interestingly, in humans (30) and other mammals (31), a cytosolic isotype of β-hydroxybutyrate dehydrogenase has been characterized, suggesting a reversible conversion between acetoacetate and β-hydroxybutyrate depending on the [NAD+]/[NADH] ratio. In addition, diet manipulation, like caloric restriction, affects the [NAD+]/[NADH] ratio in liver and muscle (18). In this study we hypothesized that HMGCS2, widely expressed in human tissues (16), could modulate [NAD+]/[NADH] ratio by feed-forward ketogenesis. HMGCS2 activity specifically induces FGF21 mRNA levels in HepG2 cells (Fig. 3A), whereas other PPARα target genes remained unaffected (Table 1). Also, knockdown of HMGCS2 clearly affected FGF21 expression and its induction by PPARα (Fig. 3B). FGF21 has been shown to be highly sensitive to SirT1 activity on ligand-dependent PPARα transactivation (14), and our data clearly indicate that fasting-induced expression of FGF21 was blunted in SirT1 liver-specific knock-out, whereas other PPARα target genes were unaffected in this experimental condition (Fig. 5). This result indicates that FGF21, in terms of mRNA levels or the circulating protein, is highly sensitive to SirT1 activity during fasting.
To explain our data, we propose that under certain circumstances HMGCS2 activity, through acetoacetate generation, could modulate the cytosolic [NAD+]/[NADH] ratio and therefore SirT1 activity. Consistent with this hypothesis, we observed that the addition of acetoacetate, but not β-hydroxybutyrate, to the HepG2 cell medium induces FGF21 expression in a mechanism dependent on SirT1 (Fig. 6). Therefore, HMGCS2 seems to have a specific effect on gene expression, which does not depend on PPARα co-activation. However, our results do not fully explain why HMGCS2 expression is necessary for the induction of β-oxidation mediated by PPARα. It is possible that changes in the mitochondrial [NAD+]/[NADH] ratio are also partly responsible for this phenomenon. However, it is also possible that removal of acetyl-CoA, as acetoacetate, accelerates the catabolic process and that both FGF21 mRNA expression and β-oxidation are stimulated by HMGCS2 through independent mechanisms.
Proliferating cells do not express HMGCS2 activity (10, 15). The human gene is a target of c-Myc, and its expression is characteristic of differentiated cells of the colon (24). The role of oxidative metabolism in cell transformation has recently been highlighted (reviewed in Ref. 32). In fact, it has been found that p53 up-regulates fatty acid oxidation induced by glucose starvation (33), and it is proposed that this effect would be part of its role as a tumor suppressor gene because active β-oxidation would protect the cell from Warburg effect (reviewed in Ref. 34). We have not observed a clear effect of HMGCS2 gene expression on cell proliferation, a target gene of p53 (data not shown). However, we have shown how HMGCS2 expression produces metabolic effects capable of inducing the expression of genes such as FGF21 and altering the oxidative flux of long chain fatty acids.
In conclusion, our results suggest that HMGCS2 expression affects the PPARα-mediated response. However, we propose an alternative mechanism to the previously proposed co-activation of PPARα (11, 12). Our mechanism would be related to changes in the metabolites of the cell induced by the acceleration of ketogenesis, although these changes could be related to factors other than SirT1 activity.
Acknowledgments
We are truly grateful to Dr. Leonard Guarente and Dr. Hung-Chun Chang (Department of Biology, MA Institute of Technology) for liver-specific SirT1 KO mice.
This work was supported by Grants BFU2007-67322/BMC (to P. F. M.) and SAF2010-15217 (to D. H.) from the Spanish Ministerio de Educación y Ciencia and RCMNC03/08 (to D. H.) and also by funding from the Catalan government (Ajut de Suport als Grups de Recerca de Catalunya Grants 2005SGR00857 and 2009SGR163).
- HMG-CoA
- 3-hydroxy-3-methylglutaryl-CoA
- 3-HB
- 3-hydroxybutyrate
- AcAc
- acetoacetate.
REFERENCES
- 1. McGarry J. D., Foster D. W. (1980) Annu. Rev. Biochem. 49, 395–420 [DOI] [PubMed] [Google Scholar]
- 2. Hegardt F. G. (1999) Biochem. J. 338, 569–582 [PMC free article] [PubMed] [Google Scholar]
- 3. Napal L., Marrero P. F., Haro D. (2005) J. Mol. Biol. 354, 751–759 [DOI] [PubMed] [Google Scholar]
- 4. Rodríguez J. C., Gil-Gómez G., Hegardt F. G., Haro D. (1994) J. Biol. Chem. 269, 18767–18772 [PubMed] [Google Scholar]
- 5. Ortiz J. A., Mallolas J., Nicot C., Bofarull J., Rodríguez J. C., Hegardt F. G., Haro D., Marrero P. F. (1999) Biochem. J. 337, 329–335 [PMC free article] [PubMed] [Google Scholar]
- 6. Hsu M. H., Savas U., Griffin K. J., Johnson E. F. (2001) J. Biol. Chem. 276, 27950–27958 [DOI] [PubMed] [Google Scholar]
- 7. Kersten S., Seydoux J., Peters J. M., Gonzalez F. J., Desvergne B., Wahli W. (1999) J. Clin. Invest. 103, 1489–1498 [DOI] [PMC free article] [PubMed] [Google Scholar]
- 8. Inagaki T., Dutchak P., Zhao G., Ding X., Gautron L., Parameswara V., Li Y., Goetz R., Mohammadi M., Esser V., Elmquist J. K., Gerard R. D., Burgess S. C., Hammer R. E., Mangelsdorf D. J., Kliewer S. A. (2007) Cell Metab. 5, 415–425 [DOI] [PubMed] [Google Scholar]
- 9. Badman M. K., Pissios P., Kennedy A. R., Koukos G., Flier J. S., Maratos-Flier E. (2007) Cell Metab. 5, 426–437 [DOI] [PubMed] [Google Scholar]
- 10. Le May C., Pineau T., Bigot K., Kohl C., Girard J., Pégorier J. P. (2000) FEBS Lett. 475, 163–166 [DOI] [PubMed] [Google Scholar]
- 11. Meertens L. M., Miyata K. S., Cechetto J. D., Rachubinski R. A., Capone J. P. (1998) EMBO J. 17, 6972–6978 [DOI] [PMC free article] [PubMed] [Google Scholar]
- 12. Kostiuk M. A., Keller B. O., Berthiaume L. G. (2010) FASEB J. 24, 1914–1924 [DOI] [PMC free article] [PubMed] [Google Scholar]
- 13. Nemoto S., Fergusson M. M., Finkel T. (2004) Science 306, 2105–2108 [DOI] [PubMed] [Google Scholar]
- 14. Purushotham A., Schug T. T., Xu Q., Surapureddi S., Guo X., Li X. (2009) Cell Metab. 9, 327–338 [DOI] [PMC free article] [PubMed] [Google Scholar]
- 15. Prip-Buus C., Bouthillier-Voisin A. C., Kohl C., Demaugre F., Girard J., Pegorier J. P. (1992) Eur. J. Biochem. 209, 291–298 [DOI] [PubMed] [Google Scholar]
- 16. Mascaró C., Buesa C., Ortiz J. A., Haro D., Hegardt F. G. (1995) Arch. Biochem. Biophys. 317, 385–390 [DOI] [PubMed] [Google Scholar]
- 17. Barrero M. J., Camarero N., Marrero P. F., Haro D. (2003) Biochem. J. 369, 721–729 [DOI] [PMC free article] [PubMed] [Google Scholar]
- 18. Chen D., Bruno J., Easlon E., Lin S. J., Cheng H. L., Alt F. W., Guarente L. (2008) Genes Dev. 22, 1753–1757 [DOI] [PMC free article] [PubMed] [Google Scholar]
- 19. Cheng H. L., Mostoslavsky R., Saito S., Manis J. P., Gu Y., Patel P., Bronson R., Appella E., Alt F. W., Chua K. F. (2003) Proc. Natl. Acad. Sci. U.S.A. 100, 10794–10799 [DOI] [PMC free article] [PubMed] [Google Scholar]
- 20. He T. C., Zhou S., da Costa L. T., Yu J., Kinzler K. W., Vogelstein B. (1998) Proc. Natl. Acad. Sci. U.S.A. 95, 2509–2514 [DOI] [PMC free article] [PubMed] [Google Scholar]
- 21. Clinkenbeard K. D., Reed W. D., Mooney R. A., Lane M. D. (1975) J. Biol. Chem. 250, 3108–3116 [PubMed] [Google Scholar]
- 22. García-Martínez C., Marotta M., Moore-Carrasco R., Guitart M., Camps M., Busquets S., Montell E., Gómez-Foix A. M. (2005) Am. J. Physiol. Cell Physiol 288, C1264–C1272 [DOI] [PubMed] [Google Scholar]
- 23. Zhou W., Han W. F., Landree L. E., Thupari J. N., Pinn M. L., Bililign T., Kim E. K., Vadlamudi A., Medghalchi S. M., El Meskini R., Ronnett G. V., Townsend C. A., Kuhajda F. P. (2007) Cancer Res. 67, 2964–2971 [DOI] [PubMed] [Google Scholar]
- 24. Camarero N., Mascaró C., Mayordomo C., Vilardell F., Haro D., Marrero P. F. (2006) Mol. Cancer Res. 4, 645–653 [DOI] [PubMed] [Google Scholar]
- 25. Misra I., Narasimhan C., Miziorko H. M. (1993) J. Biol. Chem. 268, 12129–12135 [PubMed] [Google Scholar]
- 26. Rokosz L. L., Boulton D. A., Butkiewicz E. A., Sanyal G., Cueto M. A., Lachance P. A., Hermes J. D. (1994) Arch. Biochem. Biophys. 312, 1–13 [DOI] [PubMed] [Google Scholar]
- 27. Valera A., Pelegrin M., Asins G., Fillat C., Sabater J., Pujol A., Hegardt F. G., Bosch F. (1994) J. Biol. Chem. 269, 6267–6270 [PubMed] [Google Scholar]
- 28. Quant P. A. (1994) in Essays in Biochemistry (Tipton K. F. ed) pp. 13–24, Portland Press, London [Google Scholar]
- 29. Eledrisi M. S., Alshanti M. S., Shah M. F., Brolosy B., Jaha N. (2006) Am. J. Med. Sci. 331, 243–251 [DOI] [PubMed] [Google Scholar]
- 30. Guo K., Lukacik P., Papagrigoriou E., Meier M., Lee W. H., Adamski J., Oppermann U. (2006) J. Biol. Chem. 281, 10291–10297 [DOI] [PubMed] [Google Scholar]
- 31. Koundakjian P. P., Snoswell A. M. (1970) Biochem. J. 119, 49–57 [DOI] [PMC free article] [PubMed] [Google Scholar]
- 32. DeBerardinis R. J., Lum J. J., Hatzivassiliou G., Thompson C. B. (2008) Cell Metab. 7, 11–20 [DOI] [PubMed] [Google Scholar]
- 33. Ide T., Brown-Endres L., Chu K., Ongusaha P. P., Ohtsuka T., El-Deiry W. S., Aaronson S. A., Lee S. W. (2009) Mol. Cell. 36, 379–392 [DOI] [PMC free article] [PubMed] [Google Scholar] [Retracted]
- 34. Levine A. J., Puzio-Kuter A. M. (2010) Science 330, 1340–1344 [DOI] [PubMed] [Google Scholar]