

Abstract
In the normal brain, tau protein is phosphorylated at a number of proline- and non-proline directed sites, which reduce tau microtubule binding and thus regulate microtubule dynamics. In Alzheimer disease (AD), tau is abnormally hyperphosphorylated, leading to neurofibrillary tangle formation and microtubule disruption, suggesting a loss of regulatory mechanisms controlling tau phosphorylation. Early growth response 1 (Egr-1) is a transcription factor that is significantly up-regulated in AD brain. The pathological significance of this up-regulation is not known. In this study, we found that lentivirus-mediated overexpression of Egr-1 in rat brain hippocampus and primary neurons in culture activates proline-directed kinase Cdk5, inactivates PP1, promotes tau phosphorylation at both proline-directed Ser396/404 and non-proline-directed Ser262 sites, and destabilizes microtubules. Furthermore, in Egr-1−/− mouse brain, Cdk5 activity was decreased, PP1 activity was increased, and tau phosphorylation was reduced at both proline-directed and non-proline-directed sites. By using nerve growth factor-exposed PC12 cells, we determined that Egr-1 activates Cdk5 to promote phosphorylation of tau and inactivates PP1 via phosphorylation. When Cdk5 was inhibited, tau phosphorylation at both proline- and non-proline directed sites and PP1 phosphorylation were blocked, indicating that Egr-1 acts through Cdk5. By using an in vitro kinase assay and HEK-293 cells transfected with tau, PP1, and Cdk5, we found that Cdk5 phosphorylates Ser396/404 directly. In addition, by phosphorylating and inactivating PP1, Cdk5 promotes tau phosphorylation at Ser262 indirectly. Our results indicate that Egr-1 is an in vivo regulator of tau phosphorylation and suggest that in AD brain increased levels of Egr-1 aberrantly activate an Egr-1/Cdk5/PP1 pathway, leading to accumulation of hyperphosphorylated tau, thus destabilizing the microtubule cytoskeleton.
Keywords: Alzheimer Disease, CDK (Cyclin-dependent Kinase), Microtubules, Neurodegeneration, Neuron, PP1, Protein Phosphorylation, Tau, Egr-1, Tau Protein Phosphorylation
Introduction
Alzheimer disease (AD)3 is the most prevalent form of dementia in the elderly and is characterized by the presence of two characteristic pathological hallmarks: senile plaques and neurofibrillary tangles (NFTs) (1, 2). Senile plaques are composed of β-amyloid peptides that are derived from sequential cleavage of the amyloid precursor protein. NFTs are composed mostly of the abnormally hyperphosphorylated microtubule-associated protein tau (3).
Recent studies suggest that β-amyloid deposition may occur early and initiate pathological events including tau phosphorylation (4). However, it has been shown that tau dysfunction alone is sufficient to cause neurodegeneration and that tau may be required for β-amyloid neurotoxicity (5, 6). Tau hyperphosphorylation is an important process in AD neuropathology. In a normal brain, tau binds to and stabilizes the microtubule cytoskeleton. When phosphorylated, however, it is less able to bind to microtubules, leading to microtubule instability. In AD brain, tau hyperphosphorylation destabilizes microtubules, causing cytoskeletal dysfunction and perhaps NFT formation and neurodegeneration (1, 3). Elucidation of the molecular basis by which tau phosphorylation is regulated in a normal brain and how this regulation fails in AD brain will greatly increase our understanding of the disease ontogeny and will help in the development of therapeutic interventions.
The brain is one of the most vascularized organs, and AD is accompanied by vascular pathology in addition to senile plaques and NFTs. Moreover, several risk factors for vascular dementia including old age, arthrosclerosis, stroke, hypertension, hyperlipidemia, transient ischemic attack, high serum viscosity, and the E4 allele of apolipoprotein E gene overlap with those of sporadic AD (7). These observations have led to the suggestion that the disease mechanisms of AD and vascular dementia are related (7). Along the same viewpoint, transcription factor early growth response 1 (Egr-1) is highly involved in various vascular pathologies (8–10) and is up-regulated in AD brain (see below).
Egr-1, a zinc finger transcription factor (also known as Krox-24 and Zif 268), regulates the transcription of a number of genes involved in immune response, differentiation, growth, and development (11) and plays a central role in the induction and maintenance of various vascular pathologies (8, 10). The basal level of Egr-1 protein in the brain is relatively low, but it is rapidly and transiently induced by a large number of growth factors, cytokines, neurotransmitters, brain injury, ischemia, hypoxia, and other stressors (12). Once induced, Egr-1 activates the expression of a number of genes including those involved in cell death and injury (13). A recent study analyzed a microarray data set of 31 samples corresponding to hippocampal gene expression from 22 AD subjects with a varying degree of severity and nine controls. Using modern bioinformatics methods, this study showed significant up-regulation of Egr-1 correlating with progression of AD (14). Consistent with this study, an earlier study reported that Egr-1 mRNA is elevated ∼4-fold in degenerating but not normal hippocampal pyramidal neurons of AD brain and that Egr-1 protein was concentrated in neurons with high NFT density (15).
In addition, expression of a number of Egr-1-regulated genes such as transforming growth factor β (TGF-β), caspase 3, p53, and Bcl-2 are altered in AD brain (13, 16–29). Egr-1 promotes the transcription of p35 in vivo (30, 31); p35 is the brain-specific activating subunit of Cdk5 (32). Increased activity of Cdk5 was reported in AD brain (33). Egr-1 is a potent inducer of apoptosis (13), and increased apoptosis is a feature of AD (34, 35). Finally, curcumin, the bioactive ingredient of turmeric, displays significant beneficial effects in models of AD both in vivo and in vitro (36–43). A number of independent studies have shown that curcumin is an inhibitor of Egr-1 activity in vivo and have suggested that inhibition of Egr-1 may be a therapeutic approach for AD (44–50). These observations together argue that Egr-1 is up-regulated in AD brain and raise questions regarding the pathophysiological significance of this up-regulation. To begin to address these questions, we analyzed tau phosphorylation in rat brain hippocampus, in primary neurons overexpressing human Egr-1 in culture, and in Egr-1−/− mouse brains. Herein, we demonstrate that targeted expression of Egr-1 in rat brain hippocampus or in primary hippocampal neurons in culture promotes tau hyperphosphorylation and destabilizes the microtubule cytoskeleton by a mechanism involving Cdk5 and protein phosphatase 1 (PP1). Our data indicate that Egr-1 is an in vivo regulator of tau protein phosphorylation and suggest that increased levels of Egr-1 in AD brain play a role in NFT pathology.
MATERIALS AND METHODS
Construction of Lentiviral Vector and Virus Production
Human Egr-1 was subcloned into pcDNA3 at the EcoRI/ApaI site by PCR using primer 5′-GCG AAT TCA TGG CAG CGG CCA AGG CCG CGA TG-3′. A Myc tag was added to the C terminus of the clone. pcDNA3-Egr-1 or pcDNA3 was subsequently cloned into lentiviral vector pTet07CSII-CMV5-mcs-ires-GFPq. Lentivirus was produced as described previously (51). Briefly, the DNA was transfected into 293SF-PacLV29-6 packaging cells, and the virus was harvested after 48 and 72 h from the supernatant and purified by ultracentrifugation. The titer of purified virus was determined, and the virus was stored at −80 °C.
Animals
All experiments involving animals were carried out according to the Guidelines of the Canadian Council of Animal Care and The Lady Davis Institute for Medical Research. Adult mice WT Egr-1+/+ and Egr-1−/− in a C57BL/6 background were described previously (31). Mice were euthanized by cervical dislocation, and their brains were immediately homogenized individually in cold extraction buffer (50 mm Hepes (pH 7.2), 0.1 mm EDTA, 0.1 mm EGTA. 0.1 mm DTT, 50 mm β-glycerol phosphate supplemented with phosphatase and protease inhibitor mixtures). Each homogenate was centrifuged at 4 °C, and the supernatant was subjected to Western blot analysis. Mice were genotyped by PCR.
Human Brain Tissue
AD and normal brain samples (supplemental Table 1 for details) used in this study were obtained from the University of California, Irvine and were gifts from Dr. Hyman Schipper of Lady Davis Institute, Montreal, Canada.
Stereotaxic Surgery
Eight-month-old Long Evans female rats were obtained from Charles River Breeding Farms (St. Constant, Quebec, Canada). Animals were housed with free access to food and water for 1 week prior to surgery. Anesthesia was induced via delivery of a mixture of isoflurane (5%) and oxygen and maintained at 2.5% isoflurane. Carprofen (5 mg/ml/kg) was delivered, and animals were mounted on a stereotaxic frame. The skull was exposed, and two holes were drilled 3.8 mm posterior and 1.9 mm lateral to bregma. A 1-μl microsyringe (Hamilton, Reno, NV) with a 30-gauge needle was slowly lowered into each hole 2.6 mm from the dura, and 0.5 μl of lentivirus (Ln-Egr-1) or lentivirus vector (Ln-vector) suspension (107 transducing units/ml with a multiplicity of infection of 10) was administered per side over a 3-min period. The needle was left in place for 5 min after the injection. Following removal, the holes were sealed with bone wax, powdered Cicatrin was administered topically, and the suture wound was closed with stainless steel suture clips.
Four weeks postinjection, rats were anesthetized and transcardially perfused with cold PBS followed by 4% paraformaldehyde. The brains were immediately removed, postfixed for 24 h in cold 4% paraformaldehyde, washed, and sectioned on a Vibratome. Coronal sections (40 mm thick) corresponding to the hippocampus were collected for immunohistochemical analysis. For biochemical analyses, the hippocampus from each brain was removed, homogenized individually in extraction buffer, and centrifuged at 27,000 × g at 4 °C. The supernatant was withdrawn and used for various analyses.
Immunohistochemistry
Free floating Vibratome brain sections were incubated in H2O2 followed by 2% Triton X-100 and then blocked with 3% BSA in PBS. Blocked sections were incubated with the primary antibody, washed, and developed using a diaminobenzidine histochemistry kit (Molecular Probes). Diaminobenzidine-stained sections were counterstained with hematoxylin-eosin and observed under a microscope (52). For immunofluorescence labeling, primary antibody-labeled sections were washed and then incubated with either fluorescein isothiocyanate (FITC)- or Cy3-conjugated secondary antibody. Samples were washed, mounted with glycerol/PBS, and observed under a fluorescence microscope (52).
Neuronal Culture and Viral Infection
Hippocampal neurons were prepared from embryonic day 18 (E18) rat embryos. Briefly, hippocampi were dissected and dissociated via incubation with papain enzyme solution (Invitrogen) followed by trituration. Cells were then plated on poly-d-lysine-coated coverslips (at a density of 30,000 cells/coverslip) for either immunocytochemistry or on coated plastic dishes (500,000 cells/ml) for biochemical analyses. Cells were maintained in Neurobasal medium supplemented with B27 (Invitrogen), streptomycin, penicillin, glutamate, and glutamine. Three days postplating, cultures were treated with cytosine arabinoside (5 μg/ml) to inhibit glial proliferation. After 3 weeks, 1 ml of Ln-Egr-1 or Ln-vector (107 transducing units/ml with a multiplicity of infection of 10) suspension was added to each culture. After 48 h, neurons were fixed for immunocytochemistry (see below) or homogenized in extraction buffer for Western blot analysis.
Immunocytochemistry
Infected neurons were fixed with 4% paraformaldehyde in PBS at room temperature for 30 min. Fixed neurons were washed and permeabilized via incubation with PBS containing 0.1% Triton X-100 and 1% BSA for 30 min at room temperature. Neurons were then incubated for 12 h at 4 °C with one of the following antibodies: PHF-1 (1:200), anti-tau (1:200), anti-tubulin mouse monoclonal (Sigma) (1:100), anti-tyrosinated tubulin (Tyr-tubulin) (Sigma) (1:100), and rabbit polyclonal anti-Myc (Sigma-Aldrich) (1:100). They were then washed and labeled via incubation with Alexa Fluor 488- or Cy3-conjugated goat anti-mouse or goat anti-rabbit antibody for 1 h at room temperature (52).
Cloning, Cell Culture, and Transfection
The cloning of pcDNA-FLAG-tau, pcDNA-Myc-PP1, and pcDNA-Myc-PP1 (T320A) was described previously (31, 53). PC12 cells were grown and treated with nerve growth factor (NGF) (0.1 μg/ml) for the indicated time points and harvested as described previously (31). HEK-293 cells were transfected with the indicated cDNA using Lipofectamine 2000. Transfected cells were lysed 48 h post-transfection in lysis buffer (50 mm Tris-HCl (pH 7.4), 150 mm NaCl, 50 mm β-glycerol phosphate, 1 mm EDTA, 0.1 mm EGTA, 10 mm MgCl2, 0.2% Nonidet P-40 including phosphatase and protease inhibitor mixtures (Sigma)).
Proteins
Recombinant tau was purified from bacterial lysates overexpressing the longest isoform of human tau (54). To prepare phosphorylated tau for the PP1 activity assay, two fresh rat brains were homogenized together in cold extraction buffer and centrifuged at 100,000 × g at 4 °C for 1 h. The supernatant was withdrawn and placed on ice. To a vial containing various components of tau phosphorylation mixture, an aliquot of the above supernatant was added to initiate phosphorylation, and the mixture was incubated for 1 h at 30 °C. The final concentrations of the various components in the mixture were 50 mm Hepes (pH 7.2), 0.1 mm EDTA, 0.1 mm EGTA, 0.1 mm DTT, 50 mm β-glycerol phosphate, 0.5 mg/ml tau, 0.5 mm ATP, 10 mm MgCl2, 0.3 mm CaCl2, and carryover concentrations of various proteins of brain extract. Incubated samples were placed in a boiling water bath for 2 min to stop the reaction and centrifuged. The supernatant containing heat-stable phosphorylated tau was withdrawn and desalted on a Sephadex G25 column at room temperature. Recombinant PP1 was purified from lysates of bacteria that overexpressed human PP1α as described (31). Cdk5 was purified from fresh bovine brain extract (55). Polyclonal antibody against Egr-1 was purchased from Abcam Inc. Monoclonal antibody against Egr-1 was from Santa Cruz Biotechnology, Inc. Antibodies against PP1, phosphorylated PP1, protein phosphatase 2A (PP2A), Cdk5, p35, GSK3α/β, and phosphorylated GSK3α/β were described previously (31, 56).
In Vitro Kinase Assay
A synthetic peptide derived from cAMP response element-binding protein (KRREILSRRPSYR) was first phosphorylated by PKA, and then the phosphorylated peptide was purified by HPLC as described (56). Other peptide substrates, Kemptide (LRRASLG), Syntide 2 (PLARTLSVAGLPGKK), PKC substrate peptide (KRTLRR), Cdk5 substrate peptide (KTPKKAKKPKTPKKAKKL), and tetradecapeptide specific for phosphorylase kinase (SDQEKRKQISVRGL), were described previously (57). Kinase activity assays were performed as described previously using any of the above peptides as the substrate (57). The final concentrations of the various assay components were 50 mm Tris-HCl (pH 7.4), 1 mm EDTA, 0.1 mm EGTA, 0.3 mm CaCl2, 10 mm MgCl2, 0.5 mm [γ-32P]ATP, 20 μm substrate peptide, and carryover components of brain extract. The assay mixture for PKA also contained 10 μm cAMP. The reaction was initiated by the addition of 10 μl of brain extract to 90 μl of the assay component mixture. After 2 h at 30 °C, aliquots were removed and analyzed by filter paper assay (57).
RESULTS
Egr-1 Protein Level Is Increased in AD Brain
We measured Egr-1 protein level in seven AD (AD1–AD7) and their age-matched normal (N1–N7) brain samples (supplemental Table 1) by Western blot analysis using a monoclonal antibody that recognizes human Egr-1 protein. The relative amount of Egr-1 protein was determined by normalizing Egr-1 band intensity with the corresponding actin band. In the temporal cortex, the relative amount of Egr-1 protein was 2.2-fold higher in AD brains when compared with the normal controls (supplemental Fig. 1, A and B). In the hippocampus, the relative Egr-1 protein level was 2.1-fold higher in AD than in normal control brains. When a similar experiment was performed using a polyclonal antibody directed to human Egr-1, the relative Egr-1 protein levels in AD brain temporal cortex and hippocampus were 1.8- and 1.9-fold higher, respectively, than in normal brain (data not shown). These data are consistent with previous reports (14, 15) and indicated that Egr-1 protein is up-regulated in AD brain.
Targeted Expression of Egr-1 Promotes Tau Phosphorylation in Rat Brain Hippocampus
To examine the effect of increased expression of Egr-1 in the brain, we subcloned the human Egr-1 gene into a lentiviral vector that independently expresses GFP and Myc-tagged Egr-1 protein (Fig. 1A). When expressed in HEK-293 cells, the virus encoding Egr-1 (Ln-Egr-1) expressed Myc-Egr-1 protein of the predicted molecular size (Fig. 1B). We next injected Ln-Egr-1 or the empty viral vector (Ln-vector) into the hippocampus of 8-month-old adult rats (three in each group). After 4 weeks, the rats were euthanized, and the brain tissue was analyzed. The expression of virally encoded transgenic Myc-Egr-1 in the hippocampus of each rat was confirmed by Western blot of hippocampal extracts using anti-Myc antibody (Fig. 1C, rats 4–6). Immunohistochemical analyses of the brain sections detected Egr-1 (Myc or GFP) and empty vector (GFP) within ∼1 mm of the injection site (Fig. 1, E–M). Immunofluorescence data showed that recombinant Egr-1 was expressed in neurons of the dentate gyrus region of the hippocampus. Western blot analysis using anti-Egr-1 antibody determined that the average amount of Egr-1 protein (native Egr-1 + recombinant Myc-Egr-1) was 1.8-fold greater in Ln-Egr-1-injected hippocampus than in vector-injected controls (Fig. 1D).
FIGURE 1.

Lentivirus-mediated Egr-1 overexpression in rat brain hippocampus. The human Egr-1 gene was subcloned into a lentiviral vector that independently expressed Myc-Egr-1 and GFP. Lentiviruses expressing Egr-1 (Ln-Egr-1) and vector (Ln-vector) were produced and injected into the hippocampus of rat brain (three in each group). The hippocampus of each rat was isolated and analyzed either by Western blot analysis or immunohistochemistry. A, schematic diagram of viral constructs used in rat brain injections and infection of rat primary hippocampal neurons. B, Western blot analysis of HEK-293 cells infected with the indicated virus. C, Western blot analysis of hippocampal extracts of the indicated rats injected with the indicated virus. Anti-Myc antibody confirms the expression of virally encoded transgenic Myc-Egr-1, whereas anti-Egr-1 antibody monitors total Egr-1 protein. D, relative amount of Egr-1 in virus-injected hippocampal extract. The relative amount of total Egr-1 was calculated by normalizing the total Egr-1 band intensity value of each sample in C against the respective actin band. Values are mean ± S.E. from three brain samples in each group. *, p < 0.05 (t test). E–M, immunohistochemistry. Hippocampal sections injected with the indicated virus were observed under a fluorescence microscope for GFP immunofluorescence to monitor virally mediated gene expression or immunostained with anti-Myc (Myc-Egr-1) to monitor the expression of transgenic Myc-Egr-1. E–M, hippocampal sections of injected rats showing GFP or Myc (Myc-Egr-1) immunofluorescence, DAPI (nucleus), and merge (co-localization). The arrowheads show the injection site in the Ln-Egr-1 rat brain section. Scale bars, 200 μm in E and 50 μm in F–M. Note that we could not detect GFP epifluorescence from brain sections and neurons in culture infected with virus; hence, we visualized GFP by immunofluorescence with an anti-GFP antibody. EGFP, enhanced GFP; IRES, internal ribosome entry site.
When brain slices were exposed to PHF-1 antibody directed to tau phosphorylated at Ser396/404, no significant immunostaining was observed in the dentate gyrus of the hippocampal sections obtained from any of Ln-vector-injected controls (Fig. 2A). However, intense PHF-1 immunoreactivity was seen in the pyramidal neurons of the dentate gyrus granular layer in the hippocampal sections prepared from Ln-Egr-1-injected rats (Fig. 2A, upper panel). Similar observations were made when brain slices were exposed to AT8 antibody that recognizes tau phosphorylated at Ser202/202 (Fig. 2A, lower panel). When hippocampal extracts were subjected to Western blot analysis, all Ln-vector-injected animals showed a basal level of tau phosphorylation at PHF-1 sites (Fig. 2B, upper panel). Importantly, each of the Ln-Egr-1-injected hippocampal extracts showed a higher level of tau phosphorylation compared with any of the Ln-vector-injected controls (Fig. 2B, upper panel). Quantification of the data determined that the average relative amount of PHF-1 phosphorylation in Ln-Egr-1-injected hippocampal extracts was 4.1-fold higher than in vector-expressing animals (Fig. 2B, lower panel).
FIGURE 2.

Egr-1 overexpression promotes tau phosphorylation in rat hippocampus. Ln-Egr-1- or Ln-vector-injected rats were further analyzed by immunohistochemistry and Western blot analysis. A, immunohistochemistry. Hippocampal sections of rats injected with Ln-Egr-1 or Ln-vector were stained with PHF-1 or AT8 antibody. The corresponding inset of each left-hand panel is shown at high magnifications on the right-hand side. Scale bars, 400 μm in the left-hand panel and 100 μm in the right-hand panel. B, Western blot analysis. Hippocampal extracts from rats injected with Ln-Egr-1 and Ln-vector (n = 3 per group) using Tau 5 (total tau), PHF-1, AT8, and 12E8 antibodies. Lower panel, relative amounts. The relative amount of total tau was calculated by normalizing the Tau 5 band with the respective actin band. Relative tau phosphorylation at the PHF-1, AT8, or 12E8 site was calculated by normalizing the PHF-1, AT8, or 12E8 band intensity value with the corresponding Tau 5 band intensity value. Values are the mean ± S.E. from three brain samples in each group. *, p < 0.005; **, p > 0.001 (t test).
To further examine the impact of Egr-1 on tau phosphorylation, we analyzed all of the above hippocampal extracts using AT8 and 12E8 antibodies that recognize tau phosphorylated at Ser202/Thr205 and Ser262, respectively (58, 59). Here again, each of the Egr-1-expressing animals showed higher tau phosphorylation than any of the vector-expressing controls in the hippocampus (Fig. 2B, upper panel). The average tau phosphorylation at Ser202/Thr205 was 2.2-fold and at Ser262 was 1.8-fold higher in Ln-Egr-1-injected hippocampal extracts compared with Ln-vector-injected controls (Fig. 2B, lower panel). The total average tau immunoreactivity measured by Tau 5 antibody normalized against its respective actin band was similar in both groups (Fig. 2B, lower panel). These data demonstrated that Egr-1 promotes tau phosphorylation and does not affect the expression or stability of tau protein in the brain.
Identification of Kinase That Phosphorylates Tau in Response to Egr-1 Overexpression
GSK3β phosphorylates tau in the brain (2). To examine whether Egr-1 promoted tau phosphorylation by activating GSK3β, we performed an in vitro kinase assay using a GSK3-specific peptide substrate derived from cAMP response element-binding protein and previously phosphorylated by PKA (see “Materials and Methods”). Although GSK3 activity was high in all Ln-vector- and Ln-Egr-1-injected hippocampal extracts, there was no significant difference in the GSK3-specific activity between the two groups (Fig. 3A). In the brain, in addition to GSK3β, GSK3α is also highly expressed, and both GSK3 isoforms phosphorylate tau in vitro (56). The GSK3 peptide substrate used above does not discriminate between GSK3β and GSK3α (56). Therefore, to rule out the possibility that high activity of GSK3α may have masked the activation of GSK3β or vice versa in our assay, we performed Western blotting of hippocampal samples using antibody against inactive forms of GSK3α and GSK3β, phosphorylated at Ser21 and Ser9, respectively (Fig. 3B). The levels of phosphorylation of Ser21/Ser9 of GSK3α/GSK3β were similar in the hippocampal extracts of all vector- and Egr-1-expressing animals. In addition, total levels of GSK3α and GSK3β were similar between the two groups. These data indicated that Egr-1 does not activate GSK3α or GSK3β in the brain.
FIGURE 3.

Identification of kinase activated in rat hippocampus injected with Ln-Egr-1. Each rat brain hippocampus injected with Ln-Egr-1 or Ln-vector was individually homogenized, and each homogenate was subjected to a kinase assay using a peptide substrate that was directed to the indicated kinases or analyzed by Western blot analysis using the indicated antibodies. A, relative kinase activity. The specific activity of a kinase in each sample was determined and normalized against the specific activity value of that kinase in the Ln-vector-injected hippocampus. Values are the mean ± S.E. from three hippocampal extracts in each group. B, Western blots. C, relative amounts. The relative amounts of various proteins were determined as in Fig. 2 from the Western blot representing B. To calculate the relative phosphorylation of GSK3α or GSK3β, the average band intensity value of phosphorylated GSK3α or GSK3β was normalized against the respective total GSK3α or GSK3β band intensity value. Values are the mean ± S.E. from three hippocampal extracts in each group. *, p > 0.05 (t test). pGSK3, phosphorylated GSK3; CamK II, Ca2+/calmodulin-dependent protein kinase II.
Cdk5, one of the major kinases that phosphorylates tau in the brain (60), is composed of a catalytic Cdk5 and an activating p35 subunit (32). The Cdk5 subunit requires the p35 subunit for activity. In the brain, the level of the Cdk5 subunit does not change, but the level of the p35 subunit is limiting. Therefore, when the level of p35 is increased, Cdk5 is activated (61). Egr-1 binds to the promoter of the p35 gene and induces p35 transcription, thus enhancing p35 protein level in neurons. Egr-1 is an in vivo activator of Cdk5 (30, 31). Therefore, to test whether Egr-1 promotes tau phosphorylation via activation of Cdk5, we analyzed the levels of Cdk5 and p35 in all Egr-1- and vector-expressing hippocampal extracts. As expected, the level of Cdk5 was similar, but the p35 levels were 2.6-fold higher in each of the Egr-1-expressing hippocampal extracts with respect to any vector-expressing controls (Fig. 3, B and C). To substantiate the Western blot data, we assayed Cdk5 activity using a Cdk5-specific peptide substrate in each of the hippocampal extracts. Indeed, the average relative Cdk5 specific activity was 1.5-fold higher in Egr-1-injected hippocampal extracts compared with vector controls (Fig. 3A). These data showed that Ln-Egr-1 injection activates Cdk5 in rat hippocampus via increased expression of p35. This, in turn, indicated that Egr-1 promotes tau phosphorylation by activating Cdk5 in the brain.
Cdk5 is a proline-directed kinase and phosphorylates at (S/T)P motifs (62). Activation of Cdk5 explained phosphorylation of tau at proline-directed sites Ser396/404 and Ser202/Thr205 in Ln-Egr-1-injected rat hippocampus (Fig. 2). However, Ser262 is a non-proline-directed site. Increased phosphorylation at Ser262 in response to Egr-1 overexpression in rat hippocampus as observed in Fig. 2B suggested that, in addition to Cdk5, Egr-1 may have activated a non-proline-directed kinase that phosphorylates tau at Ser262. Previous studies have shown that Ser262 of tau is phosphorylated by PKA, PKC, Ca2+/calmodulin-dependent protein kinase II, and phosphorylase kinase in vitro (2, 57). To identify which of the above kinases may have phosphorylated tau Ser262 in Egr-1-injected rat hippocampus, we assayed the activities of PKA, PKC, Ca2+/calmodulin-dependent protein kinase II, and phosphorylase kinase using their respective substrates, Kemptide, Syntide 2, PKC peptide substrate, and tetradecapeptide. Surprisingly, specific activities of the aforementioned kinases were similar in all vector- and Egr-1-expressing hippocampal extracts (Fig. 3A). This result showed that Egr-1 does not activate any of the above mentioned kinases.
Egr-1 Promotes Tau Ser262 Phosphorylation via Cdk5 in Vivo
When PC12 cells are exposed to NGF, Egr-1 is activated, which activates Cdk5 (30). With an increase in NGF exposure time, the activity of Cdk5 increases, and tau is phosphorylated (30, 31). PC12 cells provide a simple model to study Egr-1-dependent tau phosphorylation under normal physiological conditions. To identify the kinase that phosphorylates tau in response to increased expression of Egr-1, we exposed PC12 cells to NGF for various amounts of time. After 5 days of exposure, cells were treated with the Cdk5 inhibitor olomoucine, harvested, and analyzed.
The Egr-1 protein level was relatively low in exposure day 0 cells but progressively increased with increased exposure time (Fig. 4, A and B). Cdk5 levels remained constant throughout, but p35 levels increased with exposure time (Fig. 4, A and B). Tau levels were low on day 0 but increased on days 2 and 5 (Fig. 4, A and B). Tau was phosphorylated at Ser396/404 and Ser262 on day 0 and remained phosphorylated throughout the exposure period.
FIGURE 4.

Cdk5 phosphorylates tau in NGF-exposed PC12 cells. PC12 cells were exposed to NGF for the indicated time points. At day 5, the cells were treated with the Cdk5 inhibitor olomoucine or vehicle for 1 h and then subjected to Western blot analysis. Based on blot band intensities, the relative amounts of various proteins were determined as in Fig. 2. A, Western blots. B, relative amounts. Values are the mean ± S.E. from three determinations. *, p > 0.05 with respect to day 0 cells (t test); **, p > 0.05 with respect to vehicle-treated cells (t test). Olo, olomoucine.
When NGF exposure day 5 cells were treated with the Cdk5 inhibitor olomoucine, the levels of Egr-1, tau, Cdk5, and p35 did not change and were similar in vehicle- and olomoucine-treated samples (Fig. 4, A and B). However, tau phosphorylation at Ser396/404 in olomoucine (25 μm)-treated cells was 48% of that of vehicle-treated cells. These data are consistent with previous reports and showed that Cdk5 phosphorylates tau at Ser396/404 in NGF-exposed PC12 cells. Interestingly, there was also a 53 and 44% reduction in phosphorylation at Ser262 in 25 and 50 μm olomoucine-treated cells, respectively, when compared with vehicle-treated cells. To substantiate the olomoucine data, we treated NGF exposure day 5 cells with another Cdk5 inhibitor, roscovitine (5 μm). In these cells, there was a 55% inhibition in Ser262 phosphorylation with respect to vehicle-treated cells (data not shown). Thus, inhibition of Cdk5 not only inhibited proline-directed Ser396/404 phosphorylation but also tau phosphorylation at Ser262 in NGF-treated PC12 cells. This result indicated that NGF promotes tau phosphorylation at Ser262 by activating Cdk5. Because NGF activates Egr-1, which subsequently activates Cdk5 (30), these data also indicated that Egr-1 promotes tau phosphorylation at both Ser396/404 and Ser262 via activation of Cdk5.
Cdk5 Does Not Phosphorylate Tau at Ser262 in Vitro
To gain direct evidence in favor of the idea that Cdk5 phosphorylates tau at both Ser396/404 and Ser262, we incubated recombinant tau with purified Cdk5 in the presence of ATP, Mg2+, and remaining components of the phosphorylation mixture. After various time points, samples were withdrawn and analyzed by Western blot analysis (supplemental Fig. 2). Tau was phosphorylated at Ser396/404 in a time-dependent manner in the sample containing tau and Cdk5 as detected by PHF-1 antibody (supplemental Fig. 2, lanes 2–5). These data showed that Cdk5 was active and that it phosphorylated tau in our sample. Surprisingly, no immunostaining was observed when tau phosphorylated by Cdk5 was probed with 12E8 antibody against Ser262 phosphorylated tau. Similar observations were made when a polyclonal antibody specific for Ser262 phosphorylated tau (pS262) was used (data not shown). This result showed that Cdk5 does not phosphorylate tau at Ser262 and suggested that there is another factor involved in addition to Cdk5 in Egr-1-mediated tau phosphorylation in vivo. We set out to identify the factor and to elucidate the mechanism of Egr-1-induced tau phosphorylation in the brain.
Egr-1 Inactivates PP1 in Brain
The phosphorylation state of a protein is regulated by the activities of both kinases and phosphatases. Tau is dephosphorylated mainly by PP2A and PP1 in the brain (63, 64). To evaluate whether Egr-1 promotes tau phosphorylation by affecting the activity of either of these phosphatases, we performed Western blotting of all Ln-Egr-1- and Ln-vector-injected hippocampal extracts using antibodies against PP2A and PP1. The PP2A protein level was similar in each of the Egr-1- and vector-expressing hippocampal extracts (Fig. 5, A and B). Likewise, inactivating Tyr phosphorylation of PP2A was also unchanged between the two groups. These data suggested that Egr-1 does not affect PP2A activity and does not increase tau phosphorylation via PP2A in the brain.
FIGURE 5.
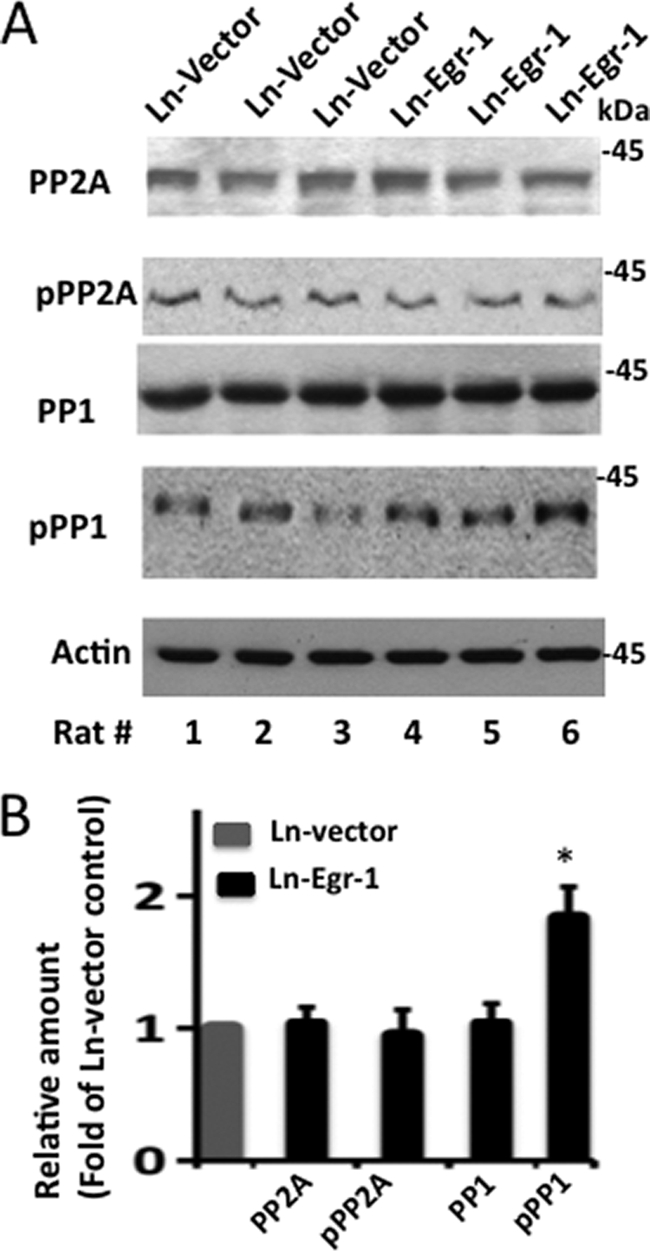
PP1 is inactivated in Egr-1-overexpressing rat hippocampus. Extracts of the indicated virus-injected rat hippocampus were subjected to Western blotting using the indicated antibodies. Based on the band intensities, the relative amounts of various proteins on the blot were determined. A, Western blots. B, relative amounts. The values are the mean ± S.E. from three hippocampal extracts in each group. *, p > 0.005 (t test). pPP1, phosphorylated PP1; pPP2A, phosphorylated PP2A.
However, although PP1 levels were similar, Thr320 phosphorylated PP1 was significantly higher in each of the Egr-1-expressing hippocampal extracts compared with any of the vector-expressing controls (Fig. 5A). Quantification of the data indicated that the average PP1 Thr320 phosphorylation was 1.9-fold higher in Egr-1- than in vector-expressing hippocampal extracts (Fig. 5B). Previous studies have shown that phosphorylation at Thr230 inactivates PP1 (31, 65). These data, therefore, indicated that Egr-1 overexpression down-regulates PP1 activity. This, in turn, indicated that Egr-1 also promotes tau phosphorylation in the brain by inactivating PP1.
Tau Phosphorylation Is Suppressed in Egr-1−/− Mouse Brain
To substantiate the rat hippocampal data, we analyzed brain extracts of three Egr-1−/− and three Egr-1+/+ mice (Fig. 6, A and B). The tau protein level was similar in all Egr-1−/− and Egr-1+/+ mice. In contrast, tau protein phosphorylation was significantly less in each of Egr-1−/− brains compared with any of the Egr-1+/+ brains (Fig. 6A). The average tau phosphorylation at Ser396/404 was 70% less in Egr-1−/− than in Egr-1+/+ brains (Fig. 6B). Likewise, the average Ser262 phosphorylation in Egr-1−/− brain was 65% less than in Egr-1+/+ mice. In Egr-1−/− mouse brain, the Cdk5 level was similar, but the average p35 level was 65% less compared with Egr-1+/+ mouse brain. Likewise, PP1 levels were similar in all genotypes. PP1 phosphorylation, on the other hand, was less in each Egr-1−/− brain than in any of the Egr-1+/+ brains. The average PP1 phosphorylation was 45% less in Egr-1−/− than in Egr-1+/+ mouse brains (Fig. 6B). Thus, ablation of Egr-1 inactivated Cdk5 (via down-regulation of p35 protein level), activated PP1 (via reduction of PP1 phosphorylation), and suppressed tau phosphorylation in the brain. These results are consistent with our rat brain data (Figs. 2 and 3) and indicated that Egr-1 regulates the activities of both Cdk5 and PP1 and controls tau phosphorylation in the brain.
FIGURE 6.

Deletion of Egr-1 function reduces phosphorylation of tau and PP1 in mouse brain. Fresh mouse brains of the indicated genotype (n = 3 per group) were homogenized, and each homogenate was subjected to Western blot analysis using the indicated antibodies. A, Western blots. B, relative amounts. Relative amounts were determined from the band intensities of the respective proteins in A as in Fig. 2. Values are the mean ± S.E. from three brain samples in each group and are expressed as the -fold of Egr-1+/+ control. *, p < 0.001; **, p < 0.05 with respect to Egr-1+/+ control (t test). pPP1, phosphorylated PP1.
Cdk5 Promotes Tau Phosphorylation by Down-regulating PP1 Activity
Previously, we showed that Cdk5 phosphorylates and inactivates PP1 in vitro and in vivo (31). Therefore, in the brain, Egr-1 may promote PP1 phosphorylation by two possible mechanisms. Egr-1 may activate Cdk5, which subsequently may phosphorylate and inactivate PP1 (first mechanism). Alternatively, because PP1 is also phosphorylated by kinases other than Cdk5 (65), Egr-1 may promote PP1 phosphorylation independently of Cdk5 (second mechanism). To discriminate between the two mechanisms, we analyzed NGF-exposed PC12 cells from Fig. 4. We observed that PP1 was phosphorylated in NGF exposure day 0 cells and remained phosphorylated in NGF exposure day 2 and day 5 cells. When NGF exposure day 5 cells were treated with the Cdk5 inhibitor olomoucine or roscovitine, the PP1 level did not change, but PP1 phosphorylation was significantly reduced (supplemental Fig. 3, lanes 5 and 6). As discussed above, Cdk5 phosphorylates PP1 in vitro (31). Hence, these data indicated that Cdk5 phosphorylates PP1 in NGF-exposed PC12 cells, and therefore, Egr-1 promotes PP1 phosphorylation via the first mechanism. As shown in Fig. 4, inhibition of Cdk5 also inhibited tau phosphorylation in NGF-exposed PC12 cells. This result also indicated that Egr-1 promotes both tau phosphorylation and PP1 phosphorylation by activating Cdk5 in vivo.
Based on the above data, we hypothesized that Egr-1 activates Cdk5. Activated Cdk5 then phosphorylates and inactivates PP1 and by doing so inhibits tau dephosphorylation. This inhibition promotes tau phosphorylation at Ser262. For this hypothesis to be true, PP1 must dephosphorylate tau previously phosphorylated at Ser262. To test this, we incubated previously phosphorylated recombinant tau with recombinant PP1 and analyzed the product by Western blot analysis (supplemental Fig. 4). Ser262 phosphorylation was significantly diminished in samples where phosphorylated tau was incubated with PP1 (supplemental Fig. 4, compare lanes 2 and 3). Thus indeed, PP1 dephosphorylates tau previously phosphorylated at Ser262.
Next, to evaluate whether Cdk5 promotes Ser262 phosphorylation via inactivation of PP1 by phosphorylation, we co-transfected tau, PP1, and Cdk5/p35 in different combinations into HEK-293 cells. Transfected cells were lysed and analyzed. In cells transfected with tau alone, tau was phosphorylated at Ser262 at basal level by kinase(s) native to HEK-293 cells (Fig. 7A, lane 1). Likewise, in cells transfected with Myc-PP1, PP1 was phosphorylated at basal level by cellular kinases (Fig. 7A, lane 3). When co-transfected with Cdk5/p35, tau remained phosphorylated at basal level (Fig. 7A, lane 2). When a similar experiment was performed by replacing tau with PP1, PP1 phosphorylation increased by 1.9-fold (Fig. 7A, lane 4). This result is consistent with the idea that Cdk5 does not phosphorylate tau at Ser262 but phosphorylates and inactivates PP1.
FIGURE 7.

Cdk5 promotes tau phosphorylation at Ser262 by phosphorylating and inactivating PP1 in HEK-293 cells. HEK-293 cells were co-transfected with FLAG-tau, Xpress-Cdk5, FLAG-p35, Myc-PP1, or Myc-PP1 (T320A) in different combinations as indicated. Transfected cells were lysed and analyzed by Western blot analysis. Anti-Xpress, anti-FLAG, and anti-Myc blots monitor the expression of the respective tagged genes. Note that both tau and p35 are FLAG-tagged. On the SDS gel, FLAG-tau and FLAG-p35 migrate as 68 and 35 kDa bands, respectively, and can be identified based on their size on the same anti-FLAG Western blot. Western blots in each panel were used to generate respective relative amount values. Values are mean ± S.E. from three determinations. *, p < 0.005; **, p < 0.001 with respect to cells expressing only FLAG-tau (t test); ***, p > 0.02 with respect to cells expressing only Myc-PP1 (t test). pTau, phosphorylated tau; pPP1, phosphorylated PP1.
In cells transfected with tau and PP1, tau phosphorylation was 70% less than the basal level (Fig. 7, compare lane 5 with lane 1), indicating that PP1 dephosphorylated tau in these cells. In contrast, in cells co-expressing tau, PP1, and Cdk5/p35, tau phosphorylation was 2.1-fold more than that observed in cells co-expressing tau and PP1 (Fig. 7, compare lanes 5 and 6) and was almost close to that observed in cells expressing tau alone (Fig. 7, compare lanes 1 and 6). This means that PP1 did not dephosphorylate tau in cells that were co-transfected with tau, PP1, and Cdk5/p35. As shown in the Western blot corresponding to anti-phosphorylated PP1, PP1 phosphorylation was 1.5-fold higher in cells transfected with tau, PP1, and Cdk5/p35 than in those transfected with tau and PP1 (Fig. 7, compare lanes 5 and 6). These data indicated that in cells co-expressing tau, PP1, and Cdk5/p35 PP1 was phosphorylated, inactivated, and therefore did not dephosphorylate tau. Taken together, this result showed that Cdk5 phosphorylates and inactivates PP1 and by doing so promotes tau phosphorylation at Ser262 in HEK-293 cells transfected with tau, PP1, and Cdk5/p35.
To substantiate the above data and to exclude the possibility that Cdk5 may have promoted tau Ser262 phosphorylation by activating/inactivating an enzyme other than PP1, we replaced PP1 (WT) with the PP1 (T320A) mutant that could not be phosphorylated and inactivated by Cdk5 and performed an experiment similar to the one described above. As shown in Fig. 7B, the level of phosphorylated tau in cells transfected with tau and PP1 (T320A) was 60% less than the basal level observed in cells transfected with tau alone (compare lanes 1 and 2). These data showed that PP1 (T320A) dephosphorylates tau in HEK-293 cells co-expressing PP1 (T320A) and tau. Importantly, in cells transfected with tau, PP1 (T320A), and Cdk5/p35, tau phosphorylation remained similar to that observed in cells transfected with tau and PP1 (T320A) (Fig. 7B, compare lanes 2 and 3) and was 55% less than the basal level (compare lanes 1 and 3). Thus, PP1 (T320A) dephosphorylated tau in cells co-expressing tau, PP1 (T320A), and Cdk5/p35. These data showed that blocking PP1 phosphorylation blocks Cdk5-mediated Ser262 phosphorylation in cells expressing tau, Cdk5/p35, and PP1.
Egr-1 Overexpression Destabilizes Microtubule Cytoskeleton in Rat Hippocampus and Primary Hippocampal Neurons in Culture
Tau phosphorylation destabilizes microtubules in the brain (1). To test whether the Egr-1-mediated increase in tau phosphorylation destabilizes the neuronal microtubule cytoskeleton, we analyzed each of the Ln-Egr-1- and Ln-vector-injected hippocampal extracts by Western blotting using antibody that recognizes Tyr-tubulin, which is representative of unstable pools of microtubules (66). Compared with vector-expressing hippocampus, Egr-1-expressing hippocampus showed a higher level of Tyr-tubulin (Fig. 8A). The average relative amount of Tyr-tubulin was found to be 1.6-fold higher in Ln-Egr-1-injected hippocampal extracts compared with Ln-vector-injected control (Fig. 8B). These data suggested that microtubules in Egr-1-overexpressing hippocampus were less stable with respect to control.
FIGURE 8.

Egr-1 overexpression destabilizes microtubules in rat hippocampus. Hippocampal extracts of rats injected with Ln-Egr-1 or Ln-vector were analyzed by Western blot analysis using antibody directed to Tyr-tubulin, Ac-tubulin, β-tubulin, or actin. Based on blot band intensities, relative amounts of various proteins were determined. A, Western blots. B, relative amounts. The relative amount of Tyr-tubulin and Ac-tubulin was determined by normalizing the Tyr-tubulin or Ac-tubulin band intensity of a sample against the respective β-tubulin band. To determine the relative amount of tubulin, the β-tubulin band of a sample was normalized against the respective actin band. Values with the mean ± S.E. are from three hippocampal extracts in each group. *, p > 0.05; **, p > 0.001 (t test).
To substantiate these data, we examined the amount of acetylated tubulin (Ac-tubulin) in all of our hippocampal extracts. Acetylation is a post-translational modification that occurs only in structurally stable microtubules. As shown in Fig. 8, A and B, the average relative amount of Ac-tubulin in Egr-1-expressing hippocampal extracts was 60% less than in those expressing vector control. In contrast, the relative amount of total tubulin was similar between the two groups (Fig. 8, A and B). This result indicated that Egr-1 does not affect tubulin level but destabilizes microtubules in the brain.
To further investigate the effect of Egr-1 on microtubules, we infected mature rat primary hippocampal neurons in culture with either Ln-Egr-1 or Ln-vector (see Fig. 1A for the map of the construct). Western blot analysis using anti-Myc antibody confirmed the expression of the transgene (Fig. 9A, lane 3). A similar Western blot using anti-Egr-1 antibody indicated that the level of total Egr-1 in neuronal extracts infected with Ln-Egr-1 was 1.9-fold more than those infected with Ln-vector control (data not shown). Total tau levels were similar, but phosphorylated tau was increased 3-fold in Ln-Egr-1 samples (Fig. 9, A and B). These data are consistent with the brain data and showed that Egr-1 overexpression does not affect tau levels but promotes tau phosphorylation in neurons. To evaluate whether Egr-1 overexpression affects tau distribution within the neurons, we analyzed Ln-Egr-1- and Ln-vector-infected neurons by immunocytochemistry. In Ln-vector-infected neurons, PHF-1-positive phosphorylated tau was mostly localized to axons with little detected in the soma (Fig. 9C, green). In Ln-Egr-1-infected neurons, intense PHF-1 immunoreactivity was evident in axons, somata, and somatodendritic compartments. Total tau, on the other hand, was localized in somata and neurites of both Ln-Egr-1- and Ln-vector-infected neurons (Fig. 9D, red). Thus, Egr-1 overexpression did not change tau distribution but profoundly increased tau phosphorylation in neurons.
FIGURE 9.

Overexpression of Egr-1 in rat hippocampal primary neurons in culture promotes tau phosphorylation but does not change tau distribution. Rat primary neurons in culture were infected with the indicated virus and then analyzed by either Western blot analysis or immunocytochemistry. A, Western blots. B, relative amounts. The relative amount of phosphorylated tau was determined as in Fig. 2 using a Western blot representing A. Values are the mean ± S.E. from three independent cultures. *, p > 0.05 (t test). C and D, immunocytochemistry. Shown are infected neurons stained for PHF-1 (phosphorylated tau), Myc (Myc-Egr-1), DAPI (nucleus), Tau 5 (total tau), and merge (co-localization). Scale bars, 15 μm.
Overexpression of Egr-1 in rat primary neurons in culture did not change the total amount of tubulin (Fig. 10, A and B). In contrast, the amount of unstable Tyr-tubulin was increased by 2.6-fold in Ln-Egr-1-infected neurons compared with Ln-vector-infected controls. To substantiate the Tyr-tubulin data, we performed Western blots on neuronal extract with anti-Ac-tubulin antibody. The amount of stable microtubules (Ac-tubulin) in Egr-1-infected neurons was reduced by 50% relative to Ln-vector-infected neurons (Fig. 10, A and B). These data demonstrated that overexpression of Egr-1 destabilizes microtubules in neurons in culture. To determine the locality of Egr-1-induced unstable microtubules within the neurons, we co-immunolabeled Ln-Egr-1- and Ln-vector-infected neurons with anti-Tyr-tubulin and anti-Myc (Myc-Egr-1) antibodies and visualized them under a fluorescence microscope. In Ln-vector-infected neurons, Tyr-tubulin was located mostly in the cell body (Fig. 10C, green). In Ln-Egr-1-infected neurons, on the other hand, there was a high level of Tyr-tubulin in the soma, axons, and hillocks (Fig. 10C, green). The distribution of tubulin, however, was similar in Ln-Egr-1- and Ln-vector-infected neurons (Fig. 10D, green). These data indicated that increased expression of Egr-1 in neurons destabilizes axonal microtubules.
FIGURE 10.

Egr-1 overexpression causes microtubule instability in rat primary hippocampal neurons in culture. Rat primary hippocampal neurons infected with the indicated virus were analyzed by either Western blot analysis or immunocytochemistry. A, representative Western blot of extracts of neurons infected with Ln-Egr-1 or Ln-vector using antibodies against unstable microtubules (Tyr-tubulin), stable microtubules (Ac-tubulin), and total tubulin (β-tubulin). B, the relative amounts determined from Western blots representing A as in Fig. 8. Values are the mean ± S.E. from three different cultures. *, p < 0.03; **, p < 0.005 (t test). C and D, immunocytochemistry. Shown are Ln-vector- or Ln-Egr-1-infected neurons stained for Tyr-tubulin, Myc (Myc-Egr-1), β-tubulin, and merge (co-localization). Scale bar, 15 μm. E and F, the indicated virus-infected neurons were treated with the Cdk5 inhibitor roscovitine (rosco) or vehicle and then analyzed by Western blot analysis. E, Western blot. F, relative amount. The relative amounts of phosphorylated tau and Tyr-tubulin were determined as in B. *, p < 0.005 (t test).
To determine the mechanism by which Egr-1 destabilizes microtubules in vivo, we treated virus-infected neurons with the Cdk5 inhibitor roscovitine or vehicle. Treated neurons were then analyzed by Western blot analysis (Fig. 10, E and F). Neurons infected with Ln-vector and treated with vehicle showed basal levels of phosphorylated tau (PHF-1) as well as unstable microtubules (Tyr-tubulin) (Fig. 10, E and F, lane 3). In neurons infected with Ln-Egr-1 and treated with vehicle, the relative amount of phosphorylated tau was 2.2-fold more than the basal level observed in Ln-vector infected neurons (Fig. 10, E, compare lane 1 with lane 3, and see F). Likewise, the relative amount of unstable microtubule was also 2.8-fold higher than the basal level in Ln-Egr-1-infected neurons. This observation is consistent with the data in Fig. 10, A–D, and showed that Egr-1 overexpression promotes tau phosphorylation and microtubule instability in neurons. When Ln-Egr-1-infected neurons were treated with roscovitine, tau phosphorylation decreased to the basal level (Fig. 10, E, compare lane 2 with lane 1, and see F). Importantly, the relative amount of Tyr-tubulin was also reduced to the basal level in Ln-Egr-1-infected neurons treated with roscovitine. Thus, inhibition of tau phosphorylation also inhibited microtubule instability induced by Ln-Egr-1 overexpression in neurons. These data indicated that Egr-1 destabilizes microtubules by promoting tau phosphorylation in vivo.
DISCUSSION
In the normal human brain, tau binds to microtubules and stabilizes the microtubule cytoskeleton (3). When tau becomes phosphorylated, it reduces the affinity of tau for microtubules, thus increasing the pool of unstable microtubules in neurons (54). Tau phosphorylation in a healthy brain regulates the dynamic structure of microtubules, but hyperphosphorylated tau in AD brain promotes the formation of PHFs and the formation of NFTs (2). Hyperphosphorylated tau that is isolated from PHFs does not bind to microtubules or promote microtubule assembly in vitro, but upon dephosphorylation, the ability of tau for both functions is restored (67). Tau hyperphosphorylation, therefore, is regarded as a key step in the development of NFT pathology. It is suggested that the accumulation of hyperphosphorylated tau in AD brain is due to aberrant activation of a regulatory mechanism that controls tau phosphorylation in a normal brain (2, 3).
The transcription factor Egr-1 is activated by a number of growth factors, cytokines, and stressors in vivo (11). In the adult brain, the level of Egr-1 is relatively low but increases during various physiological and pathological happenings (11, 12). In this study, we found that overexpression of Egr-1 in rat brain hippocampus and in primary neurons in culture promotes tau phosphorylation and destabilizes microtubules. In Egr-1−/− mouse brain, tau phosphorylation was significantly suppressed. Our results demonstrated that Egr-1 is a physiological regulator of tau protein phosphorylation in the brain.
Egr-1 is one of the earliest genes to become active when PC12 cells are exposed to NGF (11). One of the genes positively regulated by Egr-1 is the p35 subunit of Cdk5 (30, 31). Egr-1 activates Cdk5 by promoting p35 expression in NGF-exposed PC12 cells. In the current study, we showed that NGF exposure also promotes tau phosphorylation in PC12 cells. When Cdk5 was inhibited, NGF-promoted tau phosphorylation was significantly inhibited in these cells. As shown in Fig. 3, Egr-1 also promoted p35 expression and activated Cdk5 in rat brain hippocampus and in primary neurons in culture (Figs. 3 and 4). Our data indicated that one of the major mechanisms by which Egr-1 promotes tau phosphorylation in vivo is by activating Cdk5.
In the brain, tau is phosphorylated on proline-directed and non-proline-directed sites (68). Studies have shown that both proline- and non-proline-directed phosphorylation can regulate the interaction of tau with microtubules independently (53, 57). Moreover, these sites are phosphorylated by groups of kinases that display distinct site-specific substrate specificity. Our site-specific phosphorylation analysis determined that overexpression of Egr-1 promotes tau phosphorylation in rat brain at proline-directed sites Ser396/404 and Ser202 and non-proline-directed site Ser262. Likewise, in mouse brain, deletion of Egr-1 function suppressed tau phosphorylation at Ser396/404, Ser202, and Ser262. These observations indicated that Egr-1 promotes tau phosphorylation at both proline-and non-proline-directed sites in the brain. In rat hippocampus, Egr-1 activated Cdk5, which accounts for tau phosphorylation at proline-directed sites but not non-proline directed sites. Egr-1 did not activate any of the kinases that were shown to phosphorylate tau at non-proline-directed sites such as PKA, Ca2+/calmodulin-dependent protein kinase II, PKC, and phosphorylase kinase.
Instead, we found that PP1 phosphorylation is increased in rat brain hippocampus overexpressing Egr-1 and decreased in Egr-1−/− mouse brains. Previously, we showed that Cdk5 phosphorylates and inactivates PP1 in vitro (31). In this study, we demonstrated that in PC12 cells inhibition of Cdk5 inhibits both tau phosphorylation and PP1 phosphorylation. In HEK-293 cells, Cdk5 directly phosphorylated PP1 and enhanced Ser262 phosphorylation (Fig. 4). We assayed the activities of only a few potential kinases in our rat hippocampal extracts, and our investigation of phosphatases was limited to only PP1 and PP2A. Furthermore, because of the limited availability of antibodies against site-specific phosphorylated tau, we analyzed only a few tau sites in our study. Despite this, our data indicated that Egr-1 activates Cdk5 and that activated Cdk5 phosphorylates tau at proline-directed sites as well as PP1. PP1 phosphorylation inactivates PP1 (65), thus promoting non-proline-directed tau phosphorylation. Our study revealed a novel Egr-1/Cdk5/PP1 signaling pathway that regulates both proline-directed and non-proline-directed tau phosphorylation in the brain.
GSK3β is another major kinase that phosphorylates tau in the brain (56, 69). In rat brain hippocampus, overexpression of Egr-1 did not enhance GSK3 activity (Fig. 3A). Likewise, inhibitory Ser9 phosphorylation of GSK3β was also not altered by Egr-1 overexpression in rat hippocampus (Fig. 3B). These data indicated that Egr-1 does not influence GSK3β and does not affect GSK3β-catalyzed tau phosphorylation in the brain. However, GSK3β has unique substrate specificity, and it phosphorylates some substrates that are previously phosphorylated (primed) by another kinase (53). Previously, we reported that Cdk5 phosphorylates and primes tau in rat brain, and GSK3β subsequently phosphorylates the Cdk5-phosphorylated tau (58). In the current study, we showed that Egr-1 activates Cdk5, which phosphorylates tau (and perhaps primes for GSK3β) in the brain. Thus, Egr-1 may promote GSK3β-catalyzed tau phosphorylation in vivo, and GSK3β may be a component of the Egr-1/Cdk5/PP1 pathway that regulates tau phosphorylation in the brain.
An earlier study reported that the Egr-1 mRNA level was 4-fold higher in AD brain (15). This study also noted that the Egr-1 level was highest in brain areas that were high in NFT density. A recent study using modern bioinformatics and a larger number of brain samples reported that the Egr-1 mRNA level was prominently increased in AD brain when compared with normal controls (14). In our study, which analyzed well characterized AD brains, we observed that the Egr-1 protein level was significantly higher in both the temporal cortex and hippocampus (supplemental Fig. 1). Moreover, up-regulation of genes such as p53, caspase 3, and TGF-β (16–18, 20–23) and down-regulation of antiapoptotic Bcl-2 (19) have been reported in AD. Egr-1 promotes the expression of p53, caspase 3, and TGF-β (13, 24, 26–29) and binds to and suppresses transcription on the promoter of antiapoptotic Bcl-2 (25). Thus, the increase in Egr-1 that we and others have reported mirrors the regulatory effects of several genes that are also implicated in AD pathogenesis. All of this evidence as well as the data presented in this study together suggest that the increase of Egr-1 in AD triggers aberrant activation of the Egr-1/Cdk5/PP1/GSK3β pathway, contributing to tau hyperphosphorylation and microtubule instability.
To determine the pathological significance of increased Egr-1 expression in AD brain, we overexpressed the human Egr-1 gene in rat brain hippocampus and in primary neurons in culture. We observed that, in the hippocampus, increased expression of Egr-1 activates Cdk5, inactivates PP1, and promotes tau hyperphosphorylation, leading to microtubule instability. In primary neurons in culture, Egr-1 overexpression caused accumulation of hyperphosphorylated tau in somatodendritic compartments and destabilized axonal microtubules. Our data demonstrated that overexpression of Egr-1 causes neurofibrillary degeneration in the brain and suggested that increased Egr-1 levels are involved in the development of AD pathology.
Reducing tau hyperphosphorylation in the brain is one of the therapeutic strategies against AD (1, 2). Cdk5 and GSK3β are the major brain kinases that phosphorylate tau (56, 60). Surprisingly, pharmacological inhibition of Cdk5 in the brain activates GSK3β and increases tau phosphorylation (70). Inhibition of GSK3β has generated mixed results. Lithium, a potent GSK3β inhibitor, reduced tau phosphorylation in transgenic mice expressing human tau containing the FTDP-17-specific P301L mutation (71, 72) but did not show any effect on tau phosphorylation in mice expressing human WT tau (73). More importantly, lithium completely failed to show any beneficial effects in AD patients (74, 75). The molecular basis of these observations is not clear. However, these studies have created concerns about the effectiveness of pharmacological inhibition of Cdk5, GSK3β, or any other kinase for the treatment of AD.
In this study, we showed that tau phosphorylation at both proline-directed and non-proline directed sites is significantly reduced in Egr-1−/− mouse brain. We also showed that in Egr-1−/− brain the activity of Cdk5 is decreased and that of PP1 is increased. Thus, Egr-1 ablation suppresses tau phosphorylation at both proline- and non-proline-directed sites in the brain by down-regulating tau phosphorylation and promoting the tau dephosphorylation processes. Egr-1−/− mice are viable and healthy (11). Inhibition of Egr-1 function in AD brain, therefore, offers a safe strategy to develop drugs to inhibit tau phosphorylation.
Supplementary Material
Acknowledgments
We thank Dr. R. Gilbert of the Biotechnology Research Institute, Montreal, Canada for providing 293SF-PacLV29-6 cells. We also thank Ryen MacDonald for reading the manuscript.
This work was supported by grants from the Canadian Institute for Health Research, Alzheimer's Society of Canada, and Natural Sciences and Engineering Research Council of Canada.

The on-line version of this article (available at http://www.jbc.org) contains supplemental Figs. 1–4 and Table 1.
- AD
- Alzheimer disease
- Cdk5
- cyclin-dependent kinase 5
- Egr-1
- early growth response 1
- NFT
- neurofibrillary tangle
- PHF
- paired helical filament
- PP1
- protein phosphatase 1
- GSK3
- glycogen synthase kinase 3
- NGF
- nerve growth factor
- Ln
- lentivirus
- PP2A
- protein phosphatase 2A
- Tyr-tubulin
- tyrosinated tubulin
- Ac-tubulin
- acetylated tubulin.
REFERENCES
- 1. Brunden K. R., Trojanowski J. Q., Lee V. M. (2009) Nat. Rev. Drug Discov. 8, 783–793 [DOI] [PMC free article] [PubMed] [Google Scholar]
- 2. Hanger D. P., Anderton B. H., Noble W. (2009) Trends Mol. Med. 15, 112–119 [DOI] [PubMed] [Google Scholar]
- 3. Lee V. M., Goedert M., Trojanowski J. Q. (2001) Annu. Rev. Neurosci. 24, 1121–1159 [DOI] [PubMed] [Google Scholar]
- 4. Hardy J., Selkoe D. J. (2002) Science 297, 353–356 [DOI] [PubMed] [Google Scholar]
- 5. Rapoport M., Dawson H. N., Binder L. I., Vitek M. P., Ferreira A. (2002) Proc. Natl. Acad. Sci. U.S.A. 99, 6364–6369 [DOI] [PMC free article] [PubMed] [Google Scholar]
- 6. Roberson E. D., Scearce-Levie K., Palop J. J., Yan F., Cheng I. H., Wu T., Gerstein H., Yu G. Q., Mucke L. (2007) Science 316, 750–754 [DOI] [PubMed] [Google Scholar]
- 7. Kudo T., Imaizumi K., Tanimukai H., Katayama T., Sato N., Nakamura Y., Tanaka T., Kashiwagi Y., Jinno Y., Tohyama M., Takeda M. (2000) Neurobiol. Aging 21, 215–224 [DOI] [PubMed] [Google Scholar]
- 8. Khachigian L. M. (2006) Circ. Res. 98, 186–191 [DOI] [PubMed] [Google Scholar]
- 9. Khachigian L. M., Lindner V., Williams A. J., Collins T. (1996) Science 271, 1427–1431 [DOI] [PubMed] [Google Scholar]
- 10. Yan S. F., Fujita T., Lu J., Okada K., Shan Zou Y., Mackman N., Pinsky D. J., Stern D. M. (2000) Nat. Med. 6, 1355–1361 [DOI] [PubMed] [Google Scholar]
- 11. Knapska E., Kaczmarek L. (2004) Prog. Neurobiol. 74, 183–211 [DOI] [PubMed] [Google Scholar]
- 12. Beckmann A. M., Wilce P. A. (1997) Neurochem. Int. 31, 477–510 [DOI] [PubMed] [Google Scholar]
- 13. Baron V., Adamson E. D., Calogero A., Ragona G., Mercola D. (2006) Cancer Gene Ther. 13, 115–124 [DOI] [PMC free article] [PubMed] [Google Scholar]
- 14. Gómez Ravetti M., Rosso O. A., Berretta R., Moscato P. (2010) PLoS One 5, e10153. [DOI] [PMC free article] [PubMed] [Google Scholar]
- 15. MacGibbon G. A., Lawlor P. A., Walton M., Sirimanne E., Faull R. L., Synek B., Mee E., Connor B., Dragunow M. (1997) Exp. Neurol. 147, 316–332 [DOI] [PubMed] [Google Scholar]
- 16. Hooper C., Meimaridou E., Tavassoli M., Melino G., Lovestone S., Killick R. (2007) Neurosci. Lett. 418, 34–37 [DOI] [PMC free article] [PubMed] [Google Scholar]
- 17. Kitamura Y., Shimohama S., Kamoshima W., Matsuoka Y., Nomura Y., Taniguchi T. (1997) Biochem. Biophys. Res. Commun. 232, 418–421 [DOI] [PubMed] [Google Scholar]
- 18. Louneva N., Cohen J. W., Han L. Y., Talbot K., Wilson R. S., Bennett D. A., Trojanowski J. Q., Arnold S. E. (2008) Am. J. Pathol. 173, 1488–1495 [DOI] [PMC free article] [PubMed] [Google Scholar]
- 19. Rohn T. T., Vyas V., Hernandez-Estrada T., Nichol K. E., Christie L. A., Head E. (2008) J. Neurosci. 28, 3051–3059 [DOI] [PMC free article] [PubMed] [Google Scholar]
- 20. Town T., Laouar Y., Pittenger C., Mori T., Szekely C. A., Tan J., Duman R. S., Flavell R. A. (2008) Nat. Med. 14, 681–687 [DOI] [PMC free article] [PubMed] [Google Scholar]
- 21. van der Wal E. A., Gómez-Pinilla F., Cotman C. W. (1993) Neuroreport 4, 69–72 [DOI] [PubMed] [Google Scholar]
- 22. Wyss-Coray T., Lin C., Yan F., Yu G. Q., Rohde M., McConlogue L., Masliah E., Mucke L. (2001) Nat. Med. 7, 612–618 [DOI] [PubMed] [Google Scholar]
- 23. Wyss-Coray T., Masliah E., Mallory M., McConlogue L., Johnson-Wood K., Lin C., Mucke L. (1997) Nature 389, 603–606 [DOI] [PubMed] [Google Scholar]
- 24. Cho S. J., Kang M. J., Homer R. J., Kang H. R., Zhang X., Lee P. J., Elias J. A., Lee C. G. (2006) J. Biol. Chem. 281, 8161–8168 [DOI] [PubMed] [Google Scholar]
- 25. Huang R. P., Fan Y., Peng A., Zeng Z. L., Reed J. C., Adamson E. D., Boynton A. L. (1998) Int. J. Cancer 77, 880–886 [DOI] [PubMed] [Google Scholar]
- 26. Krones-Herzig A., Adamson E., Mercola D. (2003) Proc. Natl. Acad. Sci. U.S.A. 100, 3233–3238 [DOI] [PMC free article] [PubMed] [Google Scholar]
- 27. Liu C., Adamson E., Mercola D. (1996) Proc. Natl. Acad. Sci. U.S.A. 93, 11831–11836 [DOI] [PMC free article] [PubMed] [Google Scholar]
- 28. Liu J., Grogan L., Nau M. M., Allegra C. J., Chu E., Wright J. J. (2001) Int. J. Oncol. 18, 863–870 [DOI] [PubMed] [Google Scholar]
- 29. Zagurovskaya M., Shareef M. M., Das A., Reeves A., Gupta S., Sudol M., Bedford M. T., Prichard J., Mohiuddin M., Ahmed M. M. (2009) Oncogene 28, 1121–1131 [DOI] [PubMed] [Google Scholar]
- 30. Harada T., Morooka T., Ogawa S., Nishida E. (2001) Nat. Cell Biol. 3, 453–459 [DOI] [PubMed] [Google Scholar]
- 31. Li T., Chalifour L. E., Paudel H. K. (2007) J. Biol. Chem. 282, 6619–6628 [DOI] [PubMed] [Google Scholar]
- 32. Dhavan R., Tsai L. H. (2001) Nat. Rev. Mol. Cell Biol. 2, 749–759 [DOI] [PubMed] [Google Scholar]
- 33. Lee K. Y., Clark A. W., Rosales J. L., Chapman K., Fung T., Johnston R. N. (1999) Neurosci. Res. 34, 21–29 [DOI] [PubMed] [Google Scholar]
- 34. Masliah E., Mallory M., Alford M., Tanaka S., Hansen L. A. (1998) J. Neuropathol. Exp. Neurol. 57, 1041–1052 [DOI] [PubMed] [Google Scholar]
- 35. Su J. H., Anderson A. J., Cummings B. J., Cotman C. W. (1994) Neuroreport 5, 2529–2533 [DOI] [PubMed] [Google Scholar]
- 36. Begum A. N., Jones M. R., Lim G. P., Morihara T., Kim P., Heath D. D., Rock C. L., Pruitt M. A., Yang F., Hudspeth B., Hu S., Faull K. F., Teter B., Cole G. M., Frautschy S. A. (2008) J. Pharmacol. Exp. Ther. 326, 196–208 [DOI] [PMC free article] [PubMed] [Google Scholar]
- 37. Frautschy S. A., Hu W., Kim P., Miller S. A., Chu T., Harris-White M. E., Cole G. M. (2001) Neurobiol. Aging 22, 993–1005 [DOI] [PubMed] [Google Scholar]
- 38. Garcia-Alloza M., Borrelli L. A., Rozkalne A., Hyman B. T., Bacskai B. J. (2007) J. Neurochem. 102, 1095–1104 [DOI] [PubMed] [Google Scholar]
- 39. Ishrat T., Hoda M. N., Khan M. B., Yousuf S., Ahmad M., Khan M. M., Ahmad A., Islam F. (2009) Eur. Neuropsychopharmacol. 19, 636–647 [DOI] [PubMed] [Google Scholar]
- 40. Lim G. P., Chu T., Yang F., Beech W., Frautschy S. A., Cole G. M. (2001) J. Neurosci. 21, 8370–8377 [DOI] [PMC free article] [PubMed] [Google Scholar]
- 41. Ma Q. L., Yang F., Rosario E. R., Ubeda O. J., Beech W., Gant D. J., Chen P. P., Hudspeth B., Chen C., Zhao Y., Vinters H. V., Frautschy S. A., Cole G. M. (2009) J. Neurosci. 29, 9078–9089 [DOI] [PMC free article] [PubMed] [Google Scholar]
- 42. Park S. Y., Kim H. S., Cho E. K., Kwon B. Y., Phark S., Hwang K. W., Sul D. (2008) Food Chem. Toxicol. 46, 2881–2887 [DOI] [PubMed] [Google Scholar]
- 43. Yang F., Lim G. P., Begum A. N., Ubeda O. J., Simmons M. R., Ambegaokar S. S., Chen P. P., Kayed R., Glabe C. G., Frautschy S. A., Cole G. M. (2005) J. Biol. Chem. 280, 5892–5901 [DOI] [PubMed] [Google Scholar]
- 44. Chen A., Xu J., Johnson A. C. (2006) Oncogene 25, 278–287 [DOI] [PubMed] [Google Scholar]
- 45. Giri R. K., Rajagopal V., Kalra V. K. (2004) J. Neurochem. 91, 1199–1210 [DOI] [PubMed] [Google Scholar]
- 46. Giri R. K., Rajagopal V., Shahi S., Zlokovic B. V., Kalra V. K. (2005) Am. J. Physiol. Cell Physiol. 289, C264–C276 [DOI] [PubMed] [Google Scholar]
- 47. Han S. S., Chung S. T., Robertson D. A., Ranjan D., Bondada S. (1999) Clin. Immunol. 93, 152–161 [DOI] [PubMed] [Google Scholar]
- 48. Moon Y., Glasgow W. C., Eling T. E. (2005) J. Pharmacol. Exp. Ther. 315, 788–795 [DOI] [PubMed] [Google Scholar]
- 49. Pendurthi U. R., Rao L. V. (2000) Thromb. Res. 97, 179–189 [DOI] [PubMed] [Google Scholar]
- 50. Pendurthi U. R., Williams J. T., Rao L. V. (1997) Arterioscler. Thromb. Vasc. Biol. 17, 3406–3413 [DOI] [PubMed] [Google Scholar]
- 51. Broussau S., Jabbour N., Lachapelle G., Durocher Y., Tom R., Transfiguracion J., Gilbert R., Massie B. (2008) Mol. Ther. 16, 500–507 [DOI] [PubMed] [Google Scholar]
- 52. Schipper H. M., Agarwal-Mawal A., Paudel H. K. (1999) Neuroscience 93, 585–595 [DOI] [PubMed] [Google Scholar]
- 53. Li T., Paudel H. K. (2006) Biochemistry 45, 3125–3133 [DOI] [PubMed] [Google Scholar]
- 54. Han D., Qureshi H. Y., Lu Y., Paudel H. K. (2009) J. Biol. Chem. 284, 13422–13433 [DOI] [PMC free article] [PubMed] [Google Scholar]
- 55. Paudel H. K. (1997) J. Biol. Chem. 272, 28328–28334 [DOI] [PubMed] [Google Scholar]
- 56. Sun W., Qureshi H. Y., Cafferty P. W., Sobue K., Agarwal-Mawal A., Neufield K. D., Paudel H. K. (2002) J. Biol. Chem. 277, 11933–11940 [DOI] [PubMed] [Google Scholar]
- 57. Paudel H. K. (1997) J. Biol. Chem. 272, 1777–1785 [PubMed] [Google Scholar]
- 58. Li T., Hawkes C., Qureshi H. Y., Kar S., Paudel H. K. (2006) Biochemistry 45, 3134–3145 [DOI] [PubMed] [Google Scholar]
- 59. Seubert P., Mawal-Dewan M., Barbour R., Jakes R., Goedert M., Johnson G. V., Litersky J. M., Schenk D., Lieberburg I., Trojanowski J. Q., Lee V. M. (1995) J. Biol. Chem. 270, 18917–18922 [DOI] [PubMed] [Google Scholar]
- 60. Sobue K., Agarwal-Mawal A., Li W., Sun W., Miura Y., Paudel H. K. (2000) J. Biol. Chem. 275, 16673–16680 [DOI] [PubMed] [Google Scholar]
- 61. Qi Z., Huang Q. Q., Lee K. Y., Lew J., Wang J. H. (1995) J. Biol. Chem. 270, 10847–10854 [DOI] [PubMed] [Google Scholar]
- 62. Paudel H. K., Lew J., Ali Z., Wang J. H. (1993) J. Biol. Chem. 268, 23512–23518 [PubMed] [Google Scholar]
- 63. Gong C. X., Lidsky T., Wegiel J., Zuck L., Grundke-Iqbal I., Iqbal K. (2000) J. Biol. Chem. 275, 5535–5544 [DOI] [PubMed] [Google Scholar]
- 64. Liao H., Li Y., Brautigan D. L., Gundersen G. G. (1998) J. Biol. Chem. 273, 21901–21908 [DOI] [PubMed] [Google Scholar]
- 65. Liu C. W., Wang R. H., Dohadwala M., Schönthal A. H., Villa-Moruzzi E., Berndt N. (1999) J. Biol. Chem. 274, 29470–29475 [DOI] [PubMed] [Google Scholar]
- 66. Merrick S. E., Trojanowski J. Q., Lee V. M. (1997) J. Neurosci. 17, 5726–5737 [DOI] [PMC free article] [PubMed] [Google Scholar]
- 67. Alonso A. C., Zaidi T., Grundke-Iqbal I., Iqbal K. (1994) Proc. Natl. Acad. Sci. U.S.A. 91, 5562–5566 [DOI] [PMC free article] [PubMed] [Google Scholar]
- 68. Morishima-Kawashima M., Hasegawa M., Takio K., Suzuki M., Yoshida H., Titani K., Ihara Y. (1995) J. Biol. Chem. 270, 823–829 [DOI] [PubMed] [Google Scholar]
- 69. Lucas J. J., Hernández F., Gómez-Ramos P., Morán M. A., Hen R., Avila J. (2001) EMBO J. 20, 27–39 [DOI] [PMC free article] [PubMed] [Google Scholar]
- 70. Wen Y., Planel E., Herman M., Figueroa H. Y., Wang L., Liu L., Lau L. F., Yu W. H., Duff K. E. (2008) J. Neurosci. 28, 2624–2632 [DOI] [PMC free article] [PubMed] [Google Scholar]
- 71. Caccamo A., Oddo S., Tran L. X., LaFerla F. M. (2007) Am. J. Pathol. 170, 1669–1675 [DOI] [PMC free article] [PubMed] [Google Scholar]
- 72. Noble W., Planel E., Zehr C., Olm V., Meyerson J., Suleman F., Gaynor K., Wang L., LaFrancois J., Feinstein B., Burns M., Krishnamurthy P., Wen Y., Bhat R., Lewis J., Dickson D., Duff K. (2005) Proc. Natl. Acad. Sci. U.S.A. 102, 6990–6995 [DOI] [PMC free article] [PubMed] [Google Scholar]
- 73. Nakashima H., Ishihara T., Suguimoto P., Yokota O., Oshima E., Kugo A., Terada S., Hamamura T., Trojanowski J. Q., Lee V. M., Kuroda S. (2005) Acta. Neuropathol. 110, 547–556 [DOI] [PubMed] [Google Scholar]
- 74. Dunn N., Holmes C., Mullee M. (2005) Alzheimer Dis. Assoc. Disord. 19, 20–22 [DOI] [PubMed] [Google Scholar]
- 75. Hampel H., Ewers M., Bürger K., Annas P., Mörtberg A., Bogstedt A., Frölich L., Schröder J., Schönknecht P., Riepe M. W., Kraft I., Gasser T., Leyhe T., Möller H. J., Kurz A., Basun H. (2009) J. Clin. Psychiatry 70, 922–931 [PubMed] [Google Scholar]
Associated Data
This section collects any data citations, data availability statements, or supplementary materials included in this article.