Abstract
Background/Aims
Glomerular lesions in diabetic nephropathy (DN) have been studied in numerous murine diabetic models, but the critical feature of aging is often absent. Since histopathology indicates that in mice, DN glomerular lesions may just begin to develop at about 5 months of age, we utilized the long-lived OVE26 transgenic diabetic model for stereometric analyses of DN glomerulopathic aging.
Methods
Albuminuria was determined by ELISA, and transmission electron microscopy stereometry was utilized exclusively to demonstrate changes in glomerular cell density and number, and alterations in the glomerular filtration barrier in OVE26 mice at 60, 150, and 450 days of age.
Results
Compared to age-matched controls, albuminuria in diabetic mice is significant at 60 days. At 150 days, glomerular volume and mesangial, endothelial and total cell numbers, and podocyte effacement are significantly increased, while podocyte, endothelial, and total cell density are significantly decreased. Endothelial fenestrations are decreased, and glomerular basement membrane thickness is increased. At 450 days, stereometric alterations are exacerbated.
Conclusion
Our data indicate that in OVE26 mice, albuminuria precedes morphological glomerular lesions and could be due to early-onset hyperglycemia. Moreover, in this model, most DN glomerulopathic lesions occur relatively late in life, and it is possible that they may result from prolonged hyperglycemia-induced oxidative stress.
Key Words: Diabetic nephropathy, Electron microscopy, Glomerular cells, Glomerular filtration barrier, Transgenic diabetic mice
Introduction
Diabetic nephropathy (DN) is the leading cause of end-stage renal disease [1] and accounts for the greatest percentage of the costs of diabetic clinical care. Although the basic mechanisms of DN have not been clearly elucidated to date, the pathogenesis of this disease has been clarified substantively by utilizing numerous hyperglycemic animal models. Although none exhibit the full array of human DN features, in many of these models renal disease has been well characterized. A major problem, however, is that most models are short-lived and display features consistent with the earliest phase of DN.
The OVE26 transgenic diabetic mouse model is a particularly valuable model of advanced human DN. Importantly, these mice frequently live 15 months or longer, and exhibit a wide array of functional [2] and morphological chronic complications of human DN [2,3,4,5]. Although OVE26 mice are long-lived models of DN, interestingly, they manifest by far the most profound urinary albumin excretion (UAE) of any available mouse line [6].
While morphological studies of DN have been carried out previously in OVE26 mice, stereometric analyses of glomerular histopathological progression and the critical feature of aging in this long-lived DN model are absent. Moreover, specific changes in the glomerular filtration barrier (GFB) in the oldest OVE26 animals have not been reported.
Accordingly, the current study was designed to utilize unbiased stereometric light- and electron-microscopic morphometry methods to describe the effect of diabetes on glomerular histoarchitectural modifications in aging OVE26 and age-matched FVB control mice.
Methods
OVE26 mice on the FVB background have been maintained for 17 years in the laboratory of Dr. Paul Epstein at the University of North Dakota and the University of Louisville. At least 5 animals of each age and type were utilized in each of the experimental procedures carried out in this study. All animal procedures adhered to the guidelines of the NIH Guide for the Care and Use of Laboratory Animals and were approved by the IACUC committees of the University of North Dakota and the University of Louisville.
Urinary Albumin Excretion
All mice were individually housed in metabolic cages for 24 h with access to food and water. UAE was measured as described by Xu et al. [6].
Tissue Preparation and Microscopic Technique
Prior to sacrifice, OVE26 diabetic and age-matched FVB control mice were weighed, non-fasted blood glucose levels were determined by Lifescan glucometer, and HbA1c was quantified using an A1CNow+ kit (Bayer HealthCare). All animals were sacrificed by vascular perfusion with Karnovsky's [7] or PIPES fixative [10] and prepared for transmission electron microscopy (TEM) as previously described [5].
Glomerular Morphometry
Glomerular volume (VG), glomerular cell density (NV), and cell number/glomerulus (N) were calculated as previously described [5] using epoxy renal tissue blocks (69 in total) from at least 5 animals per age and type (table 1).
Table 1.
Number of epoxy blocks and glomerular profiles photographed for mean glomerular profile area, VG and N calculations
| Genotype | Age days | Animals n | Blocks sectioned n | For calculation of VG |
For calculation of N |
||
|---|---|---|---|---|---|---|---|
| total light microscopy glomerular profiles per animal | total light microscopy glomerular profiles | total TEM glomerular profiles per animal | total TEM glomerular profiles | ||||
| FVB | 60 | 5 | 14 | 19–36 | 140 | 1–4 | 21 |
| OVE26 | 60 | 5 | 12 | 15–36 | 129 | 1–3 | 17 |
| FVB | 150 | 5 | 7 | 15–39 | 140 | 1–2 | 13 |
| OVE26 | 150 | 5 | 13 | 17–18 | 87 | 2–3 | 19 |
| FVB | 450 | 5 | 11 | 15–56 | 142 | 1–4 | 13 |
| OVE26 | 450 | 6 | 12 | 15–20 | 106 | 1–3 | 15 |
| Total | 31 | 69 | 744 | 98 | |||
Glomerular Filtration Barrier
The fractional surface of fenestrated capillary luminal coverage(endothelial fenestrated area; EFA) was determined by a modification of the method of Toyoda et al. [9]. For ease of measurement, non-fenestrated endothelium was demarcated along predetermined lengths of peripheral glomerular basement membrane (PGBM, i.e. GBM covered by both podocytes and endothelial cells) on 10–18 groups of 20 TEM micrographs from at least 5 animals of each age and type. ImageJ was used to measure PGBM and non-fenestrated sections. A percentage of non-fenestrated endothelium was determined for each micrograph by dividing the total PGBM length by the sum of non-fenestrated lengths. Mean EFA was calculated by subtracting the non-fenestrated percentage from 100%.
GBM thicknesswas determined by a modification of the orthogonal intercept method[4]. Approximately 1,200 GBM measurements were performed on TEM micrographs from at least 5 animals of each age and type.
Podocyte foot process width (FPW) was calculated on TEM micrographs of at least 5 animals of each age and type as previously described [11]. Mean FPW ± SD was determined from the reciprocal of the number of foot processes per micrometer of GBM.
Statistics
Data from diabetic and age-matched control mice were analyzed as previously described [5]. One-way analysis of variance (ANOVA) and the nonparametric Kruskal-Wallis analysis of variance on ranks were used to compare aging data for each mouse type.
Results
General Condition of OVE26 and FVB Mice
Early weight gain trends were similar in FVB and OVE26 animals (table 2). However, the oldest diabetic mice were significantly smaller than age-matched controls. In all age groups, OVE26 kidney weights and blood glucose levels were significantly higher than in controls (table 2). Although OVE26 mice were hyperglycemic (288 mg/dl) by 60 days, levels increased significantly with age, and the levels in the oldest diabetics commonly exceeded 600 mg/dl. OVE26 mice exhibited significantly higher HbA1c levels than age-matched controls in all age groups (table 2).
Table 2.
Mean body weight, kidney weight, blood glucose and HbAlc in FVB and OVE26 mice (±SD)
| Age | Body weight, g |
Kidney weight, g |
Blood glucose, mg/dl |
HbAlc, % |
||||
|---|---|---|---|---|---|---|---|---|
| FVB | OVE26 | FVB | OVE26 | FVB | OVE26 | FVB | OVE26 | |
| 60 days | 23.7 ±2.5 | 20.3 ±2.3 | 0.25 ±0.06 | 0.31 ±0.07* | 122 ±7 | 288 ±69* | 4.4 ±0.1 | 8.4±1.1* |
| 150 days | 25.7±1.6 | 24.8 ±1.0 | 0.24 ±0.07 | 0.47 ±0.09* | 118± 15 | 464 ± 78* | 4.1 ±0.1 | 9.6 ±1.0* |
| 450 days | 31.4±4.1 | 26.4±3.1* | 0.31 ±0.04 | 0.47 ±0.07* | 111 ± 17 | 396 ±51* | 4.1 ±0.1 | 9.9 ±1.3* |
p < 0.05 vs. age-matched FVB.
Urinary Albumin Excretion
Due to the substantial differences in FVB and OVE26 UAE levels, log values of micrograms per 24 h were reported (table 3). OVE26 mice were profoundly albuminuric at all ages.
Table 3.
Urine volumes and UAE in FVB and OVE26 mice (±SD)
| Age | Urine volume, ml/24 h |
UAE, log of μg/24 h |
||
|---|---|---|---|---|
| FVB | OVE26 | FVB | OVE26 | |
| 60 days | 1.7± 1.0 | 28.9 ±6.9* | 2.51 ±0.21 | 3.40 ±0.25* |
| 150 days | 1.5 ±0.5 | 45.7±6.1* | 2.57 ±0.26 | 5.23 ±0.51* |
| 450 days | 2.3 ±1.4 | 35.6 ±4.3* | 2.46 ±0.25 | 4.70 ±0.35* |
p < 0.05 vs. age-matched FVB.
Glomerular Morphometry
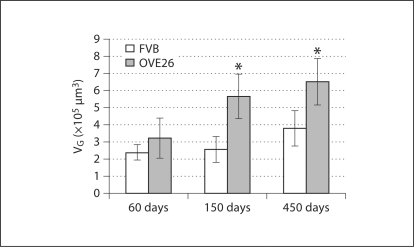
Glomerular Volume. FVB and OVE26 mice exhibited significantly increased VG from 60 to 450 days of age (∼59 and ∼101%, respectively; fig. 1). VG was significantly greater in the OVE26 mice than in age-matched controls at 150 and 450 days of age.
Fig. 1.
VG (±SD). * p < 0.05 vs. age-matched FVB.
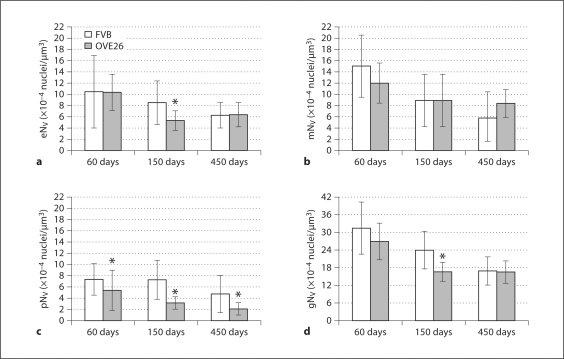
Glomerular Cell Density. FVB and OVE26 mice demonstrated a significant decrease in endothelial NV (eNV) between 60 and 450 days of age, and at 150 days eNV was significantly lower in OVE26 mice (fig. 2a). Mesangial NV (mNV)decreased significantly by 450 days of age (fig. 2b) in both FVB and OVE26 mice, though there were no significant differences between mouse types at any age. Likewise, podocyte NV (pNV) decreased significantly (∼55%) in aging control animals (fig. 2c). OVE26 mice exhibited an even greater (∼158%) decrease in pNV, which was significantly less than in FVB mice at all ages. Total NV (gNV) declined significantly in FVB mice with increasing age (fig. 2d). In OVE26 mice, gNV was significantly decreased at 150 days and then remained constant (∼16.5 × 10⁻⁴/μm3) to 450 days of age, at which time gNV in FVB and OVE26 mice were nearly identical.
Fig. 2.
Endothelial (a), mesangial (b), podocyte (c), and total glomerular (d) cell density (±SD). * p < 0.05 vs. age-matched FVB.
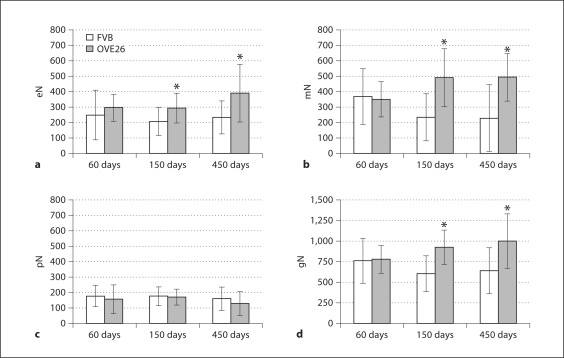
Cell Number/Glomerulus. Between 60 and 150 days, endothelial cells/glomerulus (eN) in FVB and OVE26 mice remained nearly constant (fig. 3a). However, by 450 days, in diabetic mice eN was nearly double that of controls. In contrast, mesangial cells/glomerulus (mN) in control mice fell by ∼61% with age (fig. 3b). However, in OVE26 mice, mN increased significantly and by 450 days exceeded controls by ∼109%. As reported by Teiken et al. [5], podocytes/glomerulus (pN) in aging FVB animals was quite stable (fig. 3c). Although pN was not markedly different between OVE26 and FVB mice at any age, the greatest difference was in the 450 day-old diabetics, where pN was ∼24% less than in controls. Total cells/glomerulus (gN) in control animals decreased slightly (∼19%) with age (fig. 3d) and increased by ∼28% in diabetics. Accordingly, gN in the oldest OVE26 mice exceeded controls by ∼56% (∼360 cells).
Fig. 3.
Endothelial (a), mesangial (b), podocyte (c), and total glomerular (d) cell numbers per glomerulus ± SD. * p < 0.05 vs. age-matched FVB.
Glomerular Filtration Barrier
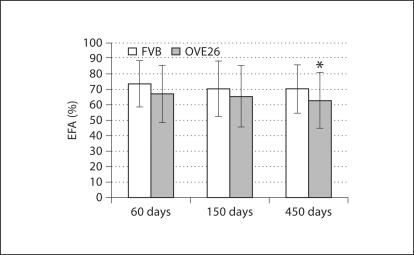
Endothelial Fenestrated Area. EFA differences in FVB and OVE26 mice were not significant in 60- or 150-day-old animals (fig. 4). However, with age OVE26 animals showed progressively reduced EFA. At 450 days of age, significant differences were evident in FVB and OVE26 mice, and in diabetic animals EFA was ∼12% less than in controls.
Fig. 4.
Percent fenestrated endothelium (±SD). * p < 0.05 vs. age-matched FVB.
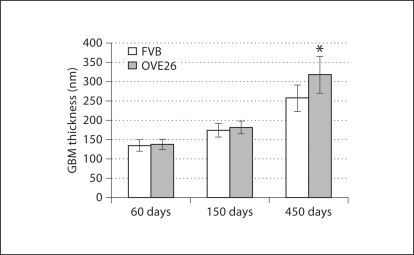
GBM Thickness. Somewhat unexpectedly, control animals showed substantially increased GBM thickness with a total increase of ∼92% between 60 and 450 days (fig. 5). OVE26 mice showed a similar trend with a ∼75% increase between 150 and 450 days and a total thickness increase of ∼131% between 60 and 450 days.
Fig. 5.
GBM thickness (±SD). * p < 0.05 vs. age-matched FVB.
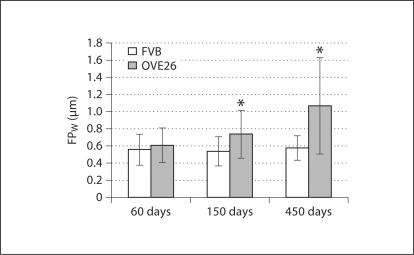
Podocyte Foot Process Width. In control mice FPW remained relatively constant (0.56–0.58 μm; fig. 6). In OVE26 mice, however, FPW increased ∼21% between 60 and 150 days of age and by 450 days was 1.07 μm or nearly twice that of controls.
Fig. 6.
FPW (±SD). * p < 0.05 vs. age-matched FVB.
Discussion
OVE26 diabetic mice are particularly valuable because they consistently demonstrate numerous features of advanced human DN [2,3,10]. Moreover, these mice live >450 days and therefore are well suited to the current study of aging diabetic glomeruli. The current study shows that OVE26 mice mimic nephromegaly of human DN. By 150 days of age, kidney weights exceed controls by ∼79%, but like their human counterparts [11], body weights in diabetics and age-matched controls are not markedly different. In addition, albuminuria is a well-known clinical hallmark of human diabetes mellitus [11], and OVE26 mice exhibit by far the most profound UAE of any murine model of diabetes [6].
The current investigation focuses on morphometry of aging glomerular cells and components of the GFB. Our data indicate that by 150 days VG in diabetic mice is significantly increased over controls. Moreover, we demonstrate for the first time that increased VG coincides with significantly decreased eNV, pNV, and gNV. Since N is dependent on VG and NV, the diabetic increase in VG may trigger endothelial/mesangial cell proliferation in OVE26 mice. Similarly, Steffes et al. [12] concluded that in diabetic patients, increased VG was a major determinant of glomerular cell number. Since eN, mN and gN are increased later than UAE, they probably do not initiate albuminuria.
Recently, dystrophic or GFB components (endothelial cells, GBMs, and podocytes) have been examined in an effort to clarify the basic mechanisms of DN [5,9,13]. For example, Toyoda et al. [9] concluded that reduced glomerular capillary EFA in human DN correlated positively with the severity of glomerulopathy. In the present study, decreased EFA correlated with significant albuminuria in the oldest OVE26 mice and not with UAE onset. Likewise, OVE26 GBMs were not substantially widened or otherwise altered at 60 days of age when OVE26 mice initiate significant albuminuria.
Since microalbuminuria is accompanied by podocyte damage in human DN, podocyte effacement or loss have been considered critical parameters in the UAE process [9,10,13,14,15]. In the present study, however, FPW was similar in OVE26 and FVB mice at 60 days of age, and at 150 days diabetics showed only a slight (∼11%) increase over controls. However, at 450 days FPW in OVE26 mice exceeded controls by ∼95%, though the increased FPW did not correlate with UAE onset.
Because most morphometric changes occur relatively late in the course of OVE26 DN, it seems likely that they may be preceded by early nephropathic sequelae. For example, podocyte effacement, which is often viewed as a harbinger of podocyte loss, could be preceded by dystrophic intracellular signaling [15]. It seems possible that in DN, slit membrane disruption could be initiated by glucose-induced reactive oxygen species [16] leading to increased GFB permeability in advance of demonstrable effacement. A similar intracellular mechanism could potentially explain the intense UAE prior to significant cellular proliferation or GFB alterations in the OVE26 mouse.
In summary, our results from the aging OVE26 mouse indicate that profound albuminuria precedes significant morphological changes in the glomerulus. The model suggests that early hyperglycemia may be a major factor in the induction of molecular changes leading to the initiation of early, profound, and sustained albuminuria. It is also possible that subsequent cellular proliferation or loss, and histopathological changes in the GFB may be downstream structural manifestations of these DN molecular sequelae.
Disclosure Statement
The authors declare that they have no conflicts of interest.
Acknowledgements
We gratefully acknowledge the superb electron-microscopic technical assistance of Donna Laturnus. The work was supported in part by grants RO1DK072032, COBRE P20 RR024489, Juvenile Diabetes Research Foundation Grant 1-200-88, and funding from the Lions of North Dakota.
References
- 1.Teutsch S, Newman J, Eggers P. The problem of diabetic renal failure in the United States: an overview. Am J Kidney Dis. 1989;13:11–13. doi: 10.1016/s0272-6386(89)80106-4. [DOI] [PubMed] [Google Scholar]
- 2.Zheng S, Noonan WT, Metreveli NS, Coventry S, Kralik PM, Carlson EC, Epstein PN. Development of late-stage diabetic nephropathy in OVE26 diabetic mice. Diabetes. 2004;53:3248–3257. doi: 10.2337/diabetes.53.12.3248. [DOI] [PubMed] [Google Scholar]
- 3.Carlson EC, Audette JL, Klevay LM, Nguyen H, Epstein PN. Ultrastructural and functional analyses of nephropathy in calmodulin-induced diabetic transgenic mice. Anat Rec. 1997;247:9–19. doi: 10.1002/(SICI)1097-0185(199701)247:1<9::AID-AR2>3.0.CO;2-W. [DOI] [PubMed] [Google Scholar]
- 4.Carlson EC, Audette JL, Veitenheimer NJ, Risan JA, Laturnus DI, Epstein PN. Ultrastructural morphometry of capillary basement membrane thickness in normal and transgenic diabetic mice. Anat Rec. 2003;271:332–341. doi: 10.1002/ar.a.10038. [DOI] [PubMed] [Google Scholar]
- 5.Teiken JM, Audettey JL, Laturnus DI, Zheng S, Epstein PN, Carlson EC. Podocyte loss in aging OVE26 diabetic mice. Anat Rec (Hoboken) 2008;291:114–1121. doi: 10.1002/ar.20625. [DOI] [PubMed] [Google Scholar]
- 6.Xu J, Huang Y, Li F, Zheng S, Epstein PN. FVB mouse genotype confers susceptibility to OVE26 diabetic albuminuria. Am J Physiol Renal Physiol. 2010;299:F487–F494. doi: 10.1152/ajprenal.00018.2010. [DOI] [PMC free article] [PubMed] [Google Scholar]
- 7.Karnovsky MJ. A formaldehyde-glutaraldehyde fixative of high osmolality for use in electron microscopy. J Cell Biol. 1965;27:137A–138A. [Google Scholar]
- 8.Baur PS, Stacey TR. The use of PIPES buffer in the fixation of mammalian and marine tissues for electron microscopy. J Microsc. 1977;109:315–327. doi: 10.1111/j.1365-2818.1977.tb01145.x. [DOI] [PubMed] [Google Scholar]
- 9.Toyoda M, Najafian B, Kim Y, Caramori ML, Mauer M. Podocyte detachment and reduced glomerular capillary endothelial fenestration in human type 1 diabetic nephropathy. Diabetes. 2007;56:2155–2160. doi: 10.2337/db07-0019. [DOI] [PubMed] [Google Scholar]
- 10.Zheng S, Carlson EC, Yang L, Kralik PM, Huang Y, Epstein PN. Podocyte-specific overexpression of the antioxidant metallothionein reduces diabetic nephropathy. J Am Soc Nephrol. 2008;19:2077–2085. doi: 10.1681/ASN.2007080967. [DOI] [PMC free article] [PubMed] [Google Scholar]
- 11.Viberti G, Wiseman MJ, Pinto JR, Messent J. Diabetic nephropathy. In: Kahn CR, Weir GC, editors. Joslin's Diabetes Mellitus. 13th ed. Philadelphia: Lea and Febiger; 1994. pp. 691–737. [Google Scholar]
- 12.Steffes MW, Osterby R, Chavers B, Mauer SM. Mesangial expansion as a central mechanism for loss of kidney function in diabetic patients. Diabetes. 1989;38:1077–1081. doi: 10.2337/diab.38.9.1077. [DOI] [PubMed] [Google Scholar]
- 13.Ellis EN, Steffes MW, Chavers B, Mauer SM. Observations of glomerular epithelial cell structure in patients with type I diabetes mellitus. Kidney Int. 1987;32:736–741. doi: 10.1038/ki.1987.268. [DOI] [PubMed] [Google Scholar]
- 14.Marshall SM. The podocyte: a major player in the development of diabetic nephropathy? Horm Metab Res. 2005;37(suppl 1):9–16. doi: 10.1055/s-2005-861397. [DOI] [PubMed] [Google Scholar]
- 15.Shankland SJ. The podocyte's response to injury: role in proteinuria and glomerulosclerosis. Kidney Int. 2006;69:2131–2147. doi: 10.1038/sj.ki.5000410. [DOI] [PubMed] [Google Scholar]
- 16.Susztak K, Raff AC, Schiffer M, Böttinger EP. Glucose-induced reactive oxygen species cause apoptosis of podocytes and podocyte depletion at the onset of diabetic nephropathy. Diabetes. 2006;55:225–233. [PubMed] [Google Scholar]


