

Abstract
Recent stimulation studies in monkeys and humans have shown strong interactions between ventral premotor cortex (area F5) and the hand area of primary motor cortex (M1). These short-latency interactions usually involve facilitation from F5 of M1 outputs to hand muscles, although suppression has also been reported. This study, performed in three awake macaque monkeys, sought evidence that these interactions could be mediated by short-latency excitatory and inhibitory responses of single M1 neurons active during grasping tasks. We recorded responses of these M1 neurons to single low-threshold (≤40 μA) intracortical microstimuli delivered to F5 sites at which grasp-related neurons were recorded. In 29 sessions, we tested 232 M1 neurons with stimuli delivered to between one and four sites in F5. Of the 415 responses recorded, 142 (34%) showed significant effects. The most common type of response was pure excitation (53% of responses), with short latency (1.8–3.0 ms) and brief duration (∼1 ms); purely inhibitory responses had slightly longer latencies (2–5 ms) and were of small amplitude and longer duration (5–7 ms). They accounted for 13% of responses, whereas mixed excitation then inhibition was seen in 34%. Remarkably, a rather similar set of findings applied to 280 responses of 138 F5 neurons to M1 stimulation; 109 (34%) responses showed significant effects. Thus, with low-intensity stimuli, the dominant interaction between these two cortical areas is one of short-latency, brief excitation, most likely mediated by reciprocal F5–M1 connections. Some neurons were tested with stimuli at both 20 and 40 μA; inhibition tended to dominate at the higher intensity.
Introduction
A key component of the cortical and subcortical grasp networks responsible for visuomotor transformations during reach-to-grasp movements (Matelli et al., 1998; Rizzolatti and Luppino, 2001; Grafton, 2010) is the “visuomotor grasping circuit,” first proposed by Jeannerod et al. (1995). This links anterior intraparietal area (AIP) in the intraparietal sulcus to area F5 in the ventral premotor cortex (PMv), which in turn projects onto the hand representation of the primary motor cortex (M1), which gives rise to many corticospinal projections influencing hand muscles.
Neurons in the parietal AIP and frontal F5 areas discharge during grasp of objects of different shapes with some selectivity for grasp of a given object (Taira et al., 1990; Murata et al., 1997, 2000; Raos et al., 2006; Umilta et al., 2007). Overall, neurons in AIP are more responsive to observation of objects, whereas in F5 a high proportion of neurons are related to the motor goal and to active grasp. Within the hand representation of M1, grasp-related activity is common and related to the activation of the distal arm and hand muscles for movement execution (Umilta et al., 2007).
Recent stimulation studies have demonstrated powerful F5–M1 interactions. In the anesthetized monkey, single stimuli delivered to F5 facilitates late corticospinal volleys (indirect or I-waves) evoked by the stimulation of M1 (Shimazu et al., 2004), and this augments the short-latency motor output to the hand muscles generated from M1 (Cerri et al., 2003). Prabhu et al. (2009) demonstrated that this interaction is present in the awake monkey and is grasp specific. Parallel transcranial magnetic stimulation (TMS) experiments in human subjects have also demonstrated grasp-specific interactions between PMv and M1 (Davare et al., 2008, 2009, 2010).
Interactions between different parts of the cortical grasp network are probably mediated by dense reciprocal long-range corticocortical connections (Pandya and Kuypers, 1969; Jeannerod et al., 1995; Rizzolatti and Luppino, 2001). Dense inputs to the digit representation in M1 originate from the digit representations in PMv and dorsal premotor cortex (Muakkassa and Strick, 1979; Dum and Strick, 2002, 2005), and Godschalk et al. (1984) showed that neurons in the ventral premotor cortex (“peri-arcuate area”) could be antidromically activated at short latency from the ipsilateral M1 hand area. Stimulation of premotor areas can augment corticospinal I-wave activity from M1 (Patton and Amassian, 1954; Amassian et al., 1987; Ghosh and Porter, 1988). In the sedated monkey, Tokuno and Nambu (2000) showed that strong (100–500 μA) single-pulse stimulation in PMv evoked either pure inhibition or early excitation, followed by a prolonged inhibition (duration of ≈100 ms) of discharge in M1 pyramidal tract neurons. In general, inhibition dominated these responses.
Thus, although all of the above neurophysiological studies have provided evidence of F5–M1 corticocortical interactions, none has so far shown that grasp-related neurons in M1 are responsive to activation of F5 or whether reciprocal effects from M1 to F5 grasping neurons are also present. These are main objectives of the current study, which also sought to investigate whether the stimulus intensity could influence the balance between excitation and inhibition. Extracellular single-unit activity was recorded in M1 while stimulating F5 with low-intensity single pulses (i.e., ≤40 μA). These stimuli evoked clear excitatory and inhibitory responses in M1 neurons at short latency. Reciprocal effects from M1 to F5 with similar properties were also observed. In general, inhibitory responses predominated at stronger intensities.
Materials and Methods
Three adult, purpose-bred macaque monkeys were involved in this experiment: two males, M40 (5.0 kg) and M41 (8.0 kg), and a female, M43 (5.5 kg). All procedures were performed in accordance with the United Kingdom Scientific Procedures (Animals) Act. The same animals were used to study the activity of single neurons and local field potentials in the premotor and primary motor cortex during various reach-to-grasp movements (Umilta et al., 2007; Spinks et al., 2008). The methods used in the present study are described in detail in Umilta et al. (2007) and are summarized only briefly below.
MRI scan and image analysis
At the beginning of the study, all three monkeys had a structural MRI scan under anesthesia (ketamine and medetomidine, Domitor; Pfizer). The monkey's head was placed in an MRI-compatible stereotaxic frame, with atraumatic eye and ear bars. Scans were performed with a GE Medical Systems Signa Horizon 1.5 tesla system (voxel dimensions, 0.5 × 0.5 × 0.5 mm). Main physiological functions were monitored throughout the 12 min scan.
MR images were realigned with the Horsley–Clarke stereotaxic system using custom-made software (3D Workstation, Medical Graphics; UCL), which were processed to guide the shape of a custom-fitted headpiece required for head fixation during cortical recordings. A 3D rendering of the cortical surface on which the central and arcuate sulci could be localized was used for accurate placement of the recording chambers and planning of electrode penetrations.
Surgery
All surgeries were performed under deep general anesthesia, induced with 10 mg/kg ketamine intramuscularly and maintained with 2–2.5% isoflurane in 50:50 O2/N2O. Full aseptic procedures were used. For subsequent head restraint during recording sessions, a custom-designed stainless-steel or Tekapeek circular headpiece was fixed to the monkey's skull (Lemon, 1984; Baker et al., 1999). In a second surgery, we implanted a rectangular stainless steel or Tekapeek recording chamber (20 × 10 mm) encompassing the F5 and M1 hand areas in the same hemisphere. The position of the chamber was based on stereotaxic coordinates estimated from the MRI and was also guided by the shape of the central and arcuate sulci, visible through the exposed dura. After each surgery, monkeys received a full course of antibiotics (20 mg/kg oxytetracycline, i.m., Terramycin/LA; Pfizer) and analgesic (10 μg/kg buprenorphine, i.m., Vetergesic; Reckitt and Colman).
Recording and stimulation
At the beginning of each recording session, the recording chamber was opened and cleaned. We used two independent recording drives (7 and 16 channels drives;Thomas Recording) to record and stimulate simultaneously from F5 and M1. The exact position of the tip of the drives with respect to the arcuate and central sulci was computed from previous readings of the position of stereotaxic reference markers on the chamber lid. Two to four glass-insulated platinum electrodes (1–2 MΩ impedance at 1 kHz) were loaded into each drive with an interelectrode distance ranging from 300 μm to 1.2 mm. The electrodes were inserted one by one through the dura into the cortex. After the insertion of all electrodes, a 30 min delay was allowed to stabilize the cortical recordings. Each electrode was then independently advanced into the cortex until the activity of cortical neurons was clearly isolated from background activity.
Single-unit activity.
Once a stable set of units was isolated in both F5 and M1, cortical activity was recorded while the monkey was performing a reach-to-grasp task with the contralateral hand. In M40, the task required grasping a set of three differently shaped objects using distinct hand postures (Fig. 1A). The other two monkeys (M41 and M43) had to perform a precision grip between the tip of the thumb and the index finger to move two levers into a position window (Lemon et al., 1986) and, in the same session, use a rake to retrieve distant pieces of food from a horizontal flat board (Iriki et al., 1996; Quallo et al., 2009). All the neurons included in this study were clearly modulated during these behavioral tasks (Fig. 1B). Some neurons were identified as pyramidal tract neurons (PTNs) by antidromic activation from the ipsilateral pyramidal tract (for details, see Kraskov et al., 2009).
Figure 1.

Grasp-related activity and location of paired stimulation and recording sites in M1 and F5. A, Hand postures used for grasping of three different objects by monkey M40. B, Typical grasp-related activity of a single neuron recorded in M1 (top) and another in F5 (bottom) hand areas. Histograms of spike activity are referenced to the moment at which the monkey released a home pad to reach out, grasp, and displace the object (time 0, vertical dashed line). M1 and F5 histograms represent averaged activity from 41 and 55 trials, respectively. C, D, Chamber maps from monkeys M40 (C) and M43 (D). Maps are based on MRI and direct stereotactic measurements of the arcuate (ArcS) and central (CS) sulci at surgery. The symbols mark surface location of pairs of electrode penetrations made in area F5 and M1 in the two monkeys. E, Responses of a neuron recorded within M1 to s-ICMS applied to an adjacent electrode in M1 (interelectrode distance, 300 μm). Superimposition of five sweeps showing an early synaptic response, superimposed on the tail of the stimulus artifact and occurring at variable latency to s-ICMS. Sweeps are synchronized to stimulus onset. Ant, Anterior; Lat, lateral; Med, medial; Post, posterior.
Single-pulse intracortical microstimulation.
An isolated stimulator (Neurolog NL800 stimulus isolator; Digitimer) was used to deliver a single, balanced biphasic pulse of intracortical microstimulation (s-ICMS) (with the cathodal pulse leading the anodal) to one electrode in F5 (or M1) while recording cortical activity from all the other electrodes. Each phase of the s-ICMS pulse was 200 μs wide, and pulses were repeated at a frequency of 10 Hz for 3–5 min. Maximum stimulus intensity was 30 μA in M40 and 40 μA in M41 and M43. With these intensities, the duration of the stimulus artifact was 1.5–2 ms, and the dead time of the discriminator was only marginally longer (1.7–2.2 ms), allowing early responses to be visualized despite the presence of the stimulus artifact (Fig. 1E). In some sessions in which a robust excitatory response was visible in individual sweeps, we explored evoked responses at different current intensities. All electrodes in F5 and M1 were used in turn as the stimulating electrode. Throughout the s-ICMS sessions, the monkeys were actively reaching and grasping either for food reward or from an instrumented carousel (Brochier et al., 2004).
Recordings.
The signal from each electrode was preamplified and bandpass filtered (300 Hz to 10 kHz) for the analysis of single-unit activity. This signal was sampled at 25 kHz and saved on disk for offline analysis. Offline discrimination of single-unit activity was performed with custom-made software based on principle component analysis of spike waveforms and cluster cutting (Eggermont, 1990).
At the end of the recording/stimulation session, the motor effects evoked by repetitive ICMS at the recording site were determined with trains of pulses (13 pulses at 333 Hz, intensity typically up to 50–60 μA, duty cycle 0.5 Hz). The electrodes were then withdrawn from the cortex. The dura was treated for 5 min with the anti-mitotic compound 5-flurouracil, to counteract dural scarring (Spinks et al., 2003). It was then thoroughly rinsed, filled with sterile saline, and closed with a lid.
Histology.
At the end of the experimental period, M40 and M41 were killed by an overdose of pentobarbitone (50 mg/kg, i.p., Euthanal; Rhone Merieux) and perfused through the heart. The cortex and brainstem were photographed and then removed for histological analysis. The location of cortical penetrations in F5 and M1 was constructed by integrating the stereotaxic readings obtained during each session with postmortem histology. M43 is still alive.
Results
Database
Recording and stimulation sites
This study was performed toward the end of three experimental studies in which the foci of grasp-related activity in F5 and the hand area of M1 were first defined by systematic recording in both areas (Fig. 1A,B) (Umilta et al., 2007; Spinks et al., 2008).
Area F5 (Matelli and Luppino, 1996) is the rostral division of the PMv and was characterized by brisk neuronal activity for grasp (Umilta et al., 2007), with either the contralateral or ipsilateral hand and by the presence of contralateral digit movements evoked by ICMS at thresholds >15 μA in 33 of 92 (35.8%) of the recording sites. The M1 hand area was located immediately rostral to the central sulcus, 16–18 mm lateral from the midline, and was again characterized by marked modulation of activity during grasp and by motor effects in the hand and digits with lower ICMS thresholds (<15 μA) in 70 of 79 (88.6%) of the recording sites. The penetrations mapped in M40 and M43 are shown in Figure 1, C and D, respectively. The sites at which responses to s-ICMS were obtained were limited to rather restricted regions of F5 and M1.
The efficacy of the cortical stimulus was confirmed by inspection of responses recorded on other microelectrodes within the same cortical area. These responses were often characterized by short-latency orthodromic (synaptic) responses showing considerable jitter (Fig. 1E). Of the F5 sites tested, 15 of 92 (16.3%) were loci at which PTNs were identified; this applied to 33 of 79 (41.8%) of M1 sites.
Number of single neurons tested from ICMS sites in F5 and M1
A total of 29 s-ICMS sessions were recorded from the three monkeys (Table 1). During these 29 sessions, a total of 370 single neurons were recorded at 171 sites (138 neurons from 92 sites in F5 and 232 neurons from 79 sites in M1). Each recorded single neuron was tested from between one and four electrodes in the opposite area, with a current intensity of 30 μA (M40) or 40 μA (M41, M43). Thus, in total, we recorded 280 responses from single neurons in F5 during s-ICMS delivered to M1 and 415 responses from single neurons from M1 during s-ICMS to F5. Because the same single neuron could respond in widely different ways to stimulation from different sites (see below), all the results are expressed in terms of responses of single neurons rather than for single neurons per se.
Table 1.
Summary of the database
| Monkey | Sessions | ≥ 2 F5 × 2 M1 | Responses tested |
s-ICMS effect |
Double-peak responses |
|||
|---|---|---|---|---|---|---|---|---|
| F5 | M1 | F5 | M1 | F5 | M1 | |||
| M40 | 12 | 12 | 178 | 204 | 66 (37) | 68 (33) | 16 (24) | 11 (16) |
| M41 | 6 | 1 | 34 | 23 | 6 (17) | 6 (26) | 1 (16) | 4 (67) |
| M43 | 11 | 9 | 68 | 188 | 37 (54) | 68 (36) | 8 (22) | 21 (31) |
| Total | 29 | 22 | 280 | 415 | 109 (29) | 142 (34) | 25 (23) | 36 (25) |
Sessions, Number of s-ICMS sessions per monkey (M40, M41, and M43). ≥2 F5 × 2 MI, Number of sessions with at least two electrodes in F5 and two in MI. Responses tested, Number of responses to s-ICMS tested for single neurons in F5 and MI. s-ICMS effect, Number of responses showing significant effects after s-ICMS (percentage from the total number of responses in parentheses). Double-peak responses, Number (and percentage) of responses showing a double peak of excitation.
A large proportion of responses in M1 neurons showed significant short-latency effects (i.e., <20 ms) to stimulation of F5 (34%), and a similarly high proportion of responses recorded in F5 showed effects to stimulation of M1 (39%) (Table 1).
Single-neuron responses to s-ICMS
For all single neurons, we confirmed that the interspike interval (ISI) histogram did not contain any nonphysiologically short intervals as a result of poor discrimination of the spike waveform (Fig. 2D). We then inspected randomly selected sweeps in which the neuron responded to stimulation, to check that the spikes contributing to evoked responses were similar in shape and size to the spontaneously occurring spikes and that they were clearly distinct from the tail of the stimulus artifact (Fig. 2C, inset, E, F). If spikes could not be reliably distinguished from the artifact, no PSTH was constructed and the neuron was excluded from the analysis.
Figure 2.

Detection of corticocortical responses to s-ICMS. Methods used for analysis of response of an M1 neuron to single-pulse ICMS in F5 (M43; n = 2081 stimuli at 40 μA). A, Peristimulus histogram synchronized with stimulus onset (time 0). Bin width, 0.2 ms. The gray line is a PSTH predictor computed from the mean instantaneous firing rate of the neuron in the peristimulus period. B, Corrected histogram showing the number of spikes above or below the PSTH predictor. A peak was considered significant when it was above 2× SD (top horizontal line) of the background firing rate (to left of stimulus) for at least three consecutive bins. A trough was considered significant when it was below 1× SD (bottom horizontal line) of the background rate for at least five consecutive bins. The gap in the PSTH attributable to the dead time of the spike discriminator during stimulus delivery is indicated by a dotted line. C, ISI histogram (bin width, 2 ms). D, The first 10 ms of the ISI histogram (bin width, 1 ms). This well-isolated single neuron (inset in C; horizontal calibration bar, 1 ms; vertical bar, 100 μV) did not show any counts in the first 1 ms bin of the histogram (arrow). E, Superimposition of 15 randomly selected spikes, referenced to the spike negativity. The spike waveform is clearly distinct from the tail of the stimulus artifact, and the jitter in the stimulus artifact is attributable to the variability of the spike onset time with respect to the single pulse and reveals the orthodromic nature of the response. F, Superimposition of 15 spikes referenced to the stimulus artifact (same timescale as E).
For all single neurons tested with each block of s-ICMS, we then computed a poststimulus time histogram (PSTH) with a 0.2 ms bin width referenced to the stimulus onset. The PSTH was constructed with all stimuli delivered in that block (typically 1800–5000 stimuli in total). We also calculated a PSTH predictor using an estimate of the instantaneous firing rate (IFR) for each neuron (Fig. 2A). In each sweep, the IFR at a given time was estimated from the reciprocal of the interval between the preceding and succeeding spikes. The IFR estimate was then averaged across all sweeps and used to predict the number of expected spikes in every PSTH bin. The PSTH predictor was subtracted from the raw PSTH to determine the number of spikes above or below prediction (Fig. 2A,B). The SD of spike events from the predictor (σbg) was computed over the 30 ms period preceding stimulus onset. We then used fixed quantitative criteria to detect excitatory and inhibitory responses to the s-ICMS. The response was considered as excitatory when at least three consecutive poststimulus bins were above 2 × σbg. The response was considered to be inhibitory when at least five consecutive poststimulus bins were below 1 × σbg. We justified the use of different thresholds for excitatory and inhibitory responses because these were fundamentally different; excitation was usually large and brief, whereas inhibition was of longer duration, and we wanted to avoid floor effects in detecting inhibitory responses in neurons with relatively low background firing rates. The relevance of these thresholds was further assessed by computing the probability of excitatory peaks and inhibitory troughs occurring by chance in background activity (i.e., over the 30 ms before stimulus onset). This probability was compared for three-bin excitatory peaks and for five-bin inhibitory troughs. Of 638 F5 and M1 responses from single neurons in M40 and M43, <0.1% showed three-bin peaks above 2 × σbg in background activity, and only 1.6% of the units showed a five-bin trough below 1 × σbg in background activity, which is well below 0.05 significance level.
Types of responses to the s-ICMS
We classified the responses that showed clear effects to s-ICMS into three distinct categories: (1) pure excitation, (2) early excitation peak followed by inhibition, and (3) pure inhibition (Fig. 3).
Figure 3.

Types of s-ICMS evoked responses. Left and right columns illustrate F5 andM1 responses, respectively; PSTH conventions are the same as in Figure 2. A, B, Pure excitatory responses (A, n = 2138 stimuli; B, n = 1939). C, D, Combined early excitatory plus later inhibitory responses (C, n = 4158; D, n = 1881). E, F, Pure inhibitory responses: note the rebound in activity at the end of the inhibitory period (arrows) (E, n = 3355; D, n = 4246). Responses in A and C–E are from M40, and responses in B and F are from M43.
Pure excitation
The majority of the neurons showed only one peak of short-latency excitation in response to s-ICMS [F5 neuron (Fig. 3A) and M1 neuron (Fig. 3B)]; this peak was brief and was not followed by any significant inhibition.
Early excitation–inhibition
These responses were characterized by a peak in the PSTH occurring at very brief latency (1.8–4 ms) (Fig. 3C,D). This early excitatory peak was followed by inhibition with a variable duration. In some cases, the inhibitory period was followed by a second excitatory peak.
Pure inhibition
Here the response consisted of a short-latency suppression of steady background activity (Fig. 3E,F) without any significant accompanying early excitation. At the end of the inhibitory period, the activity of the neuron was often slightly higher than the prestimulus level, and a significant, long-latency (15–25 ms) excitatory peak of low amplitude was occasionally detected (Fig. 3E,F, arrows).
As shown in Figure 4A, the most frequently observed type of response was pure excitation (54% in F5 and 53% in M1). Responses with mixed excitation and inhibition were also common (26% in F5 and 34% in M1), whereas those with pure inhibition were least common (20% in F5 and 13% in M1). Thus, the proportions of these three response categories were rather similar in F5 and M1 neurons.
Figure 4.

s-ICMS-evoked responses properties. A, Number of s-ICMS-evoked responses for each response category (pure excitation, excitation–inhibition, and pure inhibition). The proportion of responses from the three monkeys used are shown within the columns, in order from top to bottom: M41, M43, and M40. Left and right histograms represent F5 and M1 data, respectively. The majority of the responses were excitatory in both F5 and M1. Note the similarity of response distribution in these two areas. B, Amplitude, duration, and area of excitation and inhibition for the three categories of responses (error bars represent SEs). The top horizontal square brackets indicate significant differences (p < 0.05, Kruskal–Wallis test, nonparametric one-way ANOVA) between response categories.
We quantified precisely the respective incidence of inhibition and excitation in these categories by calculating the amplitude, duration, and area of the predictor-corrected poststimulus responses (Fig. 4B). Significant peaks and troughs in each PSTH were selected using the selection criteria described previously (three bins above 2 × σbg and five bins below 1 × σbg, respectively). In the case of multiple peaks or troughs, the response with the largest area was selected for additional analysis. The response amplitude was the average spike count per bin within the peak (for excitation) or trough (inhibition). The response duration represented the total number of consecutive bins above 2 × σbg and below 1 × σbg for the peak and trough, respectively. The tail of inhibition was often unclear (Fig. 3F). To avoid this problem, the PSTH was smoothed with a five-point running average before computing the response duration. The response area was defined as the total spike count in the peak or trough.
Overall, the results in Figure 4B show that excitation tended to be large and brief, whereas inhibition was small but relatively long lasting. Both the amplitude and the area of excitation were significantly larger in the excitation–inhibition responses than in the pure excitation category. Likewise, the area of inhibition was significantly larger in the mixed excitation–inhibition responses than in the pure inhibition category. The duration of inhibition (5–7 ms) was always longer than excitation (1 ms).
Response latency
The distribution of short-latency excitatory responses was similar in both F5 (Fig. 5A) and M1 (Fig. 5B). The majority of the peaks (64 and 68% in M1 and F5, respectively) occurred between 1.8 and 2.4 ms after the stimulus onset. Fewer neurons responded for the first time at longer latencies. These late peaks usually followed a period of reduced or suppressed activity (Fig. 3F), suggesting some kind of postinhibitory rebound. In neurons exhibiting pure inhibition, the onset of inhibition was often difficult to dissociate from the trough in the histogram during the stimulus artifact (i.e., the dead time of the discrimination process) (Fig. 3E). In this case, we set the inhibition onset latency at 2 ms, which was the average dead time of the discriminator, i.e., the earliest time after stimulation when single spikes could be reliably discriminated. In some cases, early onset of inhibition was detectable at short latency without contamination from the discriminator dead time (Fig. 3E). Most often, significant inhibition occurred just after a significant excitatory peak with a latency of ∼3 ms (Fig. 3D) (see Fig. 9C,G). Late inhibitory responses were relatively rare.
Figure 5.

Distribution of response onset latencies. Left and right columns illustrate F5 and M1 data, respectively. Latencies were calculated from the stimulus onset. Bin width, 0.2 ms. Only latencies between 0 and 10 ms are included in the latency histograms. For double-peak responses, the latency was measured for the first peak only. A, B, Distribution of excitatory response latencies. C, D, Distribution of inhibitory response latencies.
Figure 9.

Changes in neuron inhibitory response properties at higher intensities. The respective number of responses falling in the pure excitation, excitation–inhibition, and pure inhibition categories are compared at 20 μA (black) and 40 μA (gray). Lower-intensity s-ICMS (20 μA) evoked mainly pure excitatory responses, with relatively few mixed or inhibitory effects. At higher intensity (40 μA), excitation was increased but was now mixed with inhibitory effects, and the great majority of the responses were classified as excitation–inhibition. Response distributions at 20 and 40 μA are significantly different at p < 0.05 (χ2 test).
Double-peak responses
Approximately one-quarter of the neurons with responses to s-ICMS (23 and 25% in F5 and M1, respectively) showed a double excitatory peak in the PSTH, such as those shown in Figure 6, A and B. This type of response was characterized by a sharp response peak at short latency followed by a period of reduced or suppressed activity and then a second peak of excitation. The amplitude of the second peak was usually smaller and its duration longer than the amplitude of the first peak. Averages of PSTH responses from F5 (25 responses) and from M1 (36 responses) with double-peak effects are shown in Figure 6, C and D, respectively. These averages were obtained by pooling the corrected PSTH of these responses. At this population level, two peaks of response were still observed within the first 10 ms after stimulus, and the separation between the peaks was ∼6 ms. Thus, neurons that responded this way did so in a consistent temporal pattern.
Figure 6.

Double-peak responses. A, B, Examples of a single neuron in F5 (A, n = 4518 stimuli) and M1 (B, n = 2082) showing a double excitatory peak in response to the s-ICMS. The two peaks were separated by a period of suppressed activity. C, D, PSTH average of all the F5 (n = 25) and M1 (n = 36) responses with a significant double-peak effect.
Single neurons tested from different sites yielded different responses
The response of a given neuron to stimulation at different sites was not uniform. Figure 7 shows responses of the same single M1 neuron to s-ICMS (40 μA) at four different sites within F5; these four sites were within 1 mm of each other. The overlaid spikes and ISIs confirm that the same neuron was tested in each case (Fig. 7A,B). F5 sites 1 and 2 evoked brief short-latency excitation, whereas site 4 evoked a double-peak response followed by inhibition. Site 3 was ineffective.
Figure 7.

Responses evoked in a single M1 neuron from different F5 sites. Stimulation from four different sites in F5 evoked different responses from the same single neuron in M1. Close inspection of spike waveforms (A) and ISI histograms (B) indicate that the same single neuron was recorded during stimulation of the different sites (stim F5-1 to F5-4, respectively, 40 μA). PSTHs (C) show that stimulation of sites F5-1 (n = 2241 stimuli) and F5-2 (n = 2444) evoked a weak excitatory response. No response was evoked by the stimulation of site F5-3 (n = 2518). Stimulation of site F5-4 (n = 2684) evoked a large double-peak response, followed by a period of inhibition.
s-ICMS response at different intensities
In nine sessions, we compared the effect of s-ICMS at two different intensities, 20 and 40 μA. Within these sessions, significant excitatory or inhibitory responses were evoked in 11 neurons at 20 μA (four from M1, seven from F5) and 12 neurons at 40 μA (six M1, six F5). Close inspection of the data (ISI histograms, spike shape, and PSTH) revealed that, in eight cases, recordings were made from the same neuron at the two intensities. Figure 8 illustrates s-ICMS-evoked response in an F5 neuron at different intensities. The comparison of the ISI histograms (Fig. 8A,E) and the spike shapes (Fig. 8B,F) confirm that the same neuron was recorded while stimulating at the two different intensities. At 20 μA, the response was characterized by a typical early and brief peak of excitation with no subsequent inhibition. This response was classified as pure excitation following our criteria. Increasing the intensity of stimulation to 40 μA led to a combination of excitatory and inhibitory effects in the response of this neuron (Fig. 8G,H). The amplitude of the excitatory peak increased, but its brief duration remained unaffected. In addition, a significant period of inhibition was observed immediately after the excitatory response. This inhibition was still evident when all the sweeps in which a spike was evoked in the early excitatory peak were excluded from the PSTH (Fig. 8H). This analysis shows that inhibition was still clearly present after removal of these excitatory evoked responses and was therefore not attributable to refractoriness of the neuron following these responses. The 40 μA evoked response was classified as excitation–inhibition.
Figure 8.
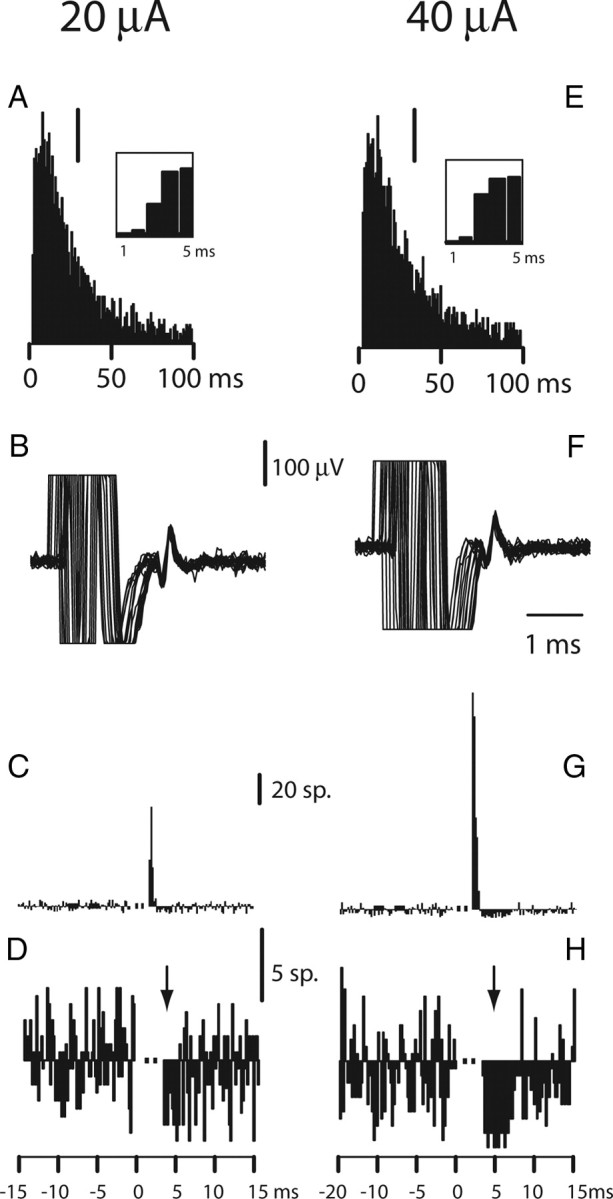
Effect of stimulus intensity. The same F5 neuron was recorded with stimulation at 20 and 40 μA. A, ISI histogram, 1 ms bins, and calibration bar (20 spikes); inset shows the first 5 bins of the ISI histogram (largest bin, 83 spikes). B, Superimposed spike traces and corrected PSTH (C, n = 3313 stimuli) for s-ICMS at 20 μA; E–G, same data at 40 μA (in G, n = 2241 stimuli). Calibration bar in E is 20 spikes (inset, largest bin, 70 spikes). At 40 μA, the brief peak of excitation was followed by clear inhibition, which was far more evident than at 20 μA. The excitatory peak at 20 μA was reduced in amplitude. D, H, PSTH excluding the sweeps with an excitatory response. The inhibitory response was still present, confirming that it was not attributable to refractoriness after evoked spikes (arrow).
To further analyze the greater incidence of inhibition at the stronger intensity, we calculated the number of responses at 40 versus 20 μA, which showed pure excitation, excitation–inhibition, or pure inhibition. Figure 9 shows the distribution of the responses in each of the three categories. Pure excitatory responses clearly predominated at 20 μA (8 of 11 responses). In contrast, most of the responses (9 of 12) at 40 μA fell into the early excitation–inhibition category (Fig. 9).
Discussion
This study shows that single, low-intensity ICMS pulses delivered to F5 sites at which grasping activity was recorded evoked orthodromic excitatory and inhibitory responses in M1 hand area neurons, which were also grasp related. Reciprocal effects in F5 to stimulation in M1 were also found and had similar properties. These results provide direct evidence that corticocortical excitation and inhibition of M1 and F5 neurons could underlie the powerful interactions between PMv and M1 during preparation and execution of grasping movements (Shimazu et al., 2004; Davare et al., 2009, 2010; Prabhu et al., 2009).
Action of intracortical stimuli within the stimulated cortical area (MI or F5)
Intracortical stimuli with the duration, intensity, and configuration used in this study are known to exert most of their direct effects on axons and particularly on myelinated axons of pyramidal cells lying close (∼1 mm) to the electrode tip but not on cell bodies (Stoney et al., 1968; Nowak and Bullier, 1998a,b; Butovas and Schwarz, 2003; Tehovnik et al., 2006; Histed et al., 2009). However, there will also be an intense indirect (trans-synaptic) activation of neurons that follows from the antidromic and orthodromic activation of axons (Tolias et al., 2005), which can activate a sparse but quite widely distributed population of neurons (Histed et al., 2009). The characteristic response to s-ICMS, within the stimulated area, was an early, trans-synaptic excitation followed by a prolonged period of inhibition (Fig. 1E) (Baker et al., 1998; Butovas and Schwarz, 2003). Such responses are consistent with a “canonical circuit” thought to operate in all neocortical areas (Seidemann et al., 2002; Douglas and Martin, 2004), although some differences between granular and agranular cortex cannot be ignored.
The nature of the responses obtained between cortical areas M1 and F5
This was the main focus of this study. In contrast to Godschalk et al. (1984), we did not observe any antidromic activation of F5 neurons from M1 (or vice versa). This is unlikely to be because the stimuli we used were too weak to excite the axons of corticocortical neurons. We can assume from conduction velocity estimates that at least some of these neurons have myelinated axons and can be excited with the currents used here (Godschalk et al., 1984; Nowak and Bullier, 1998a). However, the probability of recording from a neuron in F5 whose axon has been stimulated in M1 (or vice versa) in the present study was rather low; all of the antidromic responses reported by Godschalk et al. (1984) were from neurons in superficial layers, presumably lamina III pyramids, which are known to provide a major source of corticocortical projections (Jones and Wise, 1977; Douglas and Martin, 2004), whereas many of our recordings were obtained from deep layers, as suggested by the presence of pyramidal tract neurons.
Unlike antidromic responses, orthodromic corticocortical effects were widespread (34% of PSTHs). Some of these may have been monosynaptic in nature. However, we have to be cautious in this interpretation because most responses showed considerable jitter from one stimulus to the next (Figs. 2F, 8B,F) and because the responses had latencies (1.8–4 ms) (Fig. 5A,B) that were at least one synaptic delay longer than the known antidromic latencies for PMv neurons excited from M1 [0.6–2.1 ms, mean of 1.2 ms (Godschalk et al., 1984)]. For these reasons, we suggest that most of the responses were probably oligosynaptic in nature. We have already referred to the complex trans-synaptic activation of neurons, including corticocortical neurons, that occurs at the stimulation site. Volleys excited in the long axons of these neurons would in turn excite a cascade of oligosynaptic effects in the connected area.
It is known that PMv modulation of corticospinal outputs activated by M1 stimuli is restricted to the late descending I-waves (I2 and I3) with no effect on the earliest (monosynaptic) I1 activity (Shimazu et al., 2004). Facilitation of M1 layer V neurons at latencies of 1.8–3 ms by conditioning PMv stimulation would be consistent with inputs arriving to coincide with the I2 and I3 responses in corticospinal neurons that are generated by strong intracortical stimuli (∼200 μA) within M1 (Shimazu et al., 2004). These responses are typically evoked at ∼1.3 and 2.5 ms, respectively (Baker et al., 1998) (M. A. Maier, T. Brochier, R. N. Lemon, and P. A. Kirkwood, unpublished observations).
However, we should point out that stimulation of F5 did not produce high-frequency repetitive discharge of M1 neurons having interspike intervals of 1–1.5 ms. Many tested neurons did show double-peak excitatory responses to single-pulse ICMS in F5 (Fig. 6), but these responses had longer (6 ms) interspike intervals than I-wave discharges. However, these double-peak responses do provide additional evidence that corticocortical inputs can generate robust excitation that may result from recurrent excitation in the input pathway.
Inhibitory responses occurred at longer latencies (Fig. 5C,D), which is consistent with the finding that conditioning F5 stimuli can also suppress M1-evoked EMG responses (Prabhu et al., 2009) at longer condition-test intervals than facilitation.
Reciprocal F5–M1 interactions
The characteristic features of corticocortical responses (incidence, onset, and duration and presence of double-peak excitation) were very similar in F5 neurons to M1 stimulation and vice versa. These reciprocal effects are consistent with anatomical studies showing the equal density of corticocortical projection from F5 onto the hand representation in M1 and vice versa (Dum and Strick, 2005).
Comparison with previous studies of PMv–M1 interactions: inhibition with stronger stimuli
Compared with previous studies (Ghosh and Porter, 1988, surface stimuli, ∼500 μA, anesthetized monkeys; Tokuno and Nambu, 2000, intracortical stimuli, 100–500 μA, sedated monkeys), the responses we recorded were obtained with single-pulse stimuli of low intensity (≤40 μA, equivalent to a charge of only 4–8 nC). It is likely that the threshold for evoking clear responses was reduced both because our monkeys were awake and actively engaged in reaching and grasping tasks and because pairs of F5 and M1 sites were preselected for containing grasp-related neurons (Fig. 1).
Tokuno and Nambu (2000) found that responses in M1 to PMv stimulation were dominated by long-lasting (90 ms) inhibition; 23 of 27 PTNs showed pure inhibitory responses, 11 showed excitation–inhibition, and none showed pure excitation. Inhibition lasting 50–200 ms was also reported by Ghosh and Porter (1988). These findings contrast with the high incidence of pure excitation (Figs. 3–8) and double-excitatory peaks (Fig. 6) reported here; poststimulus inhibition was relatively brief and rarely exceeded 10 ms.
Our results demonstrate that it is possible to evoke purely excitatory corticocortical responses, presumably attributable to activation of long-range projections terminating on local excitatory circuits presynaptic to pyramidal cells. No inhibition was detectable in these responses, which were the most commonly found with shocks of 30–40 μA (Fig. 4A, white bars). Although some of these pure responses were small, they were on average ∼70% of the generally larger excitatory peaks that were seen in combination with later inhibitory effects in other neurons (Fig. 4B, black bars).
Inhibitory responses presumably result from volleys in long-range projections to local inhibitory circuits (Berman et al., 1991; Keller and Asanuma, 1993; Markram et al., 2004). Inhibitory effects were augmented with stronger stimuli. At 40 μA, mixed excitatory–inhibitory responses were much more common than with 20 μA stimuli, in which pure excitatory responses predominated (Figs. 8, 9). These features could be explained by a greater degree of convergence of long-range projections from the stimulated area onto local inhibitory circuits so that, as stimulus intensity is increased, inhibition tends to dominate excitation.
General implications for studies of corticocortical effects
Repetitive ICMS is now routinely used to study not only motor effects but also changes in behavior (Romo et al., 2000; Gold and Shadlen, 2007) and BOLD activity (Tolias et al., 2005; Logothetis et al., 2010). fMRI studies confirm that the effects of repetitive ICMS extend beyond the brain region excited by direct current spread (Tehovnik et al., 2006; Field et al., 2008). Tolias et al. (2005) observed that long trains of strong ICMS (typically 4 s long and up to 1800 μA) applied to primary visual cortical area (V1) evoke a BOLD response in cortical regions located only one synapse away from the site of stimulation (e.g., in V2, V3, or middle temporal area MT). However, we do not know that these BOLD responses reflected solely the monosynaptic actions of corticocortical projections to the connected areas, because these monosynaptic actions are likely to cascade into local excitatory and inhibitory circuits (see above).
Logothetis et al. (2010) recently demonstrated that silencing the corticocortical pathways from V1 (achieved by the repetitive stimulation of the lateral geniculate nucleus) led to widespread suppression of BOLD activity in connected visual cortical areas. Blockade of the M1 hand area with muscimol can completely abolish the motor effects evoked from PMv/F5 (Schmidlin et al., 2008), further demonstrating how important these corticocortical pathways are in establishing the characteristic functions of a cortical area.
PMv–M1 interactions in human TMS studies
Our observations are of direct relevance to twin-coil TMS techniques used to explore premotor influences over M1 outputs in humans. The overriding effect reported has been one of inhibition/suppression. Civardi et al. (2001) showed that significant motor-evoked potential inhibition occurred when a conditioning shock over the premotor cortex was given 4–6 ms before an M1 test shock. At a low intensity, a conditioning stimulus over PMv produces facilitation, whereas higher intensities lead to inhibition (Bäumer et al., 2009). This agrees with our observation that lowering the ICMS intensity reduces the level of inhibition.
Conclusions
This study demonstrates that low-intensity s-ICMS could be used to analyze dynamic corticocortical interactions during motor tasks. With such weak stimuli, the main interaction between areas F5 and M1 consists of brief, short-latency excitation, with inhibition becoming more predominant at higher intensities of stimulation. We suggest that these effects are mediated by long-range reciprocal projections between these two cortical areas that excite local polysynaptic circuits.
Footnotes
This work was supported by The Wellcome Trust, the National Centre for the 3Rs, and the Biotechnology and Biological Sciences Research Council. We gratefully acknowledge the contributions of Samantha Shepherd, Victor Baller, Ed Bye, David McManus, Chris Seers, and Rachel Spinks.
References
- Amassian VE, Stewart M, Quirk GJ, Rosenthal JL. Physiological basis of motor effects of a transient stimulus to cerebral cortex. Neurosurgery. 1987;20:74–93. [PubMed] [Google Scholar]
- Baker SN, Olivier E, Lemon RN. An investigation of the intrinsic circuitry of the motor cortex of the monkey using intra-cortical microstimulation. Exp Brain Res. 1998;123:397–411. doi: 10.1007/s002210050585. [DOI] [PubMed] [Google Scholar]
- Baker SN, Philbin N, Spinks R, Pinches EM, Wolpert DM, MacManus DG, Pauluis Q, Lemon RN. Multiple single unit recording in the cortex of monkeys using independently moveable microelectrodes. J Neurosci Methods. 1999;94:5–17. doi: 10.1016/s0165-0270(99)00121-1. [DOI] [PubMed] [Google Scholar]
- Bäumer T, Schippling S, Kroeger J, Zittel S, Koch G, Thomalla G, Rothwell JC, Siebner HR, Orth M, Münchau A. Inhibitory and facilitatory connectivity from ventral premotor to primary motor cortex in healthy humans at rest—a bifocal TMS study. Clin Neurophysiol. 2009;120:1724–1731. doi: 10.1016/j.clinph.2009.07.035. [DOI] [PubMed] [Google Scholar]
- Berman NJ, Douglas RJ, Martin KA, Whitteridge D. Mechanisms of inhibition in cat visual cortex. J Physiol. 1991;440:697–722. doi: 10.1113/jphysiol.1991.sp018731. [DOI] [PMC free article] [PubMed] [Google Scholar]
- Brochier T, Spinks RL, Umilta MA, Lemon RN. Patterns of muscle activity underlying object-specific grasp by the macaque monkey. J Neurophysiol. 2004;92:1770–1782. doi: 10.1152/jn.00976.2003. [DOI] [PubMed] [Google Scholar]
- Buch ER, Mars RB, Boorman ED, Rushworth MF. A network centered on ventral premotor cortex exerts both facilitatory and inhibitory control over primary motor cortex during action reprogramming. J Neurosci. 2010;30:1395–1401. doi: 10.1523/JNEUROSCI.4882-09.2010. [DOI] [PMC free article] [PubMed] [Google Scholar]
- Butovas S, Schwarz C. Spatiotemporal effects of microstimulation in rat neocortex: a parametric study using multielectrode recordings. J Neurophysiol. 2003;90:3024–3039. doi: 10.1152/jn.00245.2003. [DOI] [PubMed] [Google Scholar]
- Cerri G, Shimazu H, Maier MA, Lemon RN. Facilitation from ventral premotor cortex of primary motor cortex outputs to macaque hand muscles. J Neurophysiol. 2003;90:832–842. doi: 10.1152/jn.01026.2002. [DOI] [PubMed] [Google Scholar]
- Civardi C, Cantello R, Asselman P, Rothwell JC. Transcranial magnetic stimulation can be used to test connections to primary motor areas from frontal and medial cortex in humans. Neuroimage. 2001;14:1444–1453. doi: 10.1006/nimg.2001.0918. [DOI] [PubMed] [Google Scholar]
- Davare M, Lemon R, Olivier E. Selective modulation of interactions between ventral premotor cortex and primary motor cortex during precision grasping in humans. J Physiol. 2008;586:2735–2742. doi: 10.1113/jphysiol.2008.152603. [DOI] [PMC free article] [PubMed] [Google Scholar]
- Davare M, Montague K, Olivier E, Rothwell JC, Lemon RN. Ventral premotor to primary motor cortical interactions during object-driven grasp in humans. Cortex. 2009;45:1050–1057. doi: 10.1016/j.cortex.2009.02.011. [DOI] [PMC free article] [PubMed] [Google Scholar]
- Davare M, Rothwell JC, Lemon RN. Causal connectivity between the human anterior intraparietal area and premotor cortex during grasp. Curr Biol. 2010;20:176–181. doi: 10.1016/j.cub.2009.11.063. [DOI] [PMC free article] [PubMed] [Google Scholar]
- Douglas RJ, Martin KA. Neuronal circuits of the neocortex. Annu Rev Neurosci. 2004;27:419–451. doi: 10.1146/annurev.neuro.27.070203.144152. [DOI] [PubMed] [Google Scholar]
- Dum RP, Strick PL. Motor areas in the frontal lobe of the primate. Physiol Behav. 2002;77:677–682. doi: 10.1016/s0031-9384(02)00929-0. [DOI] [PubMed] [Google Scholar]
- Dum RP, Strick PL. Frontal lobe inputs to the digit representations of the motor areas on the lateral surface of the hemisphere. J Neurosci. 2005;25:1375–1386. doi: 10.1523/JNEUROSCI.3902-04.2005. [DOI] [PMC free article] [PubMed] [Google Scholar]
- Eggermont JJ. Theory and experiment in neural interaction. Berlin: Springer; 1990. The correlative brain. [Google Scholar]
- Field CB, Johnston K, Gati JS, Menon RS, Everling S. Connectivity of the primate superior colliculus mapped by concurrent microstimulation and event-related FMRI. PLoS One. 2008;3:e3928. doi: 10.1371/journal.pone.0003928. [DOI] [PMC free article] [PubMed] [Google Scholar]
- Ghosh S, Porter R. Corticocortical synaptic influences on morphologically identified pyramidal neurones in the motor cortex of the monkey. J Physiol. 1988;400:617–629. doi: 10.1113/jphysiol.1988.sp017139. [DOI] [PMC free article] [PubMed] [Google Scholar]
- Godschalk M, Lemon RN, Kuypers HG, Ronday HK. Cortical afferents and efferents of monkey postarcuate area: an anatomical and electrophysiological study. Exp Brain Res. 1984;56:410–424. doi: 10.1007/BF00237982. [DOI] [PubMed] [Google Scholar]
- Gold JI, Shadlen MN. The neural basis of decision making. Annu Rev Neurosci. 2007;30:535–574. doi: 10.1146/annurev.neuro.29.051605.113038. [DOI] [PubMed] [Google Scholar]
- Grafton ST. The cognitive neuroscience of prehension: recent developments. Exp Brain Res. 2010;204:475–491. doi: 10.1007/s00221-010-2315-2. [DOI] [PMC free article] [PubMed] [Google Scholar]
- Histed MH, Bonin V, Reid RC. Direct activation of sparse, distributed populations of cortical neurons by electrical microstimulation. Neuron. 2009;63:508–522. doi: 10.1016/j.neuron.2009.07.016. [DOI] [PMC free article] [PubMed] [Google Scholar]
- Iriki A, Tanaka M, Iwamura Y. Coding of modified body schema during tool use by macaque postcentral neurones. Neuroreport. 1996;7:2325–2330. doi: 10.1097/00001756-199610020-00010. [DOI] [PubMed] [Google Scholar]
- Jeannerod M, Arbib MA, Rizzolatti G, Sakata H. Grasping objects: the cortical mechanisms of visuomotor transformation. Trends Neurosci. 1995;18:314–320. [PubMed] [Google Scholar]
- Jones EG, Wise SP. Size, laminar and columnar distribution of efferent cells in the sensory-motor cortex of monkeys. J Comp Neurol. 1977;175:391–438. doi: 10.1002/cne.901750403. [DOI] [PubMed] [Google Scholar]
- Keller A, Asanuma H. Synaptic relationships involving local axon collaterals of pyramidal neurons in the cat motor cortex. J Comp Neurol. 1993;336:229–242. doi: 10.1002/cne.903360206. [DOI] [PubMed] [Google Scholar]
- Kraskov A, Dancause N, Quallo MM, Shepherd S, Lemon RN. Corticospinal neurons in macaque ventral premotor cortex with mirror properties: a potential mechanism for action suppression? Neuron. 2009;64:922–930. doi: 10.1016/j.neuron.2009.12.010. [DOI] [PMC free article] [PubMed] [Google Scholar]
- Lemon RN. Methods for neuronal recording in conscious animals. In: Smith AD, editor. IBRO handbook series: methods in neurosciences. Vol 4. London: Wiley; 1984. pp. 1–162. [Google Scholar]
- Lemon RN, Mantel GW, Muir RB. Corticospinal facilitation of hand muscles during voluntary movement in the conscious monkey. J Physiol. 1986;381:497–527. doi: 10.1113/jphysiol.1986.sp016341. [DOI] [PMC free article] [PubMed] [Google Scholar]
- Logothetis NK, Augath M, Murayama Y, Rauch A, Sultan F, Goense J, Oeltermann A, Merkle H. The effects of electrical microstimulation on cortical signal propagation. Nat Neurosci. 2010;13:1283–1291. doi: 10.1038/nn.2631. [DOI] [PubMed] [Google Scholar]
- Markram H, Toledo-Rodriguez M, Wang Y, Gupta A, Silberberg G, Wu C. Interneurons of the neocortical inhibitory system. Nat Rev Neurosci. 2004;5:793–807. doi: 10.1038/nrn1519. [DOI] [PubMed] [Google Scholar]
- Matelli M, Luppino G. Thalamic input to mesial and superior area 6 in the macaque monkey. J Comp Neurol. 1996;372:59–87. doi: 10.1002/(SICI)1096-9861(19960812)372:1<59::AID-CNE6>3.0.CO;2-L. [DOI] [PubMed] [Google Scholar]
- Matelli M, Govoni P, Galletti C, Kutz DF, Luppino G. Superior area 6 afferents from the superior parietal lobule in the macaque monkey. J Comp Neurol. 1998;402:327–352. [PubMed] [Google Scholar]
- Muakkassa KF, Strick PL. Frontal lobe inputs to primate motor cortex: evidence for four somatotopically organized “premotor” areas. Brain Res. 1979;177:176–182. doi: 10.1016/0006-8993(79)90928-4. [DOI] [PubMed] [Google Scholar]
- Murata A, Fadiga L, Fogassi L, Gallese V, Raos V, Rizzolatti G. Object representation in the ventral premotor cortex (area F5) of the monkey. J Neurophysiol. 1997;78:2226–2230. doi: 10.1152/jn.1997.78.4.2226. [DOI] [PubMed] [Google Scholar]
- Murata A, Gallese V, Luppino G, Kaseda M, Sakata H. Selectivity for the shape, size, and orientation of objects for grasping in neurons of monkey parietal area AIP. J Neurophysiol. 2000;83:2580–2601. doi: 10.1152/jn.2000.83.5.2580. [DOI] [PubMed] [Google Scholar]
- Nowak LG, Bullier J. Axons, but not cell bodies, are activated by electrical stimulation in cortical gray matter. I. Evidence from chronaxie measurements. Exp Brain Res. 1998a;118:477–488. doi: 10.1007/s002210050304. [DOI] [PubMed] [Google Scholar]
- Nowak LG, Bullier J. Axons, but not cell bodies, are activated by electrical stimulation in cortical gray matter. II. Evidence from selective inactivation of cell bodies and axon initial segments. Exp Brain Res. 1998b;118:489–500. doi: 10.1007/s002210050305. [DOI] [PubMed] [Google Scholar]
- Pandya DN, Kuypers HG. Cortico-cortical connections in the rhesus monkey. Brain Res. 1969;13:13–36. doi: 10.1016/0006-8993(69)90141-3. [DOI] [PubMed] [Google Scholar]
- Patton HD, Amassian VE. Single and multiple-unit analysis of cortical stage of pyramidal tract activation. J Neurophysiol. 1954;17:345–363. doi: 10.1152/jn.1954.17.4.345. [DOI] [PubMed] [Google Scholar]
- Prabhu G, Shimazu H, Cerri G, Brochier T, Spinks RL, Maier MA, Lemon RN. Modulation of primary motor cortex outputs from ventral premotor cortex during visually guided grasp in the macaque monkey. J Physiol. 2009;587:1057–1069. doi: 10.1113/jphysiol.2008.165571. [DOI] [PMC free article] [PubMed] [Google Scholar]
- Quallo MM, Price CJ, Ueno K, Asamizuya T, Cheng K, Lemon RN, Iriki A. Gray and white matter changes associated with tool-use learning in macaque monkeys. Proc Natl Acad Sci U S A. 2009;106:18379–18384. doi: 10.1073/pnas.0909751106. [DOI] [PMC free article] [PubMed] [Google Scholar]
- Raos V, Umiltá MA, Murata A, Fogassi L, Gallese V. Functional properties of grasping-related neurons in the ventral premotor area F5 of the macaque monkey. J Neurophysiol. 2006;95:709–729. doi: 10.1152/jn.00463.2005. [DOI] [PubMed] [Google Scholar]
- Rizzolatti G, Luppino G. The cortical motor system. Neuron. 2001;31:889–901. doi: 10.1016/s0896-6273(01)00423-8. [DOI] [PubMed] [Google Scholar]
- Romo R, Hernández A, Zainos A, Brody CD, Lemus L. Sensing without touching: psychophysical performance based on cortical microstimulation. Neuron. 2000;26:273–278. doi: 10.1016/s0896-6273(00)81156-3. [DOI] [PubMed] [Google Scholar]
- Schmidlin E, Brochier T, Maier MA, Kirkwood PA, Lemon RN. Pronounced reduction of digit motor responses evoked from macaque ventral premotor cortex after reversible inactivation of the primary motor cortex hand area. J Neurosci. 2008;28:5772–5783. doi: 10.1523/JNEUROSCI.0944-08.2008. [DOI] [PMC free article] [PubMed] [Google Scholar]
- Seidemann E, Arieli A, Grinvald A, Slovin H. Dynamics of depolarization and hyperpolarization in the frontal cortex and saccade goal. Science. 2002;295:862–865. doi: 10.1126/science.1066641. [DOI] [PubMed] [Google Scholar]
- Shimazu H, Maier MA, Cerri G, Kirkwood PA, Lemon RN. Macaque ventral premotor cortex exerts powerful facilitation of motor cortex outputs to upper limb motoneurons. J Neurosci. 2004;24:1200–1211. doi: 10.1523/JNEUROSCI.4731-03.2004. [DOI] [PMC free article] [PubMed] [Google Scholar]
- Spinks RL, Baker SN, Jackson A, Khaw PT, Lemon RN. Problem of dural scarring in recording from awake, behaving monkeys: a solution using 5-fluorouracil. J Neurophysiol. 2003;90:1324–1332. doi: 10.1152/jn.00169.2003. [DOI] [PubMed] [Google Scholar]
- Spinks RL, Kraskov A, Brochier T, Umilta MA, Lemon RN. Selectivity for grasp in local field potential and single neuron activity recorded simultaneously from M1 and F5 in the awake macaque monkey. J Neurosci. 2008;28:10961–10971. doi: 10.1523/JNEUROSCI.1956-08.2008. [DOI] [PMC free article] [PubMed] [Google Scholar]
- Stoney SD, Jr, Thompson WD, Asanuma H. Excitation of pyramidal tract cells by intracortical microstimulation: effective extent of stimulating current. J Neurophysiol. 1968;31:659–669. doi: 10.1152/jn.1968.31.5.659. [DOI] [PubMed] [Google Scholar]
- Taira M, Mine S, Georgopoulos AP, Murata A, Sakata H. Parietal cortex neurons of the monkey related to the visual guidance of hand movement. Exp Brain Res. 1990;83:29–36. doi: 10.1007/BF00232190. [DOI] [PubMed] [Google Scholar]
- Tehovnik EJ, Tolias AS, Sultan F, Slocum WM, Logothetis NK. Direct and indirect activation of cortical neurons by electrical microstimulation. J Neurophysiol. 2006;96:512–521. doi: 10.1152/jn.00126.2006. [DOI] [PubMed] [Google Scholar]
- Tokuno H, Nambu A. Organization of nonprimary motor cortical inputs on pyramidal and nonpyramidal tract neurons of primary motor cortex: an electrophysiological study in the macaque monkey. Cereb Cortex. 2000;10:58–68. doi: 10.1093/cercor/10.1.58. [DOI] [PubMed] [Google Scholar]
- Tolias AS, Sultan F, Augath M, Oeltermann A, Tehovnik EJ, Schiller PH, Logothetis NK. Mapping cortical activity elicited with electrical microstimulation using FMRI in the macaque. Neuron. 2005;48:901–911. doi: 10.1016/j.neuron.2005.11.034. [DOI] [PubMed] [Google Scholar]
- Umilta MA, Brochier T, Spinks RL, Lemon RN. Simultaneous recording of macaque premotor and primary motor cortex neuronal populations reveals different functional contributions to visuomotor grasp. J Neurophysiol. 2007;98:488–501. doi: 10.1152/jn.01094.2006. [DOI] [PubMed] [Google Scholar]