

Abstract
The biology of progenitor activation in the liver is of considerable medical and scientific interest. The powerful genetic tools available for the mouse make it an ideal model system to study this complex process involving many different cell types. However, reagents for the isolation and study of distinct hepatic subpopulations have been quite limited compared to those available for hematopoietic cells. To produce cell surface reactive reagents more specific for the oval cell response, we generated a new collection of monoclonal antibodies by immunization of Fischer rats with enzymatically dispersed nonparenchymal cells from the livers of adult mice treated with 3,5-diethoxycarbonyl-1,4-dihydrocollidine. Each of the resulting antibodies recognized a surface antigen present on a liver cell subset and permitted the viable isolation of the associated subpopulation by fluorescence-activated cell sorting. Differential activity was observed on normal liver cells and at different stages of oval cell activation, indicating potential utility for progenitor cell identification. The subdivision of liver cells using these tools should facilitate the study of the biology of ductal and periductal hepatic cell types, including progenitors.
Conclusion
A new panel of surface reactive monoclonal antibodies to support investigation of the murine oval cell response has been developed.
The liver contains facultative stem cells which can be activated in response to specific kinds of injury.1 Although most hepatic regeneration is progenitor independent, liver stem cells are of great interest in regards to chronic liver diseases2,3 and may play an important role in some forms of liver cancer.4,5 Liver stem cell activation was first described in the rat, where chemical damage in combination with partial hepatectomy caused the emergence of a new cell type described according to its nuclear morphology as an oval cell.6 These cells are thought to be bipotential progenitors capable of yielding both hepatocytes and bile ducts. Despite the probable importance of the oval cell response in various pathological conditions, little is known about the molecular regulation of this process. In particular, it is not known whether the oval cell lineage is homogeneous or whether there are different kinds of hepatic progenitors. The nature of the cell which gives rise to the oval cells, that is, the putative hepatic stem cell, is unknown. An important reason for the lack of information regarding these processes is the complexity of the cellular composition of the liver, particularly during injury. Many different cell types are present including various kinds of hepatocytes, ducts, hematopoietic cells, endothelial cells, macrophages, stellate cells, and others.7
To understand the complex cross-talk between the different cell types and analyze their biological properties in detail, markers are needed to track them at the single-cell level. Although various histological markers exist and have been used for years, the tools to dissociate the liver into its constituent cell types and perform assays on particular cell populations has been rather limited. In contrast, surface markers are abundant for hematopoietic cells and have been essential for the exploration of the biology of this system.8,9 Several reports have used commercially available antibodies that recognize hematopoietic surface markers to isolate hepatic subpopulations and perform biological assays. In addition, a targeted effort was made to find markers that identify oval cells in the rat.10,11 These antibodies (particularly OV-1, which recognizes a surface antigen) have proven very useful in the study of progenitor biology in this animal. Recently, several models of oval cell activation have been developed for the mouse, an organism that is much more genetically tractable than the rat.3,12,13 Unfortunately, few tools are available to identify and isolate cells emerging during the murine oval cell response. In particular, reagents targeting surface markers are lacking. The most widely used tool for murine oval cell identification is the monoclonal antibody A6.14 Unfortunately, A6 does not bind a cell surface marker and thus cannot be used for viable cell isolation. Several hematopoietic markers such as c-kit (the receptor for stem cell factor), Sca-1 (stem cell antigen 1), Thy1 (CD90), and CD34 have been used in the mouse, but none of these specifically labels liver cell populations.15–17
To overcome this barrier to the study of oval cell response in the mouse, we developed a panel of monoclonal antibodies which react preferentially with hepatic but not hematopoietic cells. Here, we present the initial characterization of a panel of nine such surface marker–specific reagents and demonstrate their utility in cell fractionation.
Materials and Methods
Tissue Sources and Liver Cell Isolation
Liver cells were obtained from c129/S3 mice fed a Purina 5015 diet with or without supplementation with 0.1% wt/wt DDC (3,5-diethoxycarbonyl-1,4-dihydrocollidine, also known as DDTPDC [diethyl 1,4-dihydro-2,4,6-trimethyl-3,5-pyridine dicarboxylate]; Sigma-Aldrich and Harlan Tek-lad) for 2–3 weeks. Animal handling was described by protocol A268 of the institutional review committee at Oregon Health & Science University.
Optimal preparation of a single-cell suspension of nonparenchymal liver tissue required a substantially modified version of the protocol described by Wang et al.18 In order to recover a representative sample of viable liver cells, a series of increasingly aggressive enzymatic digests was employed. Initially, a standard mouse liver perfusion19 and hepatocyte isolation was performed. Remaining solid liver tissue was subjected to sequential digests (20 minutes each) of 2.5 mg/mL collagenase D (Sigma-Aldrich), 10 mg/mL collagenase D + 10 mg/mL pronase (Sigma-Aldrich), and a 10-minute digest with 0.05% trypsin/ethylene diamine tetraacetic acid (Promega). At each stage, dissociated cells were collected by passage through a 40 μm cell strainer (BD Falcon) and stored without further exposure to enzyme. Incompletely dissociated tissue/cell clusters were recovered from the strainer and exposed to the next digestion solution. Hepatocytes were excluded from nonparenchymal cell (NPC) preparations by repeated low-speed (50g) centrifugations.
For immunohistochemical screening, livers were collected from mice on control or DDC-supplemented diets for 3 weeks. Portions were embedded in Tissue-tek cry-omatrix (Sakura, Tokyo, Japan) and stored at −86°C prior to cryosectioning.
Antibody Production
Animal care and immunization procedures were performed in accordance with protocols A982 of the institutional review committee at Oregon Health & Science University. A modified subtractive immunization protocol20 was employed. Specifically, a Fisher 344 rat was preimmunized with undesirable antigens including 1 × 10⁶ hepatocytes, fetal bovine serum (FBS), and small amounts of collagenase D. Cyclo-phosphamide (Sigma-Aldrich; 51 mg/kg body weight) was then injected intraperitoneally after 24 and 48 hours to eliminate B lymphocytes reacting against these antigens. Rats were inoculated intraperitoneally with 107 nonparenchymal liver cells isolated (as described above) from a c129/S3 mouse fed a DDC-supplemented diet for 3 weeks. Inoculations were administered 19 days (dose #1) and 38 days (boost) after the initial treatment. Four days after the final immunization, animals were sacrificed and their spleens were harvested. Splenocytes were fused with SP2/0 Ag14 myeloma cells,21 and successfully fused clones were selected by growth in methylcellulose-containing HAT (hypoxanthine-aminopterin-thymidine) medium (Stem Cell Technologies Inc., Vancouver, Canada). Approximately 600 isolated clones were transferred to liquid media in 96-well plates and supernatant was collected for screening by immunohistochemistry on mouse liver sections and by flow cytometry on dispersed viable murine NPCs. Clones of interest were passaged to larger culture flasks for increased antibody production and cryopreservation.
Immunohistochemistry
Cryosections (5 μm) of mouse liver tissue were prepared using a Reichert 2800 Frigocut (Reichert Scientific Instruments) and fixed by 10-minute exposure to acetone at −20°C. After drying, slides were stored at −86°C for up to 1 month. Single antibody labeling was performed with 100 μL of undiluted hybridoma supernatant for 30 minutes. The slides were then washed in Dulbecco’s phosphate-buffered saline (DPBS) and labeled with 100 μL of secondary antibody solution (1:200 dilution of Cy3-conjugated goat anti-rat immunoglobulin G [IgG; Jackson ImmunoResearch, West Grove, PA]), 2% FBS (Hyclone), and 2% mouse serum in DPBS) for 20 minutes. DPBS was used for a final wash and storage of the slides prior to microscope evaluation using a Zeiss Axioskop 2 plus (Carl Zeiss, Jena, Germany). For dual antibody labeling, pre-treatment with avidin/biotin blocking solution (Vector Labs) was followed by incubation with the first primary antibody as described above. This antibody was detected by sequential labeling with biotinylated monovalent goat anti-rat IgG fragment (Jackson ImmunoResearch) and Alexa488-conjugated streptavidin (Invitrogen). After washing, the second primary antibody was added and detected with Cy3-conjugated goat anti-rat IgG as indicated above.
Flow Cytometry and Fluorescence-Activated Cell Sorting (FACS)
Dissociated cells were resuspended in 100 μL DPBS plus 2% FBS, combined with an equal volume of hybridoma supernatant, and stored at 4°C for 30 minutes. After a wash with cold DPBS, the cells were resuspended in 100 μL DPBS plus 2% FBS and a 1:200 dilution of fluorochrome-conjugated goat anti-rat secondary antibody (Jackson ImmunoResearch). After another wash, cells were resuspended in DPBS + 5% rat serum (Serotec) and held on ice for 10 minutes to block the secondary antibody. Primary conjugated antibodies included fluorescein isothiocyanate–conjugated anti-CD26 (clone H194-112), phycoerythrin (PE)-conjugated anti-c-kit (clone 2B8), and allophycocyanin-conjugated anti-CD45 (clone 30-F11; all BD Pharmingen). Propidium iodide staining was used to label dead cells for exclusion. Cells were analyzed using a Becton Dickinson FACSCalibur or sorted with a Cytopeia inFluxV-GS; where possible, electronic gating was used to exclude cell doublets (by forward scatter:pulse-width ratio) from analysis or collection.
RNA Isolation and Real-Time Polymerase Chain Reaction (PCR)
For molecular analysis, populations of interest were sorted directly into Trizol (Invitrogen). RNA was isolated with a chloroform extraction, isopro-panol precipitation, and ethanol wash. First-strand complementary DNA synthesis was generated by Moloney murine leukemia virus reverse transcriptase and random oligonucleotide primers (Invitrogen). RNA levels were assessed by quantitative real-time PCR using a Bio-Rad iCycler thermocycler with a single-color MyiQ detection system. All reactions were performed using 45 cycles of 15 seconds at 95°C, 18 seconds at 67°C, and 18 seconds at 72°C. Reaction mixtures included Platinum Taq DNA polymerase (Invitrogen), 2.5 mM MgCl2, 10 μM 5′ and 3′ primers, 10 mM deoxynucleotide triphosphates and 0.5′ SYBR green. The primers employed were: albumin (5′: TGTCAACCCCAACTCTCGTGGA, 3′: CACACGGTTCAGGATTGCAGACA), alpha-fetoprotein (5′: CCAGGCACTGTCCAAGCAAAGC, 3′: TCTTCCCGGTGAGGTCGATCAG), CK7 (5′: CTGGAGGTGGAACTGCGGAACA, 3′: CGTGCG-TCGGTTGATCTCCTCT), CK19 (5′: GCCGAGAA-GAACCGGAAGGATG, 3′: CAGCTCCTCAATCCG-AGCAAGGT), glyceraldehyde 3-phosphate dehydrogenase (5′: AAGGTCGGTGTGAACGGATTTGG, 3′: CGT-TGAATTTGCCGTGAGTGGAG), von Willenbrand factor (5′: TGTGGGCTGTGCGGTGATTTTA, 3′: TGGGAGGAGATGCCCGTTTACA), and desmin (5′: GAGAAACCAGCCCCGAGCAAAG, 3′: AGC-CTCGCTGACAACCTCTCCA). Each primer pair was designed to span an intron, thus minimizing amplification of contaminating genomic DNA. Gene expression levels were recorded as the difference between baseline-corrected, curve-fitted cycle thresholds for the gene of interest minus the cycle threshold of mouse glyceraldehyde 3-phosphate dehydrogenase.
Results
Monoclonal Antibody Production
Rats were immunized with NPCs from a DDC-treated mouse to increase representation of rare populations such as oval cells. Subtractive immunization was used to reduce the contribution of undesired antigens.20 To maximize cell recovery from DDC-treated liver, which is resistant to perfusion and ex vivo tissue digestion, a four-stage cell isolation protocol was employed.
Hybridoma supernatants were first screened for selective activity against acetone-fixed mouse liver tissue sections, but only those that also bound the surface of viable dissociated single cells as demonstrated by flow cytometric analysis were analyzed further. Table 1 lists hybridomas that met these criteria and reproducibly recognized cell subsets of interest. In each case, positively labeled cells were more abundant in DDC-treated than in untreated tissue, but the recovery of such cells varied from sample to sample as indicated.
Table 1.
Monoclonal Antibodies Recognizing Surface Antigens on Subsets of Mouse Liver Cells
| Antibody | Isotype | Classification | Percent of CD45- Liver NPCs Positive |
|
|---|---|---|---|---|
| Untreated | DDC-treated | |||
| MIC1-1C3 | rat IgM | Ductal | 8–24 | 19–60 |
| OC2-1C6 | rat IgG1 | Periductal | <1 | 4–30 |
| OC2-1D11 | rat IgG1 | Ductal | 0–10 | 14–60 |
| OC2-2A6 | rat IgG1 | Periductal | <1 | 2–29 |
| OC2-2F3 | rat IgG1 | Ductal | <1 | 1–21 |
| OC2-3C5 | rat IgG1 | Periductal + | 5–22 | 21–58 |
| OC2-3C7 | rat IgG1 | Periductal | 1–7 | 2–10 |
| OC2-4E8 | rat IgG1 | Periductal | 0–10 | 22–48 |
| OC2-6E10 | rat IgG1 | Periductal | <1 | 1–11 |
Antibody labeling patterns are classified as ductal or periductal based on specificities observed on liver tissue sections. The ranges of cell labeling frequencies are based on the evaluation of four CD45- NPC preparations by flow cytometry.
Characterization of Hepatic Cell Subset Labeling
Several antibodies gave differential labeling between normal and DDC-treated liver tissue as shown in Fig. 1. Duct marker macrophage inhibitory cytokine-1–1C3 (MIC1-1C3) (Fig. 1A,B) labeled many more cells in DDC- treated tissue as a consequence of ductal proliferation. This trend was also true for duct markers oval cell-2–1D11 (OC2-1D11) (Fig. 1E,F) and OC2-2F3 (Fig. 1I,J), but these antibodies did not detectably label ducts in the absence of DDC treatment. This may indicate specificity for proliferating duct cells. Periductal markers also fell into two categories based on the extent to which normal tissue was labeled. OC2-1C6 (Fig. 1C,D), OC2-2A6 (Fig. 1G,H), and OC2-6E10 (Fig. 1Q,R) bound antigens that are rare in normal tissue but become much more abundant upon oval cell activation. In contrast, OC2-3C5 (Fig. 1K,L), OC2-3C7 (Fig. 1M,N), and OC2-4E8 (Fig. 1O,P) recognized antigens in untreated liver but did so to a greater extent with DDC treatment. The labeling patterns of these antibodies on DDC-treated tissue were also compared with that of the classic oval cell activation marker A6, as shown in Fig. 2. MIC1-1C3 (Fig. 2A), OC2-1D11 (Fig. 2C), and OC2-2F3 (Fig. 2E) each label a subset of A6-positive cells in liver tissue after 21 days of DDC treatment. Very limited colabeling was observed with OC2-3C5 (Fig. 2F), which identifies some duct cells despite its primarily periductal pattern. The remaining antibodies recognize A6-negative cells, illustrating that A6 does not mark all cell types which arise de novo during the oval cell response.
Fig. 1.

Antibody labeling of cell subsets in normal and DDC-treated mouse liver tissue. Mouse liver cryosections (5 μm) were labeled with supernatants from hybridoma cell lines with liver cell subset specificity. For each antibody, labeling on normal liver tissue (left) is compared to that of liver from a mouse fed a DDC-supplemented diet for 3 weeks (right). The secondary antibody was Cy3-conjugated anti-rat IgG adsorbed against mouse serum protein; nuclei were labeled with Hoechst 33342. Original magnification: 200×, inset: 1600×.
Fig. 2.
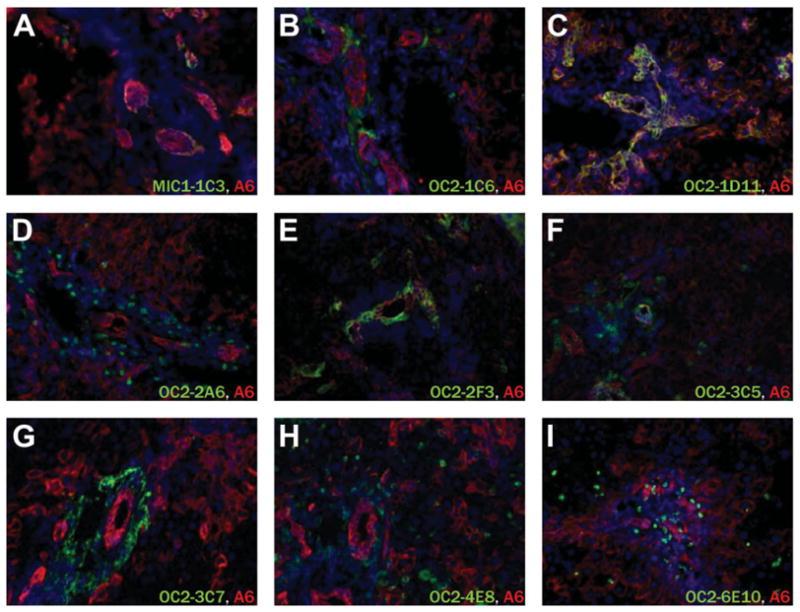
Comparative labeling with the A6 oval cell marker on DDC-treated mouse liver tissue. Acetone-fixed cryosections were labeled with both A6 antibody (red) and the indicated antibody (green). Because each primary antibody is an unconjugated rat IgG, sequential labeling and a monovalent initial secondary antibody were employed. Nuclei were labeled with Hoechst 33342.
Figure 3 shows representative examples of viable CD45− NPC labeling by each antibody, confirming recognition of a surface antigen. Although CD45 has been reported to be expressed on A6-positive cells,15 the current consensus is that liver progenitors are CD45−.18,22 The intensity of labeling varied between antibodies, but in each case the frequency of positively labeled cells was higher in DDC-treated liver. Labeling with MIC1-1C3 proved to be more complicated in the latter, with a small subpopulation of brightly labeled cells (Fig. 3D). A small number of surface markers have previously been reported to bind subsets of nonhematopoietic mouse liver NPCs, such as Sca-1, CD26, and EpCAM (epithelial cell adhesion molecule). None of the antibodies reported here have a labeling pattern identical to these markers, but combined labeling revealed potentially interesting cell subpopulations. Figure 4 shows combined labeling of commercial antibodies recognizing these established antigens with the novel antibodies described here. Sca-1, a hematopoietic stem cell marker reported to be expressed on mouse oval cells,15 was found on a large percentage of CD45− NPCs in both normal and DDC-treated liver. This differs from the report of Petersen et al., who found no Sca-1 expression in normal liver. Comparison to the negative control (Fig. 4A) showed that OC2-1D11+ cells (Fig. 4B) and OC2-3C7+ cells (Fig. 4C) existed in both Sca-1+ and Sca-1− varieties. Fractionation of the Sca-1+ population with these markers may facilitate progenitor isolation. Most OC2-1D11+ duct cells coexpressed CD26 (Fig. 4E), but a subpopulation was CD26−. OC2-3C5, which has a complex labeling pattern including both periductal cells and a duct cell subset, binds more CD26− than CD26+ cells (Fig. 4F). EpCAM, which has been reported to be expressed on human liver progenitor cells,23 was observed on a large proportion of NPCs even in untreated mouse liver (Fig. 4H). OC2-1D11+ cells, which are rare in untreated liver, appear in both EpCAM+ and EpCAM− varieties. Thus, our novel antibodies are distinct from those previously described and can be used in combination to further resolve NPC subpopulations.
Fig. 3.

Flow cytometric assessment of binding to viable dissociated mouse liver cells. Dead cells were excluded by gating for propidium iodide negative events; hematopoietic cells were excluded by gating for CD45− events; and debris, cell clusters, erythrocytes, and hepatocytes were excluded by FSC/SSC gating. NPCs from normal and DDC-treated livers were sequentially labeled with the primary antibody and a PE-conjugated anti-rat IgG secondary antibody. The indicated gate for PE-positive events was set based on the negative control samples (A,B).
Fig. 4.

Novel antibody labeling on liver NPCs is distinct from that of previously reported antibodies. (A,D,G) Negative controls indicate labeling with isotype control antibodies. Examples of comparative labeling with the antibodies described here and (B,C) Sca-1, (E,F) CD26/DPPIV, or (H) EpCAM are shown. EpCAM versus OC2-1D11 labeling is shown for (G,H) NPCs from untreated liver, whereas (A–F) the Sca-1 and CD26 comparisons used DDC-treated NPCs.
Because large numbers of hematopoietic cells copurify with liver NPCs, particularly with DDC treatment, we investigated the tissue specificity of these antibodies. Most did not bind hematopoietic cells, as illustrated by the negative binding of OC2-1C6 to bone marrow cells (Fig. 5B). The exceptions are OC2-2F3 (Fig. 5C), which recognized a subset of marrow cells (in addition to a subset of liver NPCs), OC2-4E8 (Fig. 5D), in which very weak labeling was observed on marrow, and OC2-6E10 (Fig. 5E). Furthermore, the duct marker MIC1-1C3 was also found to specifically label ducts in the pancreas (data not shown).
Fig. 5.

A subset of antibodies binds hematopoietic cells. Bone marrow cells were collected from a mouse femur and labeled with the indicated antibodies. A small amount of nonspecific labeling was observed with (A) the secondary antibody alone or (B) with primary antibodies that do not bind marrow cells (for example, OC2-1C6). Plots in (C–E) illustrate positive labeling by the antibodies that recognize subsets of hematopoietic cells.
Dynamics of Antigen Expression During Oval Cell Activation
The DDC-induced murine oval cell response includes inflammation, progressive ductal proliferation, and the accumulation of oval cells over a period of 3 weeks. Antibodies that exhibited changes in the extent or type of labeling in this interval are presented in Fig. 6; CK19 labeling of ducts is shown for comparison. Colabeling of CK19 and the new antibodies is similar to that of A6; OC2-1D11+ and OC2-2F3+cells are CK19+, and the other antibodies recognize CK19− cells. One exception is OC2-3C7, which recognizes CK19+ and some CK19− periductal cells in untreated liver but only CK19− cells after DDC treatment. In general, signals were rare but detectable at early time points and became more extensive over time, reaching a maximum at day 21. However, OC2-3C7 binding was already maximal at day 3, indicating an early response to DDC treatment. Conversely, binding by duct subset marker OC2-2F3 exhibited a delayed response and was not readily detected until day 21. Another pattern was demonstrated by OC2-6E10 binding, which reached a maximum at day 14 and declined by day 21. This may indicate down-regulation of the associated antigen or loss of a transiently activated OC2-6E10+ population. These labeling patterns were consistent in multiple sections from different animals. Any variation observed was also reflected in the detection of CK19.
Fig. 6.

Antibody labeling patterns change during oval cell activation. Cryosections of liver tissue obtained from mice after the indicated duration of DDC treatment were labeled with OC2 antibody supernatants (red) and rabbit anti-mouse CK19 (green). Secondary antibodies included Cy3-conjugated goat anti-rat IgG and Alexa488-conjugated donkey anti-rabbit IgG. Nuclei were labeled with Hoechst 33342. Original magnification: 200×, inset: 1600×.
Molecular Characterization of Liver Cell Subpopulations
Relevant gene expression levels in antibody-de-fined liver cell populations are listed in Table 2. These populations were compared with normal hepatocytes and unfractionated NPCs from a DDC-treated animal. As expected, a comparison of MIC1-1C3+and MIC1-1C3− NPCs isolated from untreated liver revealed higher levels of duct-associated genes CK7 and CK19 in the former. Interestingly, this trend was much weaker when MIC1-1C3 was used to separate NPCs from DDC-treated liver. Each sorted DDC-treated NPC fraction contained detectable messenger RNA associated with multiple hepatic lineages, suggesting the presence of multiple cell types or that some of the cells within these populations coexpressed markers of multiple lineages. OC2-1D11+NPCs, which also showed no enrichment of duct-associated gene expression despite a cholangiocyte labeling pattern by immunohistochemistry, had elevated alpha-fetoprotein messenger RNA suggestive of a progenitor-associated population. Combined labeling with multiple antibodies should permit a greater degree of cell type enrichment, and single-cell quantitative PCR should determine whether individual cells coexpress duct and hepatocyte markers.
Table 2.
Molecular Characterization of Gene Expression in Sorted Subpopulations of Normal and DDC-Treated Liver Cells
| CK7 | CK19 | Albumin | Desmin | vWF | AFP | |||
|---|---|---|---|---|---|---|---|---|
| DDC-treated CD45- NPC | 1 | 1 | 1 | 1 | 1 | 1 | ||
| Untreated CD45- NPC | ↓ 0.26 | = 0.58 | = 0.72 | ↓ 0.38 | ↓ 0.44 | ↓ 0.40 | ||
| Hepatocytes | ↓ 0.06 | ↓ 0.13 | ↑ 15.1 | = 0.85 | = 1.12 | ↑ 16.1 | ||
| Untreated CD45- NPC | MIC1-1C3 | + | ↑ 6.93 | ↑ 15.5 | = 0.64 | ↓ <0.01 | ↓ 0.47 | ↑ 2.76 |
| − | ↓ 0.39 | = 0.81 | ↓ 0.28 | = 1.16 | ↓ 0.34 | ↓ 0.14 | ||
| DDC treated CD45- NPC | MIC1-1C3 | + | = 1.02 | = 1.34 | = 0.53 | ↓ 0.17 | ↓ 0.07 | ↑ 3.25 |
| − | = 0.55 | = 0.77 | = 1.18 | = 1.62 | = 1.93 | ↓ 0.46 | ||
| OC2-1C6 | + | ↓ 0.12 | ↓ 0.21 | ↓ 0.26 | ↑ 3.59 | ↓ 0.11 | ↓ 0.31 | |
| − | = 0.67 | = 0.81 | = 0.85 | = 1.06 | ↓ 0.44 | = 1.74 | ||
| OC2-1D11 | + | = 0.70 | = 0.65 | ↓ 0.34 | = 0.84 | ↓ 0.38 | = 1.18 | |
| − | ↓ 0.28 | ↓ 0.24 | ↓ 0.19 | ↑ 2.31 | ↑ 2.48 | ↓ 0.19 | ||
| OC2-2A6 | + | ↑ 2.67 | ↑ 15.4 | ↓ 0.13 | ↓ 0.18 | ↓ 0.17 | ↓ <0.01 | |
| − | ↑ 3.74 | ↑ 2.42 | = 1.15 | ↑ 3.62 | ↑ 2.28 | = 1.24 | ||
| OC2-2F3 | + | = 1.40 | ↑ 3.69 | = 0.54 | ↓ 0.43 | ↓ 0.20 | ↓ 0.46 | |
| − | = 1.49 | = 1.05 | ↓ 0.35 | = 1.16 | = 1.80 | ↓ <0.01 | ||
| OC2-3C5 | + | ↓ 0.22 | = 0.60 | = 0.65 | = 1.70 | = 0.52 | ↓ 0.45 | |
| − | = 1.50 | = 1.83 | = 0.62 | = 1.24 | = 0.86 | = 1.18 | ||
| OC2-3C7 | + | ↓ 0.20 | ↓ 0.41 | = 0.71 | = 0.66 | ↓ 0.13 | ↑ 2.22 | |
| − | ↓ 0.39 | = 0.84 | = 0.92 | ↑ 2.09 | ↓ 0.31 | ↓ 0.47 | ||
| OC2-4E8 | + | ↓ 0.23 | ↓ 0.25 | ↓ 0.24 | ↓ 0.28 | ↓ 0.14 | = 0.94 | |
| − | = 0.54 | = 0.87 | ↓ 0.36 | = 0.51 | = 0.50 | = 0.52 | ||
| OC2-6E10 | + | = 1.21 | ↑ 3.13 | ↓ 0.28 | = 0.74 | ↓ 0.11 | = 1.36 | |
| − | = 1.10 | = 1.59 | = 0.68 | = 1.53 | ↑ 2.41 | = 0.96 |
Complementary DNA was obtained from cells isolated from DDC-treated liver tissue by FACS (50,000 cells per sort) and assessed by QPCR for the expression of representative genes. Individual ΔCt results were normalized to GAPDH and are reported relative to the levels observed in unsorted NPC from DDC-treated liver. The normalized ΔCt results used were the averages of three independent cDNA amplifications.
Discussion
Here, we present the development of a panel of novel antibodies raised against hepatic NPCs from mice undergoing oval cell activation. We used a nonbiased cell immunization technique not aimed at specific antigens, but using the cell population of interest and screening for differential labeling of normal and oval cell activated liver tissue. This is analogous to the approach used successfully for the development of most blood cell surface markers in use for clinical applications and research today.24,25 Although the genes encoding antigens recognized by the vast majority of CD monoclonal antibodies (CD4, CD8, CD34, CD45, etc.) were not isolated until many years later,26 these antibodies have proved crucial in the delineation of the immune system and hematopoiesis.27 Specifically, surface markers facilitated understanding of the complex heterogeneity of different cell types and their function in these organ systems. Research on solid organ stem cells, including hepatic progenitors, has been hampered by the lack of availability of similar reagents. The antibodies developed herein represent a first step toward resolving questions regarding cellular heterogeneity within the liver. It is clear from a simple immunohistochemistry time course during DDC-induced cell activation that it is an oversimplification to regard “oval cells” as a homogeneous entity; at least two different new cell types emerge during this injury. First, there is proliferation of a cell type with ductular characteristics, delineated by MIC1-1C3, OC2-1D11, and OC2-2F3 labeling. OC2-1D11+ and OC2-2F3+ cells are undetectable or absent without DDC treatment, suggesting that these cells are distinct from normal cholangiocytes or that the associated antigens are expressed as a consequence of proliferation. Another class of cells (positive for OC2-1C6, OC2-2A6, or OC2-6E10) is rare or absent in normal liver but appear in abundance in a periductal position during the oval cell activation process. It is not clear that these cells are a homogeneous group; for example, OC2-6E10+ cells are detectable at day 3 whereas OC2-2A6+ cells are absent before day 7. Which of these populations contains the classical “oval cells”, the bipotential precursor to both hepatocytes and bile ducts? Oval cells in the rat are fairly distinct from simple ducts in their morphology28 and thus the periductal cells seen here in the mouse may be most the analogous cell type. Future studies will be needed to determine the exact nature of the different cells delineated by the antibodies reported here.
We demonstrated the utility of the antibodies not only for immunohistochemistry, but also for cell separation in protease digested single-cell suspensions. Double-staining with commercially available anti-blood antibodies clearly showed that the new markers are not redundant with existing antibodies and can be used to further fractionate populations such as Sca-1+ cells. It is important to note that the antigenically distinct populations identified by FACS may not correspond exactly to the immunohistochemical marking. There are several reasons for this. First, the cell preps used for FACS are obtained using a fairly harsh protease digestion. Fragile cells may therefore be underrepresented or even absent in the NPC fractions used for FACS. Conversely, some cell types may not be efficiently dispersed to a single-cell state, despite the optimized protocol employed; these would be lost during filtration and/or rejected by the flow cytometer during electronic gating. Finally, protease action may also remove some antigens from the surface of weakly positive cells, thus generating “false negative” cells. As a result, positively labeled cell fractions may prove to be more consistent and therefore useful than their negative counterparts. Preliminary experiments with short-term culture revealed no evidence of the “recovery” of detectable antigen, but protease-induced antigen loss remains a theoretical concern.
We performed a partial characterization of FACS-sorted populations by quantitative PCR of specific genes of interest. This analysis demonstrated different patterns of gene expression for distinct antigenically defined populations of liver cells and thus validated the notion of significant cellular heterogeneity. The discrepancy between NPCs from DDC-treated and untreated liver when cells were isolated using the duct-labeling antibody MIC1-1C3 is interesting, and suggests duct heterogeneity or significant changes in gene expression during ductal proliferation. Indeed, several of the populations isolated from DDC-treated NPCs exhibit surprising gene expression patterns. A future comparison of these populations isolated from liver exposed to different stimuli (including alternative oval cell activation models) will establish the extent to which this is a specific consequence of the DDC model. It should be emphasized, however, that these differences in do not necessarily indicate the existence of completely separate cell lineages. Instead, the expression of the antigens may reflect different stages of maturation in the same lineage.
Much work remains to be done to fully exploit the antibodies described here. With these novel reagents, it is possible to perform microarray analysis of distinct liver cell populations during the oval cell response and in normal liver. These studies may discover the mechanisms of intercellular signaling that govern oval cell activation. Similarly, the proliferation and differentiation potentials of specific populations within the liver can be assayed by tissue culture and transplantation experiments. In analogy to what has been achieved in the hematopoietic system, it may even become possible to purify the elusive liver stem cell itself.
Acknowledgments
Supported by National Institutes of Health grant DK051592 (M.G.).
We are grateful for the assistance of Martina Ralle and Tamara Horton, who provided tissue sections for immunohistochemistry.
Abbreviations
- DDC
3,5-diethoxycarbonyl-1,4-dihydrocollidine
- DPBS
Dulbecco’s phosphate-buffered saline
- FBS
fetal bovine serum
- NPC
nonparenchymal cell
- PCR
polymerase chain reaction
- PE
phycoerythrin
Footnotes
Potential conflict of interest: Nothing to report.
References
- 1.Fausto N, Campbell JS, Riehle KJ. Liver regeneration. Hepatology. 2006;43:S45–S53. doi: 10.1002/hep.20969. [DOI] [PubMed] [Google Scholar]
- 2.Crosby HA, Hubscher S, Fabris L, Joplin R, Sell S, Kelly D, et al. Immunolocalization of putative human liver progenitor cells in livers from patients with end-stage primary biliary cirrhosis and sclerosing cholangitis using the monoclonal antibody OV-6. Am J Pathol. 1998;152:771–779. [PMC free article] [PubMed] [Google Scholar]
- 3.Yang S, Koteish A, Lin H, Huang J, Roskams T, Dawson V, et al. Oval cells compensate for damage and replicative senescence of mature hepatocytes in mice with fatty liver disease. Hepatology. 2004;39:403–411. doi: 10.1002/hep.20082. [DOI] [PubMed] [Google Scholar]
- 4.Caldwell SH, Crespo DM, Kang HS, Al-Osaimi AM. Obesity and hepatocellular carcinoma. Gastroenterology. 2004;127:S97–S103. doi: 10.1053/j.gastro.2004.09.021. [DOI] [PubMed] [Google Scholar]
- 5.Alison MR. Liver stem cells: implications for hepatocarcinogenesis. Stem Cell Rev. 2005;1:253–260. doi: 10.1385/SCR:1:3:253. [DOI] [PubMed] [Google Scholar]
- 6.Shinozuka H, Lombardi B, Sell S, Iammarino RM. Early histological and functional alterations of ethionine liver carcinogenesis in rats fed a choline-deficient diet. Cancer Res. 1978;38:1092–1098. [PubMed] [Google Scholar]
- 7.Paku S, Schnur J, Nagy P, Thorgeirsson SS. Origin and structural evolution of the early proliferating oval cells in rat liver. Am J Pathol. 2001;158:1313–1323. doi: 10.1016/S0002-9440(10)64082-5. [DOI] [PMC free article] [PubMed] [Google Scholar]
- 8.Lanier LL, Engleman EG, Gatenby P, Babcock GF, Warner NL, Herzen-berg LA. Correlation of functional properties of human lymphoid cell subsets and surface marker phenotypes using multiparameter analysis and flow cytometry. Immunol Rev. 1983;74:143–160. doi: 10.1111/j.1600-065x.1983.tb01088.x. [DOI] [PubMed] [Google Scholar]
- 9.Spangrude GJ, Heimfeld S, Weissman IL. Purification and characterization of mouse hematopoietic stem cells. Science. 1988;241:58–62. doi: 10.1126/science.2898810. [DOI] [PubMed] [Google Scholar]
- 10.Dunsford HA, Sell S. Production of monoclonal antibodies to preneoplastic liver cell populations induced by chemical carcinogens in rats and to transplantable Morris hepatomas. Cancer Res. 1989;49:4887–4893. [PubMed] [Google Scholar]
- 11.Dunsford HA, Karnasuta C, Hunt JM, Sell S. Different lineages of chemically induced hepatocellular carcinoma in rats defined by monoclonal antibodies. Cancer Res. 1989;49:4894–4900. [PubMed] [Google Scholar]
- 12.Preisegger KH, Factor VM, Fuchsbichler A, Stumptner C, Denk H, Thorgeirsson SS. Atypical ductular proliferation and its inhibition by transforming growth factor beta1 in the 3,5-diethoxycarbonyl-1,4-dihydrocollidine mouse model for chronic alcoholic liver disease. Lab Invest. 1999;79:103–109. [PubMed] [Google Scholar]
- 13.Akhurst B, Croager EJ, Farley-Roche CA, Ong JK, Dumble ML, Knight B, et al. A modified choline-deficient, ethionine-supplemented diet protocol effectively induces oval cells in mouse liver. Hepatology. 2001;34:519–522. doi: 10.1053/jhep.2001.26751. [DOI] [PubMed] [Google Scholar]
- 14.Faktor VM, Engel’gardt NV, Iazova AK, Lazareva MN, Poltoranina VS, Rudinskaia TD. Common antigens of oval cells and cholangiocytes in the mouse. Their detection by using monoclonal antibodies [in Russian] On-togenez. 1990;21:625–632. [PubMed] [Google Scholar]
- 15.Petersen BE, Grossbard B, Hatch H, Pi L, Deng J, Scott EW. Mouse A6-positive hepatic oval cells also express several hematopoietic stem cell markers. Hepatology. 2003;37:632–640. doi: 10.1053/jhep.2003.50104. [DOI] [PubMed] [Google Scholar]
- 16.Jin C, Li W, Xu F, Zhu J, He Z, Hu Y. Blocking SCF/c-Kit signal did not inhibit the proliferation of cultured liver progenitor cells. IUBMB Life. 2007;59:458–464. doi: 10.1080/15216540701541065. [DOI] [PubMed] [Google Scholar]
- 17.Tsuchiya A, Heike T, Baba S, Fujino H, Umeda K, Matsuda Y, et al. Sca-1+ endothelial cells (SPECs) reside in the portal area of the liver and contribute to rapid recovery from acute liver disease. Biochem Biophys Res Commun. 2008;365:595–601. doi: 10.1016/j.bbrc.2007.10.150. [DOI] [PubMed] [Google Scholar]
- 18.Wang X, Foster M, Al-Dhalimy M, Lagasse E, Finegold M, Grompe M. The origin and liver repopulating capacity of murine oval cells. Proc Natl Acad Sci U S A. 2003;100(Suppl 1):11881–11888. doi: 10.1073/pnas.1734199100. [DOI] [PMC free article] [PubMed] [Google Scholar]
- 19.Overturf K, Al-Dhalimy M, Tanguay R, Brantly M, Ou CN, Finegold M, et al. Hepatocytes corrected by gene therapy are selected in vivo in a murine model of hereditary tyrosinaemia type I. Nat Genet. 1996;12:266–273. doi: 10.1038/ng0396-266. [DOI] [PubMed] [Google Scholar]
- 20.Williams CV, Stechmann CL, McLoon SC. Subtractive immunization techniques for the production of monoclonal antibodies to rare antigens. Biotechniques. 1992;12:842–847. [PubMed] [Google Scholar]
- 21.Kohler G, Milstein C. Continuous cultures of fused cells secreting antibody of predefined specificity. Nature. 1975;256:495–497. doi: 10.1038/256495a0. [DOI] [PubMed] [Google Scholar]
- 22.Kamiya A, Gonzalez FJ, Nakauchi H. Identification and differentiation of hepatic stem cells during liver development. Front Biosci. 2006;11:1302–1310. doi: 10.2741/1884. [DOI] [PubMed] [Google Scholar]
- 23.Dan YY, Riehle KJ, Lazaro C, Teoh N, Haque J, Campbell JS, et al. Isolation of multipotent progenitor cells from human fetal liver capable of differentiating into liver and mesenchymal lineages. Proc Natl Acad Sci U S A. 2006;103:9912–9917. doi: 10.1073/pnas.0603824103. [DOI] [PMC free article] [PubMed] [Google Scholar]
- 24.Raff MC. Surface antigenic markers for distinguishing T and B lymphocytes in mice. Transplant Rev. 1971;6:52–80. doi: 10.1111/j.1600-065x.1971.tb00459.x. [DOI] [PubMed] [Google Scholar]
- 25.Sunderland CA, McMaster WR, Williams AF. Purification with monoclonal antibody of a predominant leukocyte-common antigen and glycoprotein from rat thymocytes. Eur J Immunol. 1979;9:155–159. doi: 10.1002/eji.1830090212. [DOI] [PubMed] [Google Scholar]
- 26.Kitamura K, Matsuda A, Motoya S, Takeda A. CD45-associated protein is a lymphocyte-specific membrane protein expressed in two distinct forms. Eur J Immunol. 1997;27:383–388. doi: 10.1002/eji.1830270207. [DOI] [PubMed] [Google Scholar]
- 27.Bryder D, Rossi DJ, Weissman IL. Hematopoietic stem cells: the paradigmatic tissue-specific stem cell. Am J Pathol. 2006;169:338–346. doi: 10.2353/ajpath.2006.060312. [DOI] [PMC free article] [PubMed] [Google Scholar]
- 28.Sells MA, Katyal SL, Shinozuka H, Estes LW, Sell S, Lombardi B. Isolation of oval cells and transitional cells from the livers of rats fed the carcinogen DL-ethionine. J Natl Cancer Inst. 1981;66:355–362. [PubMed] [Google Scholar]