

Abstract
Spatiotemporal changes in gene expression underlie many evolutionary novelties in nature. However, the evolutionary origins of novel expression patterns, and the transcriptional control elements (“enhancers”) that govern them, remain unclear. Here, we sought to explore the molecular genetic mechanisms by which new enhancers arise. We undertook a survey of closely related Drosophila species to identify recently evolved novel gene expression patterns and traced their evolutionary history. Analyses of gene expression in a variety of developing tissues of the Drosophila melanogaster species subgroup revealed high rates of expression pattern divergence, including numerous evolutionary losses, heterochronic shifts, and expansions or contractions of expression domains. However, gains of novel expression patterns were much less frequent. One gain was observed for the Neprilysin-1 (Nep1) gene, which has evolved a unique expression pattern in optic lobe neuroblasts of Drosophila santomea. Dissection of the Nep1 cis-regulatory region localized a newly derived optic lobe enhancer activity to a region of an intron that has accumulated a small number of mutations. The Nep1 optic lobe enhancer overlaps with other enhancer activities, from which the novel activity was co-opted. We suggest that the novel optic lobe enhancer evolved by exploiting the cryptic activity of extant regulatory sequences, and this may reflect a general mechanism whereby new enhancers evolve.
Keywords: cis regulation, enhancer evolution, gene regulation, novelty
Evolution does not produce novelties from scratch. It works on what already exists, either transforming a system to give it new functions or combining several systems to produce a more elaborate one.
François Jacob, Evolution and Tinkering (Science, 1977, volume 196:1161–1166)
Understanding the genetic origins of biological novelties remains one of the central quests of evolutionary biology. One of the greatest surprises of the genomic era has been the finding that very different animals are built using a similar set of genes (1–3). One proposal to reconcile the apparent discrepancy between genetic conservation and animal diversity is that changes in gene regulation may underlie much evolutionary change (4–6). Although many cases of regulatory sequence evolution have been elucidated (7–16), there are relatively few cases in which the evolutionary origins of novel gene regulatory functions have been determined.
New patterns of gene expression may arise by a variety of mechanisms involving both changes to upstream regulators (change in trans) and mutations of noncoding regulatory DNA sequences (e.g., enhancers) of a gene (change in cis). One key mystery concerning how cis-regulatory mutations generate novel expression patterns is the evolutionary origin of enhancers themselves. Multiple possible mechanisms could account for how the tens of thousands of enhancers in individual animal genomes arose. These mechanisms fall into four general categories: de novo evolution, transposition, promoter switching, and co-option. The main distinguishing character among these mechanisms is the degree of preexisting regulatory information upon which the new activity evolves.
It is known that apparently nonfunctional stretches of “junk” DNA in the genome often harbor sequences that contain binding sites for various transcription factors (TFs) (17). It would seem possible, then, that such regions could acquire a series of random point mutations or small indels that generate functional regulatory sequences (18). However, the extent to which enhancers evolve purely de novo is unknown, and we are unaware of any empirical examples of its occurrence, at least in metazoans. Thus, the proposed mechanisms for generating new expression patterns are largely founded on preexisting regulatory sequences.
The potential role of transposable elements (TEs) in the evolution of gene regulation has long been recognized (19, 20), and TEs are currently thought to provide a common route by which regulatory DNA sequences evolve (21). In the case of the evolution of pesticide resistance in Drosophila, TE sequences appear to have contained a preexisting combination of TF binding sites sufficient to drive gene expression autonomously and to have conferred this activity to an adjacent gene (22, 23).
Novel enhancer-promoter interactions provide another route for new expression patterns to evolve. Various noncoding DNA elements, such as insulators (24) and promoter-proximal tethering elements (25, 26), are known to govern enhancer-promoter specificity. Mutations in such sequences could allow for “promoter switching” to occur. One example of this phenomenon is a chromosomal inversion within the insect tinman gene complex in which an enhancer of the ladybird gene has relocated next to the adjacent gene, circumventing an insulator element that would otherwise prevent this association (27).
The co-option of existing regulatory sequences to derive novel functions provides another path to evolving a new enhancer activity. In this scenario, an enhancer active in one particular tissue may acquire an activity in additional cells or tissues. Enhancers require numerous TF inputs for their expression, and most TFs are expressed at multiple times and locations during the life of an animal (3, 28). This raises the possibility that an existing enhancer could acquire a few additional binding sites, which may promote gene expression in a new location. The origins of lens crystallins, prominent light-refracting proteins of the vertebrate eye, provide classic examples of regulatory co-option (29). Before adapting to a role in vision, many crystallins had ancestral functions in stress response. A common means by which the lens-biased expression of these enzymes evolved has been the modification of broadly active promoters to drive high levels of expression in the lens (30). Similarly, the novel high-level expression of the yellow pigmentation gene in the developing wing spots of Drosophila biarmipes arose through noncoding mutations in a preexisting yellow gene enhancer (31).
One key challenge in reconstructing the origins of novel gene regulatory functions is the amount of time that has elapsed since a given novelty arose. In general, the deeper in time, the more difficult it is to pinpoint the minimal functional mutations involved. Therefore, to capture and analyze more recent instances of gene expression novelties, we have screened recently diverged species for novel expression patterns. We analyzed 20 genes in at least four species of the Drosophila melanogaster species group for interspecific differences in gene expression. We found that the gain of novel expression patterns was rare in comparison with changes in transcript abundance, shifts in timing, and losses of patterns. In one gene, Neprilysin-1 (Nep1), we traced a novel expression pattern in the developing visual system of Drosophila santomea to a recently evolved enhancer. We discovered that the enhancer's activity was derived through the co-option of existing enhancer sequences active in other tissues. Furthermore, we found that the starting point of this co-option was a latent activity in the optic lobes. These findings shed light on the genetic paths that lead to the origin of new enhancers.
Results
Identification of Novel Gene Expression Patterns in Imaginal Discs of Drosophila Species.
To investigate how novel patterns of gene expression arise, we devised a survey of tissues in the developing larvae of the D. melanogaster species subgroup. Our choices of species, tissues, and genes to survey were intended to optimize identification of recently evolved novelties. The melanogaster subgroup is composed of multiple closely related sister species, several of which have diverged by less than 1 million years, for which genome sequences have been obtained (32) (Fig. 1). The developing larvae of Drosophila contain a set of imaginal discs that form most of the adult exoskeleton and are well-suited for gene expression analysis. Recent genome-wide studies of imaginal disc gene expression have identified many spatially regulated genes that encode proteins with a wide range of functions (33, 34). Surprisingly, many identified genes fail to give a phenotype when their expression is knocked down by RNAi (35), suggesting that constraints to maintain these gene expression patterns may be minimal, and therefore could evolve rapidly.
Fig. 1.
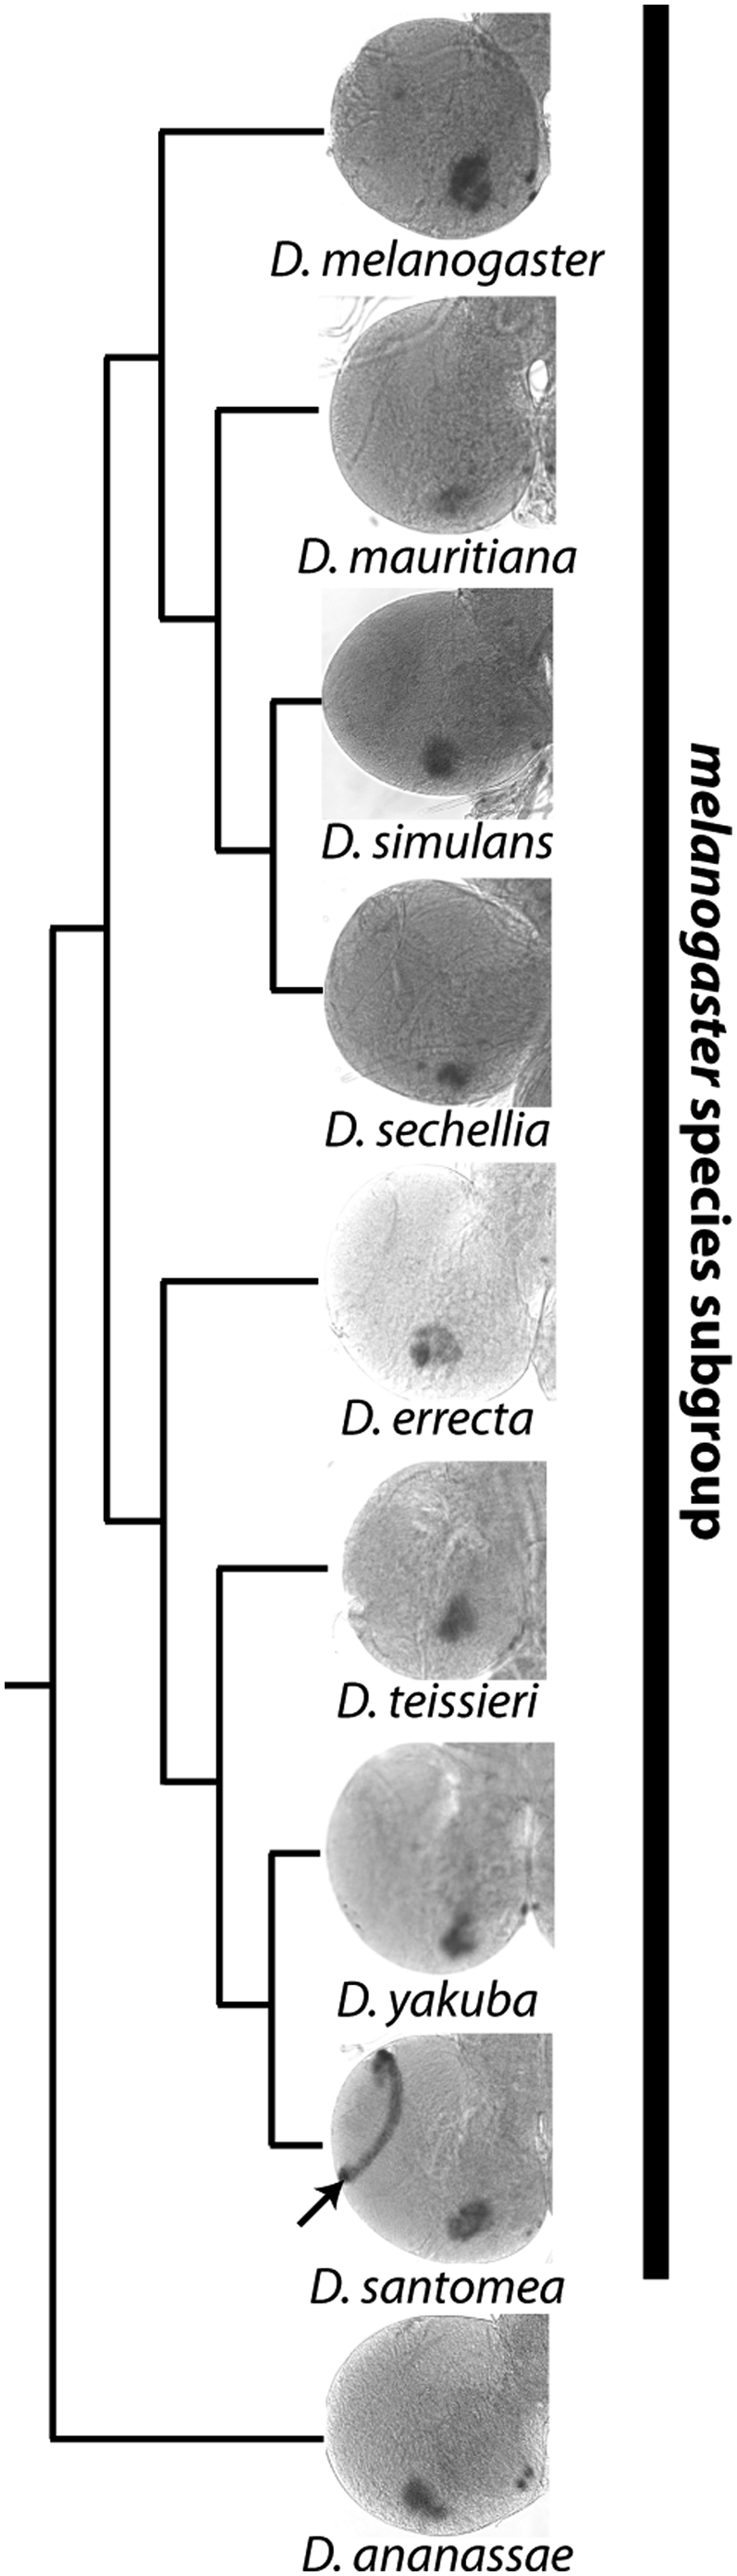
Recent evolution of Nep1 gene expression in D. santomea. The third instar larval brains of Drosophila species generally exhibit Nep-1 expression in the mushroom bodies. However, in D. santomea, Nep-1 is also expressed at high levels in laminar neuroblasts of the developing visual system (arrow).
We selected 20 candidate loci among these less-constrained genes (Table 1) and performed in situ hybridization on five different imaginal disc tissues in D. melanogaster and its three closest sister species, with the goal of identifying patterns of expression unique to one species. In the initial survey, genes fell into three broad categories: those whose patterns were essentially conserved among species, those in which the spatial domain of expression has shifted among species, and those that displayed some spatial domain of gene expression (“feature”) that was not present in every species. Eight of 20 genes displayed relatively conserved expression patterns in all the discs in which they were expressed, and most were expressed in multiple imaginal discs. Additionally, all the genes surveyed had at least one (and typically more) feature conserved among species. Thirteen features of 5 genes observed in the survey were present in only one species or absent from multiple species. Such observations can be explained by the gain of a novel expression feature in one species, the loss of an ancestral feature in multiple species, or a heterochronic shift in the timing of expression. Further experiments were required to distinguish between these three possibilities.
Table 1.
Survey of gene expression in developing larval tissues of Drosophila species reveals many cases of shifting patterns, heterochrony, or loss but relatively few gains
| Gene | Function | Discs expressing* | No. of species analyzed† | Heterochrony/loss | Shifting pattern | Apparent gain |
| CG17278 | Enzyme (serpin) | w, a, e | 7 | X | ||
| CG5758 | Cell adhesion (fasciclin) | w, l, a, e | 2 | |||
| Doc2 | TF | w, l, a, e | 4 | |||
| CG10275 | Cell adhesion (laminin G domain) | w, l, a, e | 4 | |||
| Chn | TF | w, l, a, e, b | 4 | |||
| Obp56d | Ligand binding | w, a, e | 8 | X | X | |
| CG8483 | Miscellaneous (venom allergen) | w, l, a, e | 4 | |||
| CG14534 | Miscellaneous (DUF243) | w, l, a, e | 7 | X | ||
| Tsp | Cell adhesion (thrombospondin-like) | w, l, a, e | 4 | |||
| CG14301 | Structural protein (chitin binding) | w, l, a, e | 4 | X‡ | ||
| tup | TF | w, l, a, e | 4 | |||
| Pdm2 | TF | w | 4 | |||
| Gld | Enzyme | w, l | 7 | X | X | |
| Obp99a | Ligand binding | w, l, a, e, b | 10 | X | X | |
| ana | Miscellaneous (secreted glycoprotein) | w, l, a, e | 6 | X | X | |
| CG8780 | Unknown | w | 4 | |||
| CG9008 | Unknown | w, a, e | 4 | X | ||
| Nep1 | Metalloproteinase | w, l, a, e, b | 13 | X | X | X |
| cyp310a1 | Enzyme | NA | 4 | |||
| Obp56a | Ligand binding | NA | 4 |
*Imaginal disc tissues in which gene expression was observed: wing (w), leg (l), antennae (a), eye (e), and brain/optic lobes (b). Two probes gave no detectible signal in larval imaginal discs. (NA, not available).
†For all genes, the four species analyzed were D. melanogaster, D. simulans, D. sechellia, and D. mauritiana. Gene expression analyzed in additional species included members of the D. yakuba clade (D. yakuba, D. santomea, D. teissieri, and D. erecta).
‡The pattern of CG14301 expression differed in extent among species, but this may be an artifact of weak signal or low gene expression.
The Obp99a gene provides an example of the challenge in confirming expression feature gains. Obp99a was expressed in an elaborate pattern in the third instar antennal disc of D. melanogaster but was not initially observed in discs of similar age in its three closest sister species (SI Appendix, Fig. S1). In situ hybridization at three developmental time points and in four additional outgroup species revealed that the partial or complete pattern was present at different developmental time points in three other species (SI Appendix, Fig. S2). A less extensive but comparable pattern of expression was detected in the early third instar discs of Drosophila mauritiana, and a virtually identical pattern was present in the white prepupae stage of Drosophila sechellia. In the Drosophila yakuba clade, a similar pattern of antennal expression was observed in D. santomea (SI Appendix, Fig. S2), indicating that Obp99a has also been subject to expression feature losses in multiple lineages.
The above case underscores the importance of both dense phylogenetic coverage and temporal resolution in identifying unique expression patterns. To identify novel pattern features unambiguously, we surveyed a sufficient number of species to rule out the possibility that such patterns did not represent widespread loss of an ancestral feature. A range of developmental time points was also surveyed to assess heterochronic shifts in expression. For the purposes of our study, we considered expression features to be evolutionary gains only after ruling out the possibility of loss and heterochrony by surveying expression in at least eight species at four developmental time points between the early third instar larva and white prepupal stages.
Nep1 Gene Has Been Subject to Frequent Spatiotemporal Expression Changes in Multiple Tissues.
One of the genes analyzed in our screen, Nep1, which encodes an extracellular metalloproteinase, displayed highly divergent expression among species (SI Appendix, Fig. S3). We identified several instances in which features of Nep1 expression have either been lost in multiple species and/or have shifted their spatial expression domain over time. Examination of Nep1 expression across 13 species revealed that such transitions occurred in all five tissues analyzed. In some cases (e.g., wing and optic lobe expression in Drosophila suzukii and Drosophila kikkawai), there appears to have been a loss of an otherwise highly conserved expression feature (SI Appendix, Fig. S3; red arrows). In other cases (e.g., comparing leg expression among all species), it was less clear whether pattern differences were best explained by multiple losses, shifts in the domain of expression, or some combination of both. One example of an expanded spatial expression domain was evident in the eye disc of D. santomea. Many of the species examined displayed a pattern of expression within or posterior to the morphogenetic furrow (SI Appendix, Fig. S3). However, D. santomea was the only species in which there was a high level of Nep1 expression anterior to the furrow, in the region fated to develop into the forehead, or “frons” (SI Appendix, Figs. S3 and S4).
At least two Nep1 expression features were strong candidates for being recently evolved novelties. The first feature, common to Drosophila teissieri, D. yakuba, and D. santomea, consists of sensory organ precursor (SOP) cells expressing Nep1 in the third segment of the antennal disc (SI Appendix, Fig. S3). The second feature was unique to D. santomea, consisting of strong expression of Nep1 by laminar neuroblasts of the optic lobes that will become interneurons of the visual system (Fig. 1). The phylogenetic distribution of these patterns suggests that they evolved within the past 6–10 million years and ∼500,000 y, respectively. To rule out the possibility that these patterns were ancestral rather than derived, we examined Nep1 expression at four distinct developmental time points: early, mid (wandering), and late third instar larva as well as white prepupae of the eight species of the D. melanogaster species group. The SOP antennal pattern was not observed at any time points for species other than D. teissieri, D. yakuba, and D. santomea, where it first appears in late third instar larvae (SI Appendix, Fig. S4). The laminar neuroblast expression observed in D. santomea was not observed in any of the seven other species at any of the four time points. In D. santomea, the expression was first seen in wandering third instar larva and persisted into the white prepupae stage of development (SI Appendix, Fig. S5). Thus, these two patterns meet our criteria for being evolutionary gains of gene expression.
Novel Patterns of Nep1 Expression Evolved Through the Modification of the Nep1 Regulatory Region.
The novel expression of Nep1 in the optic lobes and antennal SOPs may have evolved through changes in one or more trans-acting regulators of Nep1, changes in regulatory sequences of Nep1, or a combination of both mechanisms. To distinguish between these possibilities, we sought to identify the enhancers controlling transcription of the D. santomea Nep1 gene and to determine whether they had been modified.
We fused noncoding sequences around the D. santomea Nep1 gene to a GFP reporter and assayed for enhancer activity when inserted into the genome of D. melanogaster (SI Appendix, Figs. S6 and S7). This survey revealed that all the larval gene expression features of Nep1 are governed by sequences within the first intron of the gene (Fig. 2 A and F–I), including the recently evolved patterns in antennal SOPs and the lamina neuroblasts of the optic lobe (Fig. 2 A and I and SI Appendix, Figs. S7 and S8). Intron sequences from additional species that did not display the unique optic lobe and antennal expression features lacked the corresponding enhancer activities when fused to a reporter gene. For example, the Nep1 intron from D. yakuba, D. teissieri, and Drosophila erecta all drove expression in the larval CNS but lacked optic lobe activity in the lamina neuroblasts, consistent with endogenous Nep1 expression within these species (compare Fig. 2 J–L with 2M). Because the reporter constructs were assayed in the genetic regulatory background of D. melanogaster, whose Nep1 gene does not display either gene expression feature, we conclude that these two features of gene expression arose through changes in the regulatory regions of Nep1 itself.
Fig. 2.

Mapping of Nep1 enhancers reveals that the novel optic lobe expression pattern evolved through changes in cis to Nep-1. (A) Schematic of the Nep1 locus showing the location of enhancers that were mapped in the first intron of D. santomea and reporter constructs used in the study. Nep-1 mRNA expression within third instar larval imaginal tissues of D. santomea was revealed by in situ hybridization to a wing disc (B), leg disc (C), eye-antennal disc (D), and larval brain (E). Expression of a D. santomea Nep1 intron-GFP reporter fusion construct in larval imaginal tissues recapitulates patterns of endogenous Nep1 expression in the wing hinge (F) and leg coxa (G) as well as a complex ensemble of patterns in the eye-antennal disc (maxillary palp, retinal field, ocelli, and frons) (H). Expression patterns in the larval brain, including cells of the ventral ganglion, mushroom bodies, and the D. santomea-specific expression in laminar neuroblasts of the optic lobes (E), are governed by the D. santomea Nep1 intron (I). Dashed box in I delimits the optic lobe region presented in J–M. (J–M) Reporter expression in the optic lobe driven by Nep1 intron constructs derived from multiple species. Optic lobes of D. melanogaster transgenic for Nep1 intron reporter constructs derived from D. erecta (J), D. teissieri (K), and D. yakuba (L) lack the activity in laminar neuroblasts that is driven by the D. santomea intron (compare white bracket in M with J, K, and L).
Because of its relatively recent origin, we sought to trace the evolutionary history of the novel optic lobe expression in D. santomea and to distinguish among the possible mechanisms that gave rise to the underlying enhancer activities. We expected that it would be useful to delimit enhancer functions to the smallest DNA region possible. Therefore, we constructed and tested smaller segments of the first intron of Nep1 in reporter constructs to determine the boundaries of the enhancers contained within it. Many of the highly conserved aspects of Nep1 expression (e.g., wing disc, retinal field, CNS) were governed by a small region that included the entire 5′ noncoding exon of Nep1 (Fig. 2A). The novel pattern of Nep1 expression in the optic lobe was localized to a 687-bp region directly downstream of the 5′ noncoding exon of the Nep1 RA promoter (Fig. 2A and SI Appendix, Figs. S6 and S7). This appears to be the minimal region of the optic lobe enhancer, because we could not subdivide this region further without destroying its activity. Having defined the minimal optic lobe enhancer and demonstrated that the novel feature is attributable to activating changes within the Nep1 intron, we next set out to elucidate how the optic lobe enhancer evolved.
Novel Optic Lobe Activity Evolved Through the Co-Option of Preexisting Enhancer Activities.
To investigate the possible mechanisms underlying the origin of the optic lobe enhancer activity, we examined the structure of the Nep1 optic lobe enhancer in detail. If this activity arose through the transposition of a functional element into the locus, one would expect to find large insertions in the enhancer region that are specific to D. santomea. Comparison of the D. santomea enhancer region with its sister species D. yakuba and outgroup species D. teissieri and D. erecta showed no evidence of recent insertions. In fact, the orthologous regions of DNA in these species are highly colinear and lack large indels (SI Appendix, Fig. S9). Another mechanism that could have generated the activity was a change in enhancer-promoter interactions (promoter-switching). However, we find that the optic lobe enhancer is closely associated with the Nep1 locus; furthermore, neither of the adjacent genes were expressed in the optic lobes in D. santomea or D. yakuba (data not shown), making this mechanism an unlikely explanation. The remaining alternative mechanisms would then be the de novo evolution of this enhancer or the co-option of preexisting enhancers to drive the new function. To differentiate between co-option and the de novo evolution of an enhancer, we had to determine whether the novel activity depended on sequences that were a functional constituent of an existing enhancer. The simplest test was to determine whether the novel enhancer overlapped with other enhancers that govern preexisting expression features: If the novel activity shows no overlap with preexisting enhancers, it is more likely that it evolved de novo. However, if sequences of an ancestral enhancer were recently co-opted to govern an additional expression feature, it is likely that the two activities (ancestral and newly derived) would remain in close proximity, and might therefore share sequences required for their activity.
In our dissection of the Nep1 regulatory region, we found that the minimal optic lobe enhancer significantly overlapped the majority of enhancer activities contained in the intron, sharing 492 bp with the region that drove expression in the retinal field, larval CNS, leg, and wing hinge. This observation raised the possibility that the optic lobe enhancer evolved via the co-option of preexisting enhancer sequences. To assess the independence of the optic lobe activity with respect to other activities in the region, we examined the activity of a D. santomea intron reporter construct in which a region containing the optic lobe enhancer was deleted. By deleting a 1,176-bp segment that drove the full optic lobe expression pattern (with trace levels of CNS expression) (SI Appendix, Fig. S6; A.2.3 fragment) from the intron, we also removed the 492-bp region of overlap with many of the other intron enhancer activities. We observed that reporter activities in the CNS and retinal field were strongly reduced (Fig. 3 B and D), whereas activities in the leg, wing hinge, ocelli, and maxillary palp were unaffected (not shown). In the eye disc, fewer cells per ommatidium were observed to express GFP in the deletion construct and the cells anterior to the morphogenetic furrow, which form the forehead (frons), no longer expressed GFP. These results show that this region of overlap is required for the optic lobe, CNS, and retinal field/frons activities and suggest that a preexisting enhancer was co-opted to derive the novel activity in the optic lobe.
Fig. 3.

Optic lobe enhancer contains sequences required for multiple expression patterns. Comparison of the D. santomea full intron reporter construct (A and C) with a construct in which the optic lobe enhancer has been deleted (B and D). Deletion of the optic lobe enhancer causes expression in the larval CNS to be strongly reduced (B, bracket, compared to bracket in A), whereas optic lobe expression is completely extinguished (B, arrow) compared with the complete intron construct (A, arrow). In the eye disc, expression is greatly reduced in the retinal field (bracket in C and D) and frons (arrow in C and D) by the deletion (D) relative to the activity of the complete intron (C).
The observation of overlap between novel and preexisting enhancer activities does not exclude, however, the possibility that the optic lobe activity evolved de novo. TF binding sites are often intermingled with nonfunctional sequences, such that new sites could arise among functional regions to regulate a novel independent activity. Therefore, to differentiate between co-option and de novo mechanisms more confidently, we sought to determine whether ancestral (CNS/retinal field) and derived (optic lobe) activities depend on any common sites.
Because sequence conservation is frequently a good indicator of sequence function, we scanned the 492-bp region of overlap between the optic lobe and other enhancers for regions 10 bp or more in length that were conserved between the D. melanogaster and D. yakuba clades (SI Appendix, Fig. S10A). We identified seven such regions, ranging in length from 10 to 29 bp, and scrambled each region individually within the context of a 2.2-kb segment (SI Appendix, Fig. S6; A.2 fragment) that drove the majority of the Nep1 expression features. Each construct containing a different scrambled block was tested for optic lobe activity as well as for the other overlapping activities. Of the seven blocks that were scrambled, six displayed a reduced optic lobe activity (Fig. 4A and SI Appendix, Fig. S10B). The two most drastic effects were observed for block 7 (0% activity) and block 5 (33% activity). Importantly, scrambling of both blocks also had marked effects on CNS activity (reduced to 56% and 43%, respectively; SI Appendix, Fig. S10B). Scrambling of the other four blocks that displayed reduced optic lobe activity also had measurable differences in retinal field expression, ranging from 48% (block 1) to 82% (block 7) of the WT D. santomea control construct activity. These results demonstrate that the optic lobe enhancer depends on sequences that have been maintained for ∼6–10 million years and strongly suggest that the optic lobe enhancer activity arose from the co-option of existing enhancers with activities in the eye and CNS. We next set out to characterize the mutational path (i.e., number and type of mutations) by which this co-option occurred.
Fig. 4.

Optic lobe enhancer activity depends on a variety of ancestrally conserved and newly derived inputs. (A) Schematic of the D. santomea optic lobe enhancer and the region in which it overlaps with enhancers active in the retinal field and ventral ganglion. Gray boxes depict regions that are conserved between D. santomea and species of the D. melanogaster clade (SI Appendix, Fig. S10). The position of each D. santomea-specific mutation is indicated by a red asterisk. Colored lines indicate that mutation of the indicated block or D. santomea-specific mutation had a measurable effect on the enhancer activity to which the line is connected. (B–F) Comparison of D. santomea optic lobe enhancers in which D. santomea-specific substitutions were reverted. (B) Activity of the WT D. santomea optic lobe enhancer. (E and F) Compared with the WT D. santomea construct (100 ± 4% SEM), each mutant construct displayed significantly (P < 0.005, t test) reduced activity.
Small Number of Nucleotides Differ Between D. yakuba and D. santomea in the Region Containing the Optic Lobe Enhancer.
The presence of a specific optic lobe enhancer activity in D. santomea and its absence in D. yakuba suggest that this co-option event occurred in the past ∼0.5 million years since the divergence of D. yakuba and D. santomea from their common ancestor. We therefore set out to identify the mutations that gave rise to the optic lobe activity. Comparison of the D. santomea and D. yakuba optic lobe enhancer region revealed just 16 differences across 923 bp (SI Appendix, Fig. S11), suggesting that a modest number of mutations underlie the functional differences between the species.
Any nucleotide differences between D. santomea and D. yakuba sequences could be within-population polymorphisms or changes fixed along either lineage. To determine whether a mutation is polymorphic, one must survey multiple individuals of a species. If such a sequence difference is present in all surveyed individuals, this “fixed difference” can then be attributed to a particular lineage by comparing the sequence with that of one or more outgroup species. To disentangle the mutational history of the enhancer, we examined both the optic lobe enhancer and Nep1 expression in isofemale lines of D. santomea and D. yakuba, using D. teissieri lines as an outgroup to pinpoint in which lineage the yakuba/santomea differences arose. Nep1 expression was present in laminar neuroblasts of the optic lobe in all 16 D. santomea lines examined and not present in any of the lines of D. yakuba (16 lines) or D. teissieri (17 lines), confirming that the optic lobe expression pattern was fixed in D. santomea (data not shown). Comparison of the D. yakuba and D. santomea isofemale line enhancer sequences with the D. teissieri isofemale lines revealed just 4 fixed mutations in D. santomea that differentiate this species from its common ancestor with D. yakuba (Fig. 4A and SI Appendix, Figs. S11 and S12). We also found a region of repeat expansion that is polymorphic in D. santomea (SI Appendix, Fig. S12). Along the D. yakuba lineage, a total of 11 mutations have been fixed since its common ancestor with D. santomea. The four D. santomea-specific differences were located within the minimal optic lobe enhancer (SI Appendix, Fig. S11), raising the intriguing possibility that the co-option of a preexisting enhancer could occur through just 4 (or fewer) mutations.
To test the inference that these four D. santomea-specific mutations contributed to the evolution of optic lobe expression, we mutated each nucleotide individually to the D. yakuba state in the context of the D. santomea optic lobe enhancer. Notably, each of the four individual D. santomea-specific fixed mutations contributes to the optic lobe activity of D. santomea, with expression ranging from 59–82% of WT levels (Fig. 4 B–F). Taken together with the block mutation results, we suggest that many TF binding sites of varying ages contribute to the total level of optic lobe expression observed in D. santomea (Fig. 4A).
Ancestral gene resurrection is a powerful approach for performing empirical functional tests on extinct ancestral sequences (36). By reverting the 4 D. santomea-specific mutations and restoring the polymorphic repeat expansion to its monomorphic ancestral state, we were able to resurrect the ancestral optic lobe enhancer sequence and then to test its activity in vivo. Compared with the D. santomea optic lobe enhancer (100% activity, 1,176 bp; Fig. 5B) and the orthologous D. yakuba enhancer (0% activity, 1,165 bp; Fig. 5C), the yakuba/santomea ancestral enhancer (1,151 bp) exhibited ∼40% of the D. santomea optic lobe activity (Fig. 5D). Several important interpretations follow from this result. First, in the last common ancestor of D. yakuba and D. santomea, Nep1 was potentially expressed at low levels (relative to current day D. santomea) in the lamina neuroblasts of the optic lobe. Second, in the D. santomea lineage, the 4 identified D. santomea-specific mutations increased the ancestor's weak enhancer activity 2.5-fold to present-day levels. Third, in the D. yakuba lineage, some of the 11 identified mutations abolished the low level of enhancer activity in the yakuba/santomea ancestor, an inference that is corroborated by further studies of the yakuba regulatory region (SI Appendix, Fig. S13). Finally, these results suggest that mutations preceding the ancestor of D. yakuba and D. santomea lineages were responsible for co-opting the CNS/retinal field enhancer to generate low levels of optic lobe expression.
Fig. 5.

Nep1 optic lobe activity predates the yakuba/santomea speciation event. (A) Tree showing the phylogenetic relationship of D. yakuba clade species. Numbers indicate differences fixed on the D. yakuba and D. santomea lineages since their divergence from the common yakuba/santomea ancestor (asterisk). (B) Activity of the D. santomea optic lobe enhancer. (C) D. yakuba region orthologous to the optic lobe enhancer shows no detectable expression of GFP. (D) In the resurrected ancestral enhancer of D. yakuba and D. santomea that lacks changes fixed along either lineage, GFP expression in the optic lobe is detected at a reduced level. The percentage of activity (±SEM) relative to the D. santomea optic lobe enhancer is shown for each construct.
Latent Optic Lobe Activity Predated the Ancestor of the D. yakuba and D. melanogaster Clades.
The finding that the inferred yakuba/santomea ancestral sequence drove weak reporter expression prompted us to look further back in time to the origin of this activity. The D. melanogaster clade is the sister of the D. yakuba clade and contains four species, none of which appear to have expression of Nep1 in the optic lobe lamina neuroblasts. We tested three of these species for optic lobe enhancer activity by fusing the region orthologous to the D. santomea optic lobe enhancer to GFP and assaying for activity in D. melanogaster (SI Appendix, Fig. S14). Whereas the D. melanogaster (SI Appendix, Fig. S14B) and D. sechellia (SI Appendix, Fig. S14C) sequences had no optic lobe activity, the Drosophila simulans construct showed a trace amount of reporter expression in the lamina neuroblasts (SI Appendix, Fig. S14D). This finding contrasts with the Nep1 expression pattern in D. simulans, in which there is no detectable optic lobe expression (Fig. 1).
However, it remained possible that D. simulans expressed Nep1 at levels that were not detectable in the in situ protocol. To examine this possibility, we performed a more sensitive in situ hybridization assay on species of the D. melanogaster subgroup by increasing the concentration of proteinase K used in the in situ hybridization assay 100-fold. Proteinase K enables the riboprobe to penetrate dense tissues. On increasing proteinase K levels, we were able to detect trace expression of Nep1 in lamina neuroblasts of D. simulans (SI Appendix, Fig. S14H). Even using high proteinase K concentrations, no optic lobe expression was observed in D. melanogaster (SI Appendix, Fig. S14F) or D. sechellia (SI Appendix, Fig. S14G). There are two interpretations consistent with these data. First, the optic lobe enhancer activity may have arisen in a common ancestor of the D. yakuba and D. melanogaster clades, being lost from all species other than D. santomea and D. simulans. Second, D. simulans and an ancestor of D. santomea and D. yakuba may have evolved cryptic optic lobe expression independently, which persisted in D. simulans and was augmented in D. santomea. The latter interpretation would imply that sequences conserved between these clades predispose this region to evolving optic lobe activity.
Discussion
The origins of novel expression patterns, and the regulatory sequences that control expression (Fig. 6A), have long remained an open question in molecular evolution. Here, we have shown that the gain of new gene expression features is rare relative to changes in the timing of gene expression, the expansion or contraction of spatial expression domains, or the loss of expression features. We traced the evolutionary history of the gain of Nep1 gene expression in the laminar neuroblasts of the optic lobe and found that the newly evolved Nep1 optic lobe enhancer was embedded within a region containing several enhancers that were active in other tissues. Furthermore, we demonstrated that the optic lobe enhancer included sequences required for the activity of other enhancers, which indicated that the enhancer activity evolved by co-option of preexisting, long-conserved, regulatory sequences. Finally, we revealed that mutations at four sites elevated the latent low optic lobe activity of the ancestral regulatory sequence to the present-day high level in D. santomea. These results highlight the ease with which evolution may “tinker” with regulatory sequences to generate novelty (Fig. 6B) and bear on our general understanding of the nature and frequency of spatiotemporal changes in gene expression and the mechanisms through which such changes arise.
Fig. 6.

Evolutionary origins of novel gene expression patterns. (A) Models for the evolution of enhancer elements (as discussed in the main text). (i) Transposition of a functional enhancer into a new location may confer on that locus a novel expression specificity. (ii) An existing enhancer may derive changes in enhancer-promoter specificity that cause it to activate an alternate promoter. (iii) In a co-option event, an existing enhancer may be modified to generate an additional expression feature. (iv) Nonfunctional DNA may accumulate mutations that generate a functional enhancer. (B) Model for the co-option of an existing enhancer to generate a novel activity. An ancestral enhancer (Left) contains TF binding sites that, in the presence of additional sites (Center), drive a weak activity in a novel location. (Right) This embodies the initial step of a co-option event, after which additional mutations that generate binding sites can create a strong, stable, derived pattern of expression.
Nature and Frequency of Spatiotemporal Changes in Gene Expression.
Evolutionary changes in the spatial or temporal regulation of gene expression have been studied for at least 3 decades (37–39), and scores of empirical examples have been characterized (3, 6). However, we know relatively little about the frequency of such changes over time, particularly of the origin of new gene expression features. This survey, encompassing 20 genes, five tissues, and at least four species, although a small-scale analysis relative to the entire genome, is the largest systematic survey we know of that has sought to assess the frequency of different kinds of gene expression changes.
We sought to increase the likelihood of observing gene expression changes by analyzing genes that appeared to be less constrained, but we also confined these events to those occurring among closely related species. Just 8 of the 20 genes displayed invariant patterns of expression across the four species initially tested. To distinguish apparent gains from other forms of pattern change clearly, it was necessary to examine gene expression at multiple developmental time points or to extend the survey to include outgroup species. Five genes were surveyed in this more extensive manner, and each displayed multiple forms of pattern change, including shifts in the domain or intensity, heterochronic shifts in or loss of pattern features, or gains of novel patterns (SI Appendix, Table S1). In total, we observed shifts in domain or intensity in 8 imaginal disc tissues and heterochronies or losses in 10 imaginal disc tissues among these five genes (SI Appendix, Table S1). In contrast, gains of expression were observed only three times: the two previously mentioned Nep1 patterns and D. melanogaster-specific wing disc expression of Obp56d.
Because multiple instances of domain or intensity shifts and heterochrony or loss of a particular pattern were apparent, the 18 observed cases of shift, heterochrony, and loss are necessarily an underestimate of the rate of expression change. For example, the retinal field expression pattern of Nep1 has undergone multiple independent shifts in its expression domain (SI Appendix, Fig. S3), but this was counted as a single case. Altogether, our data indicate that expression pattern gains are much less likely to be observed than other forms of expression changes.
Evolutionary Path to Novel Expression Patterns via Regulatory Co-Option.
There are four broad mechanisms for the evolution of new enhancer activities (Fig. 6A). The origin of Nep1 gene expression in the laminar neuroblasts of D. santomea provides a striking example of how existing regulatory sequences can be co-opted to generate a novel expression pattern. The evidence suggests that a low level of enhancer activity in the optic lobe existed in the last common ancestor of D. santomea and D. yakuba. This low level of activity was attributable to the regulatory sequences that were used in driving gene expression in other tissues, and it was increased dramatically by four mutations in the D. santomea lineage and extinguished by a small number of mutations in the D. yakuba lineage. These results indicate that new enhancer activities may emerge from existing enhancers in relatively few mutational steps. Although the co-option of extant regulatory elements has been demonstrated previously (31), the Nep1 case here may offer a glimpse into the initial steps of regulatory sequence co-option via the appearance of weak expression in a novel location (Fig. 6B).
The demonstration of the dependence of the novel optic lobe activity on sequences that are also part of other enhancers is consistent with previous findings of multifunctional enhancer sequences that govern more than one feature of gene expression (40, 41). We suggest that the structure and regulatory logic of enhancers, and the nature of the TFs that act on them, make enhancers particularly prone to such “promiscuous” activities and evolve by co-option. Enhancers generate discrete spatial expression patterns by binding combinations of TFs that are themselves deployed in distinct spatial domains (6). Individual TFs are rarely confined to one tissue or cell type and are commonly expressed in many organs and tissues that arise from different germ layers at different times during development (3, 28). By acting on enhancers that contain binding sites for combinations of TFs, TFs that are themselves not tissue-specific may generate highly restricted tissue-specific patterns of target gene expression.
The key implication of this regulatory logic for the evolution of novelty is that mutations generating a binding site for a TF within or near an existing enhancer may cause the expansion of enhancer activity to new tissues or cell types in which that TF is expressed, perhaps in conjunction with other TFs that act on the preexisting enhancer. We note in the case of Nep1 that the regulatory sequences that were co-opted also contributed to activities in the CNS and developing eye field; they may have been predisposed to activity in laminar neuroblasts of the optic lobe. The genetic path of co-opting enhancers and TFs that are active in related tissues would be much shorter than the generation of a cooperative collection of TF binding sites de novo.
Indeed, at face value, the optic lobe enhancer would appear to be a complex macromolecular entity with multiple TF inputs. From our observations, we estimate a minimum of 11 inputs that generate the current level of optic lobe activity: inputs from six conserved blocks, inputs from four D. santomea-specific mutations, and at least 1 input that lies outside of the region of overlap with CNS/retinal field activities (Fig. 4A). Considering mutations and blocks that lie close to one another as single inputs, we estimate a bare minimum of 8 inputs. A large proportion of these putative binding sites have existed in the Nep1 regulatory region for >10 million years as functional constituents other enhancers. Thus, among the many possible routes to regulatory novelty (Fig. 6A), co-option may be favored because of a relatively short mutational path.
Of course, the transposition of a functional enhancer (23, 42) could be an even shorter route to novelty than the co-option of extant TFs and enhancers. However, the diversity of patterns generated by such a mechanism may be limited by the finite repertoire of mobile elements present in any genome relative to the enormous combinatorial potential of all TFs. Future studies will hopefully shed light on the relative contribution of these novelty-generating mechanisms.
Tinkering and the Origins of Novel Gene Functions.
The evolution of organismal complexity and diversity depends on the evolution of novel gene functions, which can arise either by the generation of new protein activities or by the expression of genes in new locations. The path by which Nep1 has evolved novel expression shares certain striking parallels with documented cases of novel protein activities. New protein functions may first appear as promiscuous activities of extant proteins (43). For example, Thornton and colleagues (36) have demonstrated how an ancestral vertebrate deoxycorticosterone receptor bound the hormone aldosterone millions of years before the enzymes to generate aldosterone evolved. In this case, the ability to bind aldosterone was a byproduct of the structure of the binding pocket for deoxycorticosterone. In other words, a novel protein function first arose as a latent promiscuous activity that persisted until a function was realized, similar to the observed path of Nep1.
However, there are key differences between these respective cases, with the foremost being that the origin of novel protein functions was accompanied by gene duplication and divergence. In contrast, the case of Nep1 demonstrates that enhancers need not be duplicated to acquire an additional function. The addition of binding sites that expand enhancer function may be a less constrained process than the modification of protein structures. Nevertheless, it appears that for both proteins and enhancers, evolution rarely produces novelties from scratch but works on the weak promiscuous activities that exist or appear sporadically (44).
Materials and Methods
Fly Stocks.
Species stocks were obtained from the University of California at San Diego Drosophila species stock center (SI Appendix, Table S2). Isofemale lines of D. yakuba, D. santomea, and D. teissieri were kindly provided by Peter Andolfatto (Princeton University, Princeton, NJ) as in the study by Jeong et al. (8).
In Situ Hybridization.
In situ hybridization was performed as previously described (11), following the protocol available on the S.B.C. laboratory Web site. Primers used to amplify probe templates are listed in SI Appendix, Table S3. Sequences of probes from unsequenced genomes are available in GenBank. Hybridizations to D. melanogaster, D. simulans, D. mauritiana, and D. sechellia discs were performed with a D. simulans probe. Hybridizations to D. yakuba, D. santomea, and D. teissieri were performed with a D. yakuba probe. All other hybridizations were performed with species-unique probes.
Reporter Constructs and Transgenic Fly Production.
Primers used to generate GFP reporter constructs are provided in SI Appendix, Table S4. PCR products were cloned into Asc I and Sbf I sites of the vector pS3AG (13). Site-specific integration of transgenes was accomplished by injection of embryos containing a chromosomal source of ϕC31 integrase with a suitable landing site on the second chromosome (51D) (45). Expression of selected constructs was confirmed by insertion into a distinct landing site on the X chromosome (VK00046).
Scrambling of Conserved Blocks.
Blocks of sequence conservation of 10 bp or greater between D. melanogaster, D. simulans, D. erecta, D. yakuba, D. santomea, and D. teissieri were identified using the GenePalette software package (www.genepalette.org). For each block of conservation, overlap-extension primers were designed that changed every other base in the block to its noncomplementary transversion (SI Appendix, Table S5).
Measurement of Relative Fluorescent Intensity.
Relative fluorescent activities of GFP reporters were determined as previously described (11, 13). All constructs were inserted into the same genomic context (51D) to eliminate position effects. Imaginal discs were fixed in PBS + 4% (vol/vol) paraformaldehyde and mounted on slides in glycerol mount [80% (vol/vol in water) glycerol, 0.1 M Tris (pH 8.0)]. Maximum projections were collected on an Olympus Fluoview FV 1000 confocal microscope. Discs were imaged with standardized settings, such that the brightest images were not saturated. The mean fluorescent intensity of a pattern was measured using the ImageJ software package (National Institutes of Health, http://rsbweb.nih.gov/ij/), and background signal from a patch of tissue with no GFP expression was subtracted. Once the mean of several flies was ascertained, it was expressed as percent activity relative to the orthologous WT D. santomea fragment.
Supplementary Material
Acknowledgments
We thank members of the S.B.C. laboratory and Peter Andolfatto for thoughtful discussion and critical input during the course of this project. Thanks to Kathy Vaccaro for technical assistance with the generation of fly transgenics. This work was supported by University of Wisconsin Undergraduate Research Initiative funds (to N.J.), National Institutes of Health Postdoctoral Fellowship F32GM78972 (to M.R.), startup funds from the University of Pittsburgh (to M.R.), and funds from the Howard Hughes Medical Institute (to S.B.C.).
Footnotes
The authors declare no conflict of interest.
Data deposition: The sequences reported in this paper have been deposited in the GenBank database (accession nos. JF838123–JF838169).
This article contains supporting information online at www.pnas.org/lookup/suppl/doi:10.1073/pnas.1105937108/-/DCSupplemental.
References
- 1.Gerhart J. 1998 Warkany lecture: Signaling pathways in development. Teratology. 1999;60:226–239. doi: 10.1002/(SICI)1096-9926(199910)60:4<226::AID-TERA7>3.0.CO;2-W. [DOI] [PubMed] [Google Scholar]
- 2.McGinnis W, Krumlauf R. Homeobox genes and axial patterning. Cell. 1992;68:283–302. doi: 10.1016/0092-8674(92)90471-n. [DOI] [PubMed] [Google Scholar]
- 3.Carroll SB, Grenier JK, Weatherbee SD. From DNA to Diversity: Molecular Genetics and the Evolution of Animal Design. 2nd Ed. Malden, MA: Blackwell; 2005. p. ix. [Google Scholar]
- 4.King MC, Wilson AC. Evolution at two levels in humans and chimpanzees. Science. 1975;188:107–116. doi: 10.1126/science.1090005. [DOI] [PubMed] [Google Scholar]
- 5.Carroll SB. Evolution at two levels: On genes and form. PLoS Biol. 2005;3:e245. doi: 10.1371/journal.pbio.0030245. [DOI] [PMC free article] [PubMed] [Google Scholar]
- 6.Davidson EH. The Regulatory Genome: Gene Regulatory Networks in Development and Evolution. Burlington, MA: Academic Press; 2006. p. xi. [Google Scholar]
- 7.Chan YF, et al. Adaptive evolution of pelvic reduction in sticklebacks by recurrent deletion of a Pitx1 enhancer. Science. 2010;327:302–305. doi: 10.1126/science.1182213. [DOI] [PMC free article] [PubMed] [Google Scholar]
- 8.Jeong S, et al. The evolution of gene regulation underlies a morphological difference between two Drosophila sister species. Cell. 2008;132:783–793. doi: 10.1016/j.cell.2008.01.014. [DOI] [PubMed] [Google Scholar]
- 9.McGregor AP, et al. Morphological evolution through multiple cis-regulatory mutations at a single gene. Nature. 2007;448:587–590. doi: 10.1038/nature05988. [DOI] [PubMed] [Google Scholar]
- 10.Miller CT, et al. cis-Regulatory changes in Kit ligand expression and parallel evolution of pigmentation in sticklebacks and humans. Cell. 2007;131:1179–1189. doi: 10.1016/j.cell.2007.10.055. [DOI] [PMC free article] [PubMed] [Google Scholar]
- 11.Rebeiz M, Pool JE, Kassner VA, Aquadro CF, Carroll SB. Stepwise modification of a modular enhancer underlies adaptation in a Drosophila population. Science. 2009;326:1663–1667. doi: 10.1126/science.1178357. [DOI] [PMC free article] [PubMed] [Google Scholar]
- 12.Tishkoff SA, et al. Convergent adaptation of human lactase persistence in Africa and Europe. Nat Genet. 2007;39:31–40. doi: 10.1038/ng1946. [DOI] [PMC free article] [PubMed] [Google Scholar]
- 13.Williams TM, et al. The regulation and evolution of a genetic switch controlling sexually dimorphic traits in Drosophila. Cell. 2008;134:610–623. doi: 10.1016/j.cell.2008.06.052. [DOI] [PMC free article] [PubMed] [Google Scholar]
- 14.Wittkopp PJ, Vaccaro K, Carroll SB. Evolution of yellow gene regulation and pigmentation in Drosophila. Curr Biol. 2002;12:1547–1556. doi: 10.1016/s0960-9822(02)01113-2. [DOI] [PubMed] [Google Scholar]
- 15.Prud'homme B, et al. Repeated morphological evolution through cis-regulatory changes in a pleiotropic gene. Nature. 2006;440:1050–1053. doi: 10.1038/nature04597. [DOI] [PubMed] [Google Scholar]
- 16.Steiner CC, Weber JN, Hoekstra HE. Adaptive variation in beach mice produced by two interacting pigmentation genes. PLoS Biol. 2007;5:e219. doi: 10.1371/journal.pbio.0050219. [DOI] [PMC free article] [PubMed] [Google Scholar]
- 17.Berman BP, et al. Computational identification of developmental enhancers: Conservation and function of transcription factor binding-site clusters in Drosophila melanogaster and Drosophila pseudoobscura. Genome Biol. 2004;5:R61. doi: 10.1186/gb-2004-5-9-r61. [DOI] [PMC free article] [PubMed] [Google Scholar]
- 18.Stone JR, Wray GA. Rapid evolution of cis-regulatory sequences via local point mutations. Mol Biol Evol. 2001;18:1764–1770. doi: 10.1093/oxfordjournals.molbev.a003964. [DOI] [PubMed] [Google Scholar]
- 19.Britten RJ, Davidson EH. Gene regulation for higher cells: A theory. Science. 1969;165:349–357. doi: 10.1126/science.165.3891.349. [DOI] [PubMed] [Google Scholar]
- 20.Britten RJ, Davidson EH. Repetitive and non-repetitive DNA sequences and a speculation on the origins of evolutionary novelty. Q Rev Biol. 1971;46:111–138. doi: 10.1086/406830. [DOI] [PubMed] [Google Scholar]
- 21.Feschotte C. Transposable elements and the evolution of regulatory networks. Nat Rev Genet. 2008;9:397–405. doi: 10.1038/nrg2337. [DOI] [PMC free article] [PubMed] [Google Scholar]
- 22.Daborn PJ, et al. A single p450 allele associated with insecticide resistance in Drosophila. Science. 2002;297:2253–2256. doi: 10.1126/science.1074170. [DOI] [PubMed] [Google Scholar]
- 23.Chung H, et al. Cis-regulatory elements in the Accord retrotransposon result in tissue-specific expression of the Drosophila melanogaster insecticide resistance gene Cyp6g1. Genetics. 2007;175:1071–1077. doi: 10.1534/genetics.106.066597. [DOI] [PMC free article] [PubMed] [Google Scholar]
- 24.Burgess-Beusse B, et al. The insulation of genes from external enhancers and silencing chromatin. Proc Natl Acad Sci USA. 2002;99(Suppl 4):16433–16437. doi: 10.1073/pnas.162342499. [DOI] [PMC free article] [PubMed] [Google Scholar]
- 25.Akbari OS, et al. A novel promoter-tethering element regulates enhancer-driven gene expression at the bithorax complex in the Drosophila embryo. Development. 2008;135:123–131. doi: 10.1242/dev.010744. [DOI] [PMC free article] [PubMed] [Google Scholar]
- 26.Calhoun VC, Stathopoulos A, Levine M. Promoter-proximal tethering elements regulate enhancer-promoter specificity in the Drosophila Antennapedia complex. Proc Natl Acad Sci USA. 2002;99:9243–9247. doi: 10.1073/pnas.142291299. [DOI] [PMC free article] [PubMed] [Google Scholar]
- 27.Cande JD, Chopra VS, Levine M. Evolving enhancer-promoter interactions within the tinman complex of the flour beetle, Tribolium castaneum. Development. 2009;136:3153–3160. doi: 10.1242/dev.038034. [DOI] [PMC free article] [PubMed] [Google Scholar]
- 28.Wray GA, et al. The evolution of transcriptional regulation in eukaryotes. Mol Biol Evol. 2003;20:1377–1419. doi: 10.1093/molbev/msg140. [DOI] [PubMed] [Google Scholar]
- 29.Piatigorsky J. Gene Sharing and Evolution: The Diversity of Protein Functions. Cambridge, MA: Harvard Univ Press; 2007. p. xv. [Google Scholar]
- 30.Cvekl A, Piatigorsky J. Lens development and crystallin gene expression: Many roles for Pax-6. Bioessays. 1996;18:621–630. doi: 10.1002/bies.950180805. [DOI] [PubMed] [Google Scholar]
- 31.Gompel N, Prud'homme B, Wittkopp PJ, Kassner VA, Carroll SB. Chance caught on the wing: Cis-regulatory evolution and the origin of pigment patterns in Drosophila. Nature. 2005;433:481–487. doi: 10.1038/nature03235. [DOI] [PubMed] [Google Scholar]
- 32.Clark AG, et al. Drosophila 12 Genomes Consortium Evolution of genes and genomes on the Drosophila phylogeny. Nature. 2007;450:203–218. doi: 10.1038/nature06341. [DOI] [PubMed] [Google Scholar]
- 33.Butler MJ, et al. Discovery of genes with highly restricted expression patterns in the Drosophila wing disc using DNA oligonucleotide microarrays. Development. 2003;130:659–670. doi: 10.1242/dev.00293. [DOI] [PubMed] [Google Scholar]
- 34.Klebes A, Biehs B, Cifuentes F, Kornberg TB. Expression profiling of Drosophila imaginal discs. Genome Biol. 2002;3 doi: 10.1186/gb-2002-3-8-research0038. RESEARCH0038. [DOI] [PMC free article] [PubMed] [Google Scholar]
- 35.Jacobsen TL, et al. Functional analysis of genes differentially expressed in the Drosophila wing disc: Role of transcripts enriched in the wing region. Genetics. 2006;174:1973–1982. doi: 10.1534/genetics.106.056788. [DOI] [PMC free article] [PubMed] [Google Scholar]
- 36.Bridgham JT, Carroll SM, Thornton JW. Evolution of hormone-receptor complexity by molecular exploitation. Science. 2006;312:97–101. doi: 10.1126/science.1123348. [DOI] [PubMed] [Google Scholar]
- 37.Dickinson WJ. Evolution of patterns of gene expression in hawaiian picture-winged Drosophila. J Mol Evol. 1980;16:73–94. doi: 10.1007/BF01731579. [DOI] [PubMed] [Google Scholar]
- 38.Dickinson WJ. On the architecture of regulatory systems: evolutionary insights and implications. Bioessays. 1988;8:204–208. doi: 10.1002/bies.950080608. [DOI] [PubMed] [Google Scholar]
- 39.Rifkin SA, Kim J, White KP. Evolution of gene expression in the Drosophila melanogaster subgroup. Nat Genet. 2003;33:138–144. doi: 10.1038/ng1086. [DOI] [PubMed] [Google Scholar]
- 40.Kammandel B, et al. Distinct cis-essential modules direct the time-space pattern of the Pax6 gene activity. Dev Biol. 1999;205:79–97. doi: 10.1006/dbio.1998.9128. [DOI] [PubMed] [Google Scholar]
- 41.Small S, Blair A, Levine M. Regulation of two pair-rule stripes by a single enhancer in the Drosophila embryo. Dev Biol. 1996;175:314–324. doi: 10.1006/dbio.1996.0117. [DOI] [PubMed] [Google Scholar]
- 42.Wang T, et al. Species-specific endogenous retroviruses shape the transcriptional network of the human tumor suppressor protein p53. Proc Natl Acad Sci USA. 2007;104:18613–18618. doi: 10.1073/pnas.0703637104. [DOI] [PMC free article] [PubMed] [Google Scholar]
- 43.Tawfik DS. Messy biology and the origins of evolutionary innovations. Nat Chem Biol. 2010;6:692–696. doi: 10.1038/nchembio.441. [DOI] [PubMed] [Google Scholar]
- 44.Jacob F. Evolution and tinkering. Science. 1977;196:1161–1166. doi: 10.1126/science.860134. [DOI] [PubMed] [Google Scholar]
- 45.Bischof J, Maeda RK, Hediger M, Karch F, Basler K. An optimized transgenesis system for Drosophila using germ-line-specific phiC31 integrases. Proc Natl Acad Sci USA. 2007;104:3312–3317. doi: 10.1073/pnas.0611511104. [DOI] [PMC free article] [PubMed] [Google Scholar]
Associated Data
This section collects any data citations, data availability statements, or supplementary materials included in this article.