Abstract
Purpose
To investigate the correlation between MRE assessed spleen stiffness and direct portal vein pressure gradient (D-HVPG) measurements in a large animal model of portal hypertension.
Materials and Methods
Cholestatic liver disease was established in adult canines by common bile duct ligation. A spin echo based EPI MRE sequence was used to acquire 3-D/3-axis abdominal MRE data at baseline, four weeks, and eight weeks. Liver biopsies, blood samples, and D-HVPG measurements were obtained simultaneously.
Results
Animals developed portal hypertension (D-HVPG: 11.0±5.1 mmHg) with only F1 fibrosis after four weeks. F3 fibrosis was confirmed after eight weeks despite no further rise in portal hypertension (D-HVPG: 11.3±3.2 mmHg). Mean stiffnesses of the spleen increased over two-fold from baseline (1.72±0.33 kPa) to four weeks (3.54±0.31 kPa), and stabilized at eight weeks (3.38±0.06 kPa) in a pattern consistent with changes in portal pressure. A positive correlation was observed between spleen stiffness and D-HVPG (r2 = 0.86, p<0.01).
Conclusion
These findings indicate a temporal relationship between portal hypertension and the development of liver fibrosis in a large animal model of cholestatic liver disease. The observed direct correlation between spleen stiffness and D-HVPG suggest a non-invasive MRE approach to diagnose and screen for portal hypertension.
Keywords: Magnetic Resonance Elastography, Portal Hypertension, Spleen Stiffness, HVPG, Cirrhosis
INTRODUCTION
Incidence of liver fibrosis is increasing worldwide due to non-alcoholic steatohepatitis and hepatitis C (1). As a result, the burden of liver disease is also expanding (2) and includes the clinical sequelae of liver fibrosis such as portal hypertension. The gold standard for assessing liver fibrosis is percutaneous liver biopsy. Percutaneous liver biopsy has risks such as bleeding and other issues such as poor acceptance by patients. The associated morbidity and mortality rates of liver biopsy are estimated at 3% and 0.03% respectively (3). Thus, there is significant demand for new non-invasive methods to assess liver fibrosis and portal hypertension.
MR Elastography (MRE) is a magnetic resonance imaging technique based on quantitatively assessing the mechanical properties of tissues based on the propagation of shear waves. MRE is a novel non-invasive technology for diagnosis and monitoring liver stiffness (4). The estimation of liver stiffness by MRE involves a mechanical technique to generate low frequency (40–120 Hz) shear waves through the abdomen from which liver fibrosis can be estimated. A correlation between liver stiffness and human liver fibrosis has been established (5). Ultrasound elastography has also been proposed as a non-invasive approach for assessing liver fibrosis. However, MRE has a higher technical success rate and a better diagnostic accuracy than ultrasound elastography for staging liver fibrosis (4,6).
Splenomegaly, occurring in the setting of untreated portal hypertension, is a common feature of liver cirrhosis (7). Based on this observation, attempts have been made to correlate portal venous pressure and the hepatic venous pressure gradient (HVPG) with spleen size using ultrasonography and radionuclide imaging (8). Both platelet count and the ratio of aspartate transaminase to platelet count also have been employed to predict hepatic venous pressure gradient. Unfortunately, neither spleen size nor platelet-based indices have shown a good correlation with portal venous pressure. More encouraging was a recent report by Talwalkar et al. suggesting feasibility of MRE in assessing spleen stiffness as a noninvasive measure of portal pressure (9). Portal hypertension was assessed indirectly in this study by the presence of esophageal varices on endoscopy or splenic enlargement on ultrasound.
Therefore, a correlation between splenic stiffness and portal hypertension was proposed but could not be confirmed since the Talwalkar study lacked a direct measure of portal pressure or HVPG. Therefore, the current study was designed to confirm the relationship between splenic stiffness and portal hypertension using a direct pressure measurement in a large animal model of cholestatic liver disease. Furthermore, we hypothesized that portal hypertension would precede the onset of advanced liver fibrosis. Our findings suggested that portal hypertension preceded liver fibrosis and portal pressure correlated well with spleen stiffness. And lastly, our findings suggest that MRE may serve as a non-invasive measure of portal hypertension.
METHODS
Animal preparation
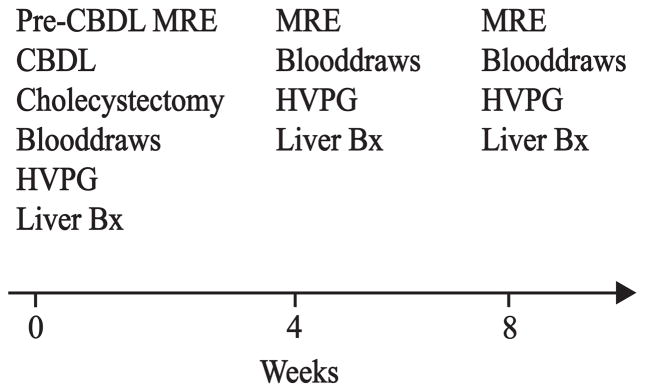
All animals received care according to the criteria outlined in the Guide for the Care and Use of Laboratory Animals prepared by the National Academy of Sciences and published by the National Institutes of Health (publication 86-23, revised 1985). 20 kg adult mongrel canines were observed for at least 7 days before the study start, and fasted overnight with free access to water before general anesthesia. See study outline in Figure 1. An 18G IV cannula (Surflo, Terumo) was introduced in the basilic vein of the front leg. Ketamine (10 mg/kg) and diazepam (0.5 mg/kg) were given intravenously as induction. The animals were then intubated, and thereafter connected to a Servo Ventilator 900C (Siemens). Continuous anesthesia was maintained with Isoflurane. Anesthesia depth was assessed by corneal reflex and heart rate. All animals received 1000 mL 0.9% NaCl IV. Tidal volume was adjusted by means of repeated arterial blood gas analyses to achieve a pCO2 within the range 4.0–4.5 kPa during surgery. The bladder was drained via a transurethral catheter and time diuresis was measured. Arterial and venous blood samples were drawn from two 22G catheters (Arrow, Reading, GA) in the femoral artery and vein. Core body temperature was maintained at 37 °C with a heating pad and blankets. Animals received IV cefazolin (1 g) perioperatively.
Figure 1. Study Outline.
Magnetic resonance elastography (MRE) was obtained at baseline before common bile duct ligation (CBDL). Other baseline measurements included a wedge biopsy of the liver, liver function blood tests, and pressure measurements from the portal vein and hepatic vein. Pressure measurements, along with MRE measurements, blood draws, and transjugular liver biopsies were repeated at four and eight weeks.
Induction of cholestatic liver disease was performed as previously described (10,11). Laparotomy was performed via an upper midline incision. The liver was retracted cephalad to provide exposure of the gallbladder. Cholecystectomy was performed. The common bile duct was identified and exposed. The duct was double ligated with non-absorbable suture and divided. The cystic duct was then double ligated with non-absorbable suture. Two catheters were placed into the hepatic vein and the portal vein, tunneled, and thereafter connected to vascular access ports (VAP) positioned subcutaneously paravertebrally with skin closure over the ports (M.R.I. Hard Base Implanted Port 9.6 Fr single-lumen catheter, Bard Access Systems, Salt Lake City, UT). Seldinger technique was used for the introduction of the catheters. The point of entry into the portal vein was 2 cm distal to the splenic vein; 4 cm of the catheter was advanced proximally into the vessel. The left hepatic vein was cannulated at a superficial site between the left lateral lobe and the median lobe; 3 cm of the catheter was advanced into the left hepatic vein. Both catheters were secured to their respective veins by a purse-string of 5-0 Prolene. Catheter positions were verified with fluoroscopy (Figure 2).
Figure 2. Fluoroscopic Confirmation of Portal Vein and Hepatic Vein Catheters.
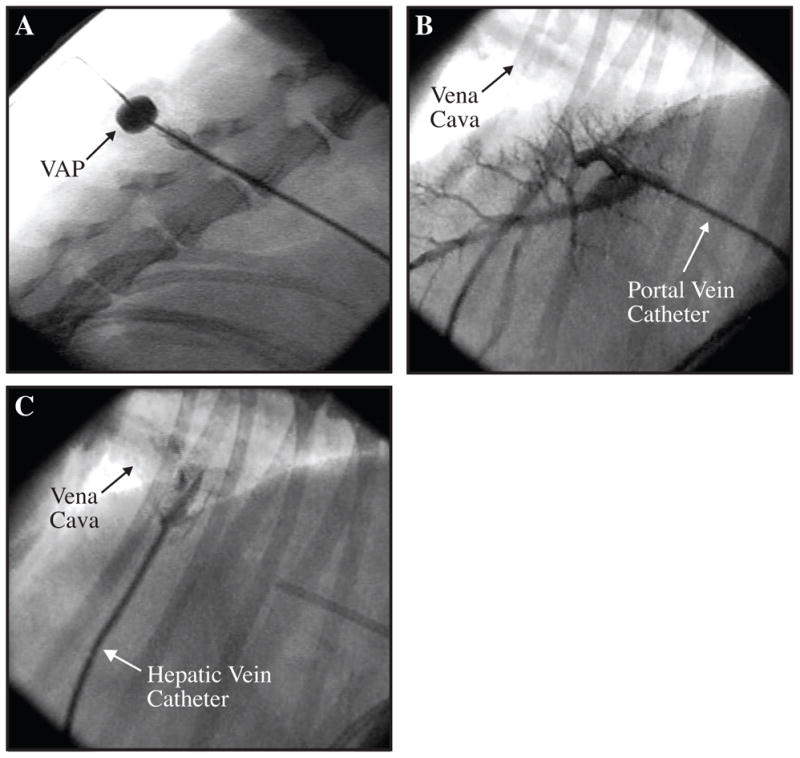
Figure A shows a subcutaneos vascular access port (VAP) positioned paravertebrally. Contrast was injected with a non-coring needle through the skin and into the lumen of the port. Figure B shows a portogram during injection of contrast into the portal vein catheter. Figure C shows the hepatic vein catheter and passage of contrast into the suprahepatic vena cava. The portal vein catheter can be observed on the right side of the image.
A low-profile gastrostomy feeding tube (14 Fr and 1.5 cm length; MIC-KEY, Kimberly Clark, Roswell, GA) was brought out through the abdominal wall and secured to the skin with a nylon suture. Additional silk sutures were used to pexy the stomach to the abdominal wall and to prevent leakage around the g-tube. The abdominal wall was closed in three layers.
Postoperative analgesia was provided for 3 days. Suppressive antibiotics (enrofloxacin 5 mg/kg IV or PO) were administered daily to prevent spontaneous bacterial peritonitis. Pantoprazole IV (1 mg/kg) or omeprazole PO (1 mg/kg) was given daily to prevent ulcer formation. The vascular access ports were flushed 3 times per week with 1000 U/mL Heparin and clindamycin (1.5 mg/dL).
The animals were weighed daily. A 500 mL bolus of 5% dextrose in normal saline was given via the hepatic venous port to prevent dehydration during the first ten days after surgery. The animals were fed cooked ground beef (83/17) in addition to canned food and dry food. The feeding tube was used to administer a supplemental enteric diet (Ensure, Abbott Park, Il) when the weight loss exceeded 5%. Paracentesis was performed up to twice weekly when significant ascites developed and the animals became symptomatic as evidenced by discomfort, or increased respiratory effort. Animals loosing in excess of 20% body weight were euthanized and removed from further study.
Transjugular liver biopsies, hepatic and portal vein pressure measurements
Pressure measurements were obtained through a 19G Non-coring needle (Huber Plus, Bard Access Systems, Inc, Salt Lake City, UT) connected to pressure tubing and a pressure transducer (Edwards Lifesciences, Irvine, CA). The transducers were connected to an amplifier (Press Module, M1006B, Hewlett-Packard). All measurements were performed in triplicate. Portal hypertension was defined as an hepatic venous pressure gradient ≥10 mmHg in accordance to a consensus definition (12). This definition of portal hypertension (hepatic venous pressure gradient ≥10 mmHg) has been used previously in canine studies (11). Under general anesthesia, transjugular liver biopsies were obtained with Seldinger technique via the external jugular vein using a liver access and biopsy set (LABS-200, Cook Medical, Bloomington, IN). Catheter position in the left hepatic vein was verified by fluoroscopy and injection of contrast (Novaplus Omnipaque, GE Healthcare, Princeton, NJ) before performing the biopsies. Liver tissue was fixed in buffered formalin, embedded in paraffin, and stained with H&E or Masson’s trichrome. Liver biopsy specimens were considered suitable for fibrosis staging when they contained at least 10 portal tracts or obvious regenerating nodules. The stage of fibrosis was evaluated semiquantitatively using Masson’s trichrome staining according to the METAVIR scoring system (13); with this score, F0 represents no fibrosis, F1 portal fibrosis without septa; F2 portal fibrosis and few septa, F3 numerous septa without cirrhosis, and F4 cirrhosis.
Magnetic Resonance Elastography
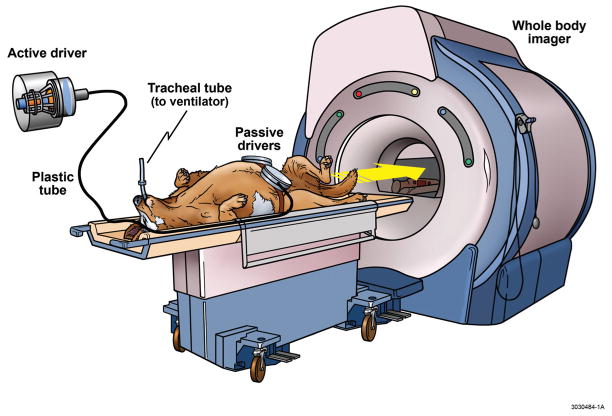
MRE is a magnetic resonance technique for quantitative assessment of the mechanical properties of soft tissues. These mechanical properties are quantified by their propagation of shear waves using MRE. We applied a 3-D/3-axis spin echo based EPI MRE sequence to assess the mechanical properties of the spleen and liver in vivo. Animals were kept under general anesthesia with isoflurane, and connected to a ventilator. The imaging was done in the supine position with two acoustic pressure-activated drivers placed against the body wall adjacent to the liver and the spleen as illustrated in Figure 3. MRE examinations were performed with a 1.5T whole-body GE imager (Signa, GE Medical System, Milwaukee, WI, USA). A single-shot 3-D/3-axis echo planar imaging (EPI) MRE sequence was used to collect 40 axial wave images shown in Figure 4. Other imaging parameters are listed in Figure 4. All the trapezoidal motion-encoding gradients were applied with zeroth and first moment nulling along the through-plane direction. Two spatial presaturation bands were applied on each side of the selected slice to reduce motion artifacts from blood flow. Due to chemical shift artifacts, spatial spectral pulses are used to generate the initial 90° RF pulse. Increased signal and better wave depiction were obtained with the EPI sequence. Susceptibility artifacts associated with EPI based sequences were not a problem in the liver and spleen applications.
Figure 3. Magnetic Resonance Elastography in a Large Animal Model.
The MRE apparatus is illustrated including a mechanical system for application of shear waves through the abdomen. The animals were intubated and kept under general anesthesia. Two small separate drivers were strapped around the abdomen (as opposed to one large driver applied to the abdomen of humans) due to the V-shaped form of the canine torso. During data aquisition, acoustic pressure waves (60 Hz) were generated by an active pneumatic driver located outside of the magnetic field of the whole body imager and conveyed via a flexible tube to the two passive pneumatic drivers strapped around each side of the upper abdomen. MRE, Magnetic Resonance Elastography.
Figure 4. Spin Echo EPI MRE pulse sequence.
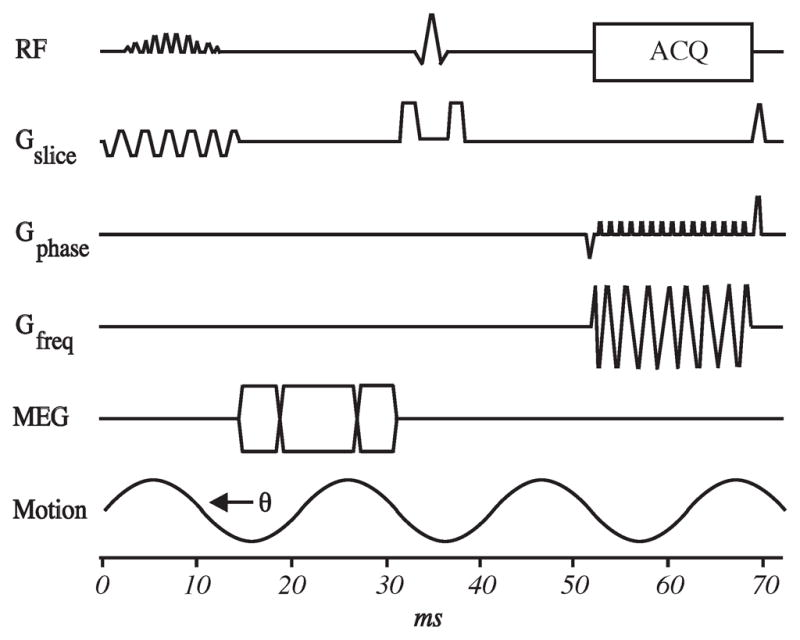
Continuous vibrations were delivered throughout the abdomen at 60 Hz. Imaging parameters were listed as following: TR/TE = 1634/48 ms, 3×3×3 mm3 imaging resolution, parallel imaging acceleration factor of two, one pair of motion encoding gradient with the duration of 12.5 ms and sensitivity of 25.7 μm/π (radians), 4 phase offsets, and 118 seconds acquisition time splitted into eight intervals of suspended respiration. EPI, Echo Planar Imaging; MRE, Magnetic Resonance Elastography; RF, Radio Frequency; TR, Time to Repetition; TE, Time to Echo; RF, Radio Frequency; ACQ, Acquisition; MEQ, Motion Encoding Gradient; G, Gauss.
The acquired wave images were then processed using an inversion algorithm to generate quantitative images called elastograms that depict tissue stiffness. Pre-processing algorithms for the wave data included removal of concomitant gradient field effects, phase unwrapping with minimum discontinuity, removal of longitudinal wave propagation with curl filtering and 20 evenly spaced 3-D directional filtering (14) to enhance the accuracy of the elastograms. Tissue stiffness was estimated by a 3-D local frequency estimation inversion algorithm (15) using the shear wave estimate obtained within each region. The elastograms were analyzed by measuring mean shear stiffness within a large, manually specified region of interest that included an entire cross-sectional image of liver or spleen, while excluding major blood vessels of width greater than 6 pixels (about 8 mm). Regions without adequate magnitude signal or wave amplitude were excluded as well since these low amplitude regions result in erroneous stiffness values.
Statistics
We used the SPSS 11.0 statistical package to establish significance between the groups (Chicago, Il). All results were expressed as mean ± standard deviation (SD). The paired Student t-test was applied for comparisons of normally distributed variables. P-values <0.05 were considered significant. Pearson correlation coefficients were estimated between spleen/liver stiffness and D-HVPG. Repeat measures models with an equal correlation, within-subject structure were used to test for associations between stiffness and D-HVPG. A multivariate repeat measures model was fit to estimate the adjusted effects of each stiffness measurement.
RESULTS
Study Outline
Eight animals were included in this study. Six animals underwent surgical intervention (catheter placement and CBDL) and two control animals underwent catheter placement and sham biliary surgery. Both control animals completed the eight week study, while only two of the intervention animals completed the eight week study by maintaining a weight above 80% of baseline. Two intervention animals were sacrificed at five and six weeks after CBDL due to weight loss. One intervention animal was sacrificed three weeks after CBDL due to a bile duct leak. One intervention animal died of a bleeding complication three days after CBDL. All animals were studied at baseline and served as their own internal control. Baseline measurements obtained before CBDL included magnetic resonance elastography, blood draws, D-HVPG measurements, and wedge liver biopsies (Figure 1). MRE, blood draws, transjugular liver biopsies, and D-HVPG measurements were repeated four and eight weeks after CBDL.
Liver Function
Liver function tests obtained at baseline and at four weeks and eight weeks after CBDL are summarized in Table 1. Animals developed progressive hyperammonemia after CBDL. The levels of ammonia increased more than six-fold (p<0.05). Total bilirubin rose 50-fold during the first 4 weeks (p<0.05), and stabilized thereafter. ALT levels exhibited a similar pattern rising over 35-fold in the first four weeks (p<0.05). The animals developed progressive hypoalbuminemia (p<0.05) suggesting decreased synthetic function and suboptimal nutrition of chronic liver disease despite supplemental feeding. International Normalized Ratio (INR), another measure of hepatic synthetic function, increased mildly from baseline. The Child-Pugh scoring system was used an overall assessment of liver dysfunction (16). As expected, Child-Pugh score rose with all animals reaching stage C at eight weeks.
Table 1.
Laboratory and clinical findings.
| Weeks | 0 | 4 | 8 |
|---|---|---|---|
|
| |||
| Ammonia (μg/dL) | |||
| CBDL | 35.3 ± 16.5 | 133.7 ± 77.4* | 237.7 ± 127.5* |
| Control | 36.2 ± 13.2 | 37.8 ± 16.9 | 37.5 ± 15.4 |
| Total Bilirubin (mg/dL) | |||
| CBDL | 0.2 ± 0.1 | 11.0 ± 4.1* | 10.2± 8.9* |
| Control | 0.3 ± 0.1 | 0.2 ± 0.1 | 0.3 ± 0.2 |
| Albumin (g/dL) | |||
| CBDL | 3.1 ± 0.2 | 2.3 ± 0.5 | 1.6 ± 0.3* |
| Control | 3.0 ± 0.2 | 3.2 ± 0.3 | 3.3 ± 0.3 |
| ALT (U/L) | |||
| CBDL | 46.3 ± 23.2 | 1679.3 ± 470.1* | 891.0 ± 304.0* |
| Control | 48.1 ± 22.9 | 50.1 ± 24.3 | 53.4 ± 22.3 |
| INR | |||
| CBDL | 0.8 ± 0.1 | 1.1 ± 0.1 | 1.1± 0.1 |
| Control | 0.8 ± 0.1 | 0.7 ± 0.0 | 0.8 ± 0.1 |
| Creatinine (mg/dL) | |||
| CBDL | 0.7 ± 0.2 | 0.6 ± 0.1 | 0.7 ± 0.2 |
| Control | 0.8 ± 0.1 | 0.8 ± 0.2 | 0.8 ± 0.1 |
| Child-Pugh Score | |||
| CBDL | 0 | B | C |
| Control | 0 | 0 | 0 |
Significant difference between CBDL group and Control group (p<0.05).
Histological Findings
The liver histology was graded according to the METAVIR classification (13). According to this scoring system, F0 represented no fibrosis, F1 portal fibrosis without septa, F2 portal fibrosis and few septa, F3 bridging fibrosis connecting the portal triads, and F4 cirrhosis. Liver fibrosis was identified by both H&E and Masson’s trichrome staining of liver tissue (Figure 5). After four weeks F1 fibrosis developed around the portal triads in all liver biopsies. Fibrosis progressed to bridging fibrosis (F3) in both livers examined at eight weeks. One animal was biopsied after six weeks with portal fibrosis and a few septae (F2).
Figure 5. Liver Histology.
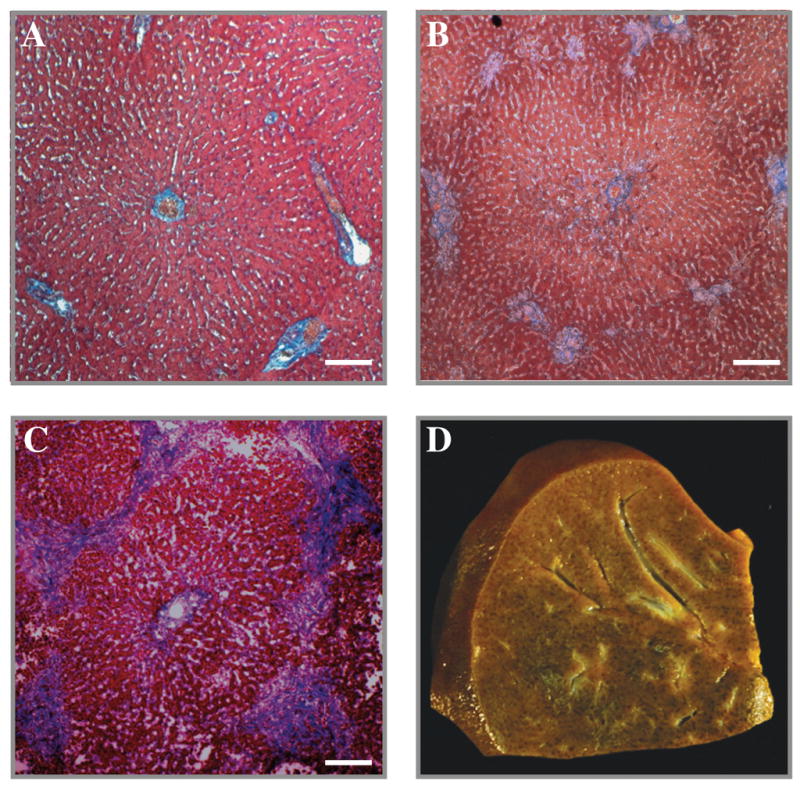
Low power magnification of canine liver stained with Masson’s trichrome at baseline (A), four weeks (B), and eight weeks (C). Note the mild patches of blue staining around the portal triads indicating an F1 fibrosis after four weeks (B), and progression to bridging fibrosis (F3) after eight weeks (C). A nutmeg appearance of the sliced liver characteristic of cholestatic liver disease was observed after eight weeks (D).
Pressure measurements
Portal vein and hepatic vein pressures were measured via vascular access ports positioned subcutaneously with their catheter tips positioned in the respective veins (Figure 2). The baseline pressures for the portal and hepatic veins were 6.6 ±2.2 mmHg and 2.5 ±2.6 mmHg, the four week pressures were 11.0 ±5.1 mmHg and -1.5 ±3.4 mmHg, and the eight week pressures were 11.3 ±3.2 mmHg and -2.0 ±3.6 mmHg, respectively. All venous pressure measurements were obtained under general anesthesia in hydrated dogs. Hydration was standardized by intravenous infusion of saline to a systolic blood pressure greater than 70 mmHg.
Direct Hepatic Venous Pressure Gradient (D-HVPG) was determined by subtracting hepatic vein pressure from portal vein pressure (D-HVPG = PVP – HVP). A striking finding was the significant (p<0.05) three-fold increase in D-HVPG from baseline to four weeks (Figure 6). D-HVPG increased only slightly after four weeks.
Figure 6. Direct Hepatic Venous Pressure Gradient.
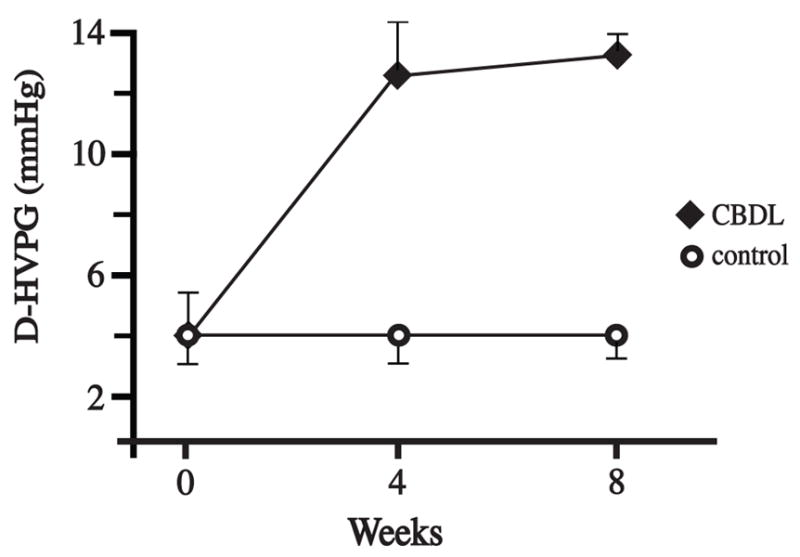
D-HVPG was obtained using subcutaneous vascular ports with their catheter tips positioned in the portal and hepatic veins. The D-HVPG increased significantly from baseline to four weeks (p<0.05). Only a slight increase in D-HVPG was detected from four to eight weeks. There was no increase in D-HVPG in the controls. D-HVPG, Direct Hepatic Venous Pressure Gradient; CBDL, common bile duct ligation.
Magnetic Resonance Elastography
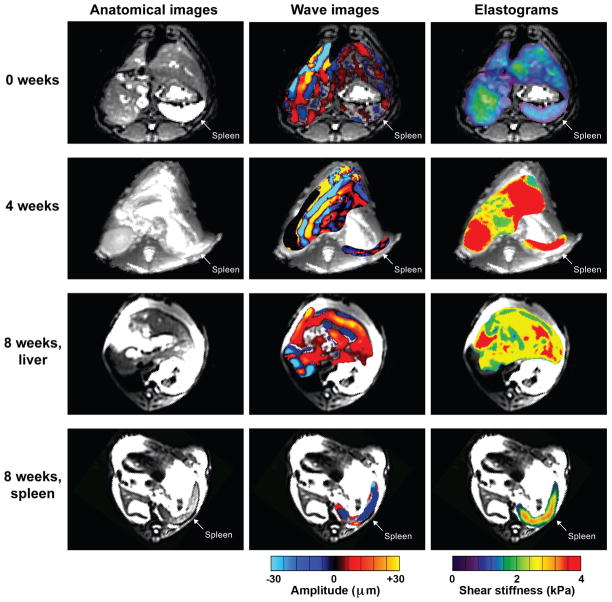
The mean spleen stiffness increased more than two-fold from baseline to four weeks (1.72 ± 0.33 kPa and 3.54 ± 0.31 kPa; p<0.05) (Figure 7). The mean liver stiffness also increased from baseline to four weeks (1.50 ± 0.15 kPa and 3.49 ± 0.75, respectively). Mean stiffnessess of the spleen and the liver did not increase from four weeks to eight weeks (3.38 ± 0.06 kPa and 3.37 ± 0.05, respectively).
Figure 7. Magnetic Resonance Elastography.
Anatomical images (left column) and wave images (middle column) were obtained at baseline, four weeks, and eight week. Maximum intensity projection elastograms (right column) were determined from the wave image data at these time points. After eight weeks, liver and spleen were separated due to displacement of the spleen in the lower abdomen by ascites. Also, note the indentations made by the passive drivers on the anterior surfaces of the abdomen during data collection at week eigth.
Regression Analysis
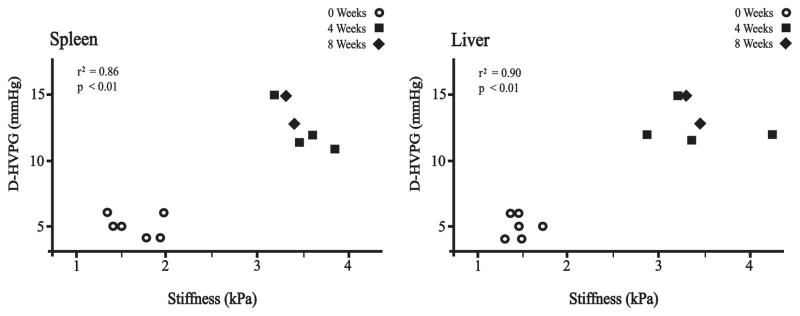
Positive correlations were observed between spleen stiffness measurement and D-HVPG (r2 = 0.86, p < 0.01, y =3.8225×–1.2795) and between liver stiffness measurement and D-HVPG (r2 = 0.90, p < 0.01, y =3.9058×–0.7208) as illustrated in Figure 8.
Figure 8. Regression Analysis.
Regression analysis between stiffness measurements and D-HVPG (direct hepatic venous pressure gradient). Regression values correlating spleen stiffness with D-HVPG and liver stiffness with D-HVPG were r2 = 0.86 (p < 0.01) and r2= 0.90 (p < 0.01), respectively.
DISCUSSION
This study established a 3-D/3-axis MRE imaging method in a large animal model for estimating mechanical properties of abdominal organs. We observed a temporal relationship between the rise in portal pressure and the development of liver fibrosis using a large animal model of portal hypertension. In addition, our results suggest important correlations between spleen stiffness and liver stiffness and D-HVPG (i.e. portal hypertension), suggesting a non-invasive approach to the diagnosis and serial examinations of patients with portal hypertension using MRE. Furthermore, we demonstrated that portal hypertension (determined by direct measure of HVPG) preceded liver fibrosis. These findings may contribute to a better understanding of the pathophysiology of portal hypertension.
Spleen stiffness correlates with portal hypertension
Our study showed that splenic stiffness increased before significant (F3) liver fibrosis was observed. So, which morphological changes are observed in the spleen among patients progressing to chronic liver disease? Observed changes include pulp hyperplasia, congestion due to increased blood flow, and eventually fibrosis (17–19). Our results suggest that splenic stiffness as determined by MRE can reflect these changes and may serve as an indirect and non-invasive measure of portal hypertension. However, a limitation of the results are the lack of a broad range of d-HVPG sampling and MRE imaging in the intervals between sampling.
A relationship between spleen stiffness and portal hypertension was hypothesized, but remained unconfirmed prior to our current report. Direct confirmation of this relationship has been difficult since measurements of portal pressures required invasive catheterization, a procedure considered too risky in humans. Therefore, Talwalker et al. diagnosed portal hypertension indirectly by physical findings such as esophageal varices and splenic enlargement on endoscopy and ultrasound imaging (9). A direct measurement of portal pressure synchronously with spleen stiffness was required to validate this relationship. Accordingly, with verification of this relationship our study suggests a non-invasive approach to the diagnosis and serial examination of patients with portal hypertension using MRE. A potential limitation of this study is the necessity of general anesthesia and mechanical ventilation. The animals were disconnected from the ventilator for 10–20 seconds to simulate breath-hold and to obtain high-quality MRE images.
Taking into account the high prevalence of hepatitis C worldwide, the emergence of non-alcoholic fatty liver disease, and excessive alcohol consumption, the incidence of cirrhosis and portal hypertension is expected to increase significantly in the next decade. Untreated portal hypertension (HVPG >10–12 mmHg) increases the risk of serious complications such as ascites, hepatic encephalopathy, and bleeding complications (7). With proper pharmacological treatment (HVPG <12 mmHg) the risk of fatal complications such as variceal bleeding can be reduced. Therefore, a non-invasive modality could be useful in mass screening and diagnosis of patients with portal hypertension and to monitor their response to therapy.
Portal hypertension
We also observed the development of sustained portal hypertension and a significant hepato-portal venous pressure gradient within four weeks of CBDL, well before the development of a significant fibrotic response in the liver. Moreover, but not until 8 weeks after CBDL was bridging fibrosis (F3) present on histological examination. In our study, portal pressure correlated with stiffness of both the liver and spleen. There are proposed simultaneous architectural and pathophysiological mechanisms in the development of portal hypertension (20). Some studies have suggested that portal hypertension precedes the development of fibrosis (21,22). Pressure is a function of vessel resistance multiplied by vessel flow. Therefore, portal hypertension is not only related to the degree of fibrosis (increased resistance) but also to the flow. Accordingly, both resistance and flow contribute to the state of portal hypertension (23). Cirrhotic liver disease is characterized by a hyperdynamic state, i.e. increased flow, as well as variable flow and variable resistance (24). Cirrhotic liver disease is also associated with progressive vasodilatation in the splanchnic circulation and extrahepatic organs. These changes may be heightened if combined with infection, sepsis and multi-organ failure syndrome.
Liver fibrosis did not correlate with increased liver stiffness suggesting that other factors were involved such as cholestasis and an inflammatory response. A study indicated that extrahepatic cholestasis increased liver stiffness regardless of fibrosis (25). Activation of stellate cells has been proposed as an early event in portal hypertension leading to an increased secretion of a powerful vasoconstrictor; endothelin-1 (26). Increased nitric oxide release in splanchnic arteries has also been proposed as a mechanism of portal hypertension in rats (27). Moreover, conditions of prolonged liver injury, such as chronic cholestasis and repeated toxic exposures, lead to liver fibrosis development and are associated with increased production of major matrix proteins (collagen, fibronectin, proteoglycans, and laminin) (26).
Justification of a large animal model of portal hypertension
The animals developed cirrhotic cholestatic disease by 8 weeks (Figure 5). A large animal model of liver disease had several benefits in our study. These benefits included the use of a full-size clinical MRE system and placement of chronic indwelling catheters for repeated measures of portal pressure. The same animal could also be used for multiple liver biopsies and repeat blood draws. A large animal model also provided a dynamic living system more consistent with human hepato-portal physiology in terms of both portal pressure and splenic and hepatic stiffnesses. A similar study performed in canines showed a portal hypertension of 13.3 mmHg and HVPG of 11.1 mmHg after 8 weeks. Unlike our model with continuous direct access to the portal and hepatic veins, the portal pressure measurements after 8 weeks required a re-laparotomy to gain direct access to the portal vein (11). Clinical MRE systems cannot be validated in rodents. The magnitude and variability of portal pressure profiles of cirrhotic humans are more similar to cirrhotic dogs than cirrhotic rodents. For example, mean portal pressures rarely exceed 10 mmHg in mice during the development of cirrhosis (28). In contrast, all four study dogs had portal pressures ranging from 15–30 mmHg four weeks after CBDL. The magnitude of portal pressures in canine cirrhosis were comparable to human portal hypertension. Large animals also allowed us to maintain patency of chronic indwelling catheters placed in the hepatic and portal veins. Portal pressures and MRE images were obtained serially from the same large animal. In contrast, chronic indwelling portal vein and hepatic vein catheters were not possible in rodents (28,29).
In conclusion, the application-specific 3-D/3-axis abdominal MR Elastography in a large animal model has been established and validated in this investigation. Good correlations were observed between portal pressure, D-HVPG and both spleen stiffness and liver stiffness in our large animal study of cholestatic liver disease and portal hypertension. These findings suggest a temporal relationship between portal hypertension and the development of liver fibrosis. Moreover, these findings suggest a non-invasive approach to the diagnosis and serial examinations of patients with portal hypertension using MRE. Further study of this novel technology is warranted.
Acknowledgments
Grant Support:
Funding for the study was provided by the Norwegian Research Council, the National Institutes of Health (NIH RO1-DK56733 and EB001981), and a Career Development Award from the Mayo Foundation, Rochester, MN. MRI compatible vascular access ports were generously provided by Bard Access Systems, Salt Lake City, UT. Liver Access Biopsy Sets were generously provided from Cook Medical, Bloomington, IN.
References
- 1.Lauer GM, Walker BD. Hepatitis C virus infection. N Engl J Med. 2001;345(1):41–52. doi: 10.1056/NEJM200107053450107. [DOI] [PubMed] [Google Scholar]
- 2.Kim WR, Brown RS, Jr, Terrault NA, El-Serag H. Burden of liver disease in the United States: summary of a workshop. Hepatology. 2002;36(1):227–242. doi: 10.1053/jhep.2002.34734. [DOI] [PubMed] [Google Scholar]
- 3.Piccinino F, Sagnelli E, Pasquale G, Giusti G. Complications following percutaneous liver biopsy. A multicentre retrospective study on 68,276 biopsies. J Hepatol. 1986;2(2):165–173. doi: 10.1016/s0168-8278(86)80075-7. [DOI] [PubMed] [Google Scholar]
- 4.Huwart L, Sempoux C, Vicaut E, et al. Magnetic resonance elastography for the noninvasive staging of liver fibrosis. Gastroenterology. 2008;135(1):32–40. doi: 10.1053/j.gastro.2008.03.076. [DOI] [PubMed] [Google Scholar]
- 5.Talwalkar JA, Yin M, Fidler JL, Sanderson SO, Kamath PS, Ehman RL. Magnetic resonance imaging of hepatic fibrosis: emerging clinical applications. Hepatology. 2008;47(1):332–342. doi: 10.1002/hep.21972. [DOI] [PubMed] [Google Scholar]
- 6.Talwalkar JA. Elastography for detecting hepatic fibrosis: options and considerations. Gastroenterology. 2008;135(1):299–302. doi: 10.1053/j.gastro.2008.05.038. [DOI] [PMC free article] [PubMed] [Google Scholar]
- 7.Turnes J, Garcia-Pagan JC, Abraldes JG, Hernandez-Guerra M, Dell'Era A, Bosch J. Pharmacological reduction of portal pressure and long-term risk of first variceal bleeding in patients with cirrhosis. Am J Gastroenterol. 2006;101(3):506–512. doi: 10.1111/j.1572-0241.2006.00453.x. [DOI] [PubMed] [Google Scholar]
- 8.Shah SH, Hayes PC, Allan PL, Nicoll J, Finlayson ND. Measurement of spleen size and its relation to hypersplenism and portal hemodynamics in portal hypertension due to hepatic cirrhosis. Am J Gastroenterol. 1996;91(12):2580–2583. [PubMed] [Google Scholar]
- 9.Talwalkar JA, Yin M, Venkatesh S, et al. Feasibility of in vivo MR elastographic splenic stiffness measurements in the assessment of portal hypertension. Am J Roentgenol. 2009;193(1):122–127. doi: 10.2214/AJR.07.3504. [DOI] [PMC free article] [PubMed] [Google Scholar]
- 10.Rutgers HC, Stradley RP, Johnson SE. Serum bile acid analysis in dogs with experimentally induced cholestatic jaundice. American Journal of Veterinary Research. 1988;49(3):317–320. [PubMed] [Google Scholar]
- 11.Bosch J, Enriquez R, Groszmann RJ, Storer EH. Chronic bile duct ligation in the dog: hemodynamic characterization of a portal hypertensive model. Hepatology. 1983;3(6):1002–1007. doi: 10.1002/hep.1840030618. [DOI] [PubMed] [Google Scholar]
- 12.de Franchis R. Updating consensus in portal hypertension: report of the Baveno III Consensus Workshop on definitions, methodology and therapeutic strategies in portal hypertension. J Hepatol. 2000;33(5):846–852. doi: 10.1016/s0168-8278(00)80320-7. [DOI] [PubMed] [Google Scholar]
- 13.METAVIR. Intraobserver and interobserver variations in liver biopsy interpretation in patients with chronic hepatitis C. The French METAVIR Cooperative Study Group. Hepatology. 1994;20(1 Pt 1):15–20. [PubMed] [Google Scholar]
- 14.Manduca A, Lake DS, Kruse SA, Ehman RL. Spatio-temporal directional filtering for improved inversion of MR elastography images. Medical Image Analysis. 2003;7(4):465–473. doi: 10.1016/s1361-8415(03)00038-0. [DOI] [PubMed] [Google Scholar]
- 15.Manduca A, Oliphant TE, Dresner MA, et al. Magnetic resonance elastography: non- invasive mapping of tissue elasticity. Medical Image Analysis. 2001;5(4):237–254. doi: 10.1016/s1361-8415(00)00039-6. [DOI] [PubMed] [Google Scholar]
- 16.Pugh RN, Murray-Lyon IM, Dawson JL, Pietroni MC, Williams R. Transection of the oesophagus for bleeding oesophageal varices. The British Journal of Surgery. 1973;60(8):646–649. doi: 10.1002/bjs.1800600817. [DOI] [PubMed] [Google Scholar]
- 17.Manenti A, Botticelli A, Gibertini G, Botticelli L. Experimental congestive splenomegaly: histological observations in the rat. Pathologica. 1993;85(1100):721–724. [PubMed] [Google Scholar]
- 18.Cavalli G, Re G, Casali AM. Red pulp arterial terminals in congestive splenomegaly. A morphometric study. Pathology, Research and Practice. 1984;178(6):590–594. doi: 10.1016/S0344-0338(84)80092-8. [DOI] [PubMed] [Google Scholar]
- 19.Terayama N, Makimoto KP, Kobayashi S, et al. Pathology of the spleen in primary biliary cirrhosis: an autopsy study. Pathology International. 1994;44(10–11):753–758. doi: 10.1111/j.1440-1827.1994.tb02922.x. [DOI] [PubMed] [Google Scholar]
- 20.Bosch J, Garcia-Pagan JC. Complications of cirrhosis. I. Portal hypertension. J Hepatol. 2000;32(1 Suppl):141–156. doi: 10.1016/s0168-8278(00)80422-5. [DOI] [PubMed] [Google Scholar]
- 21.Rockey D. The cellular pathogenesis of portal hypertension: stellate cell contractility, endothelin, and nitric oxide. Hepatology. 1997;25(1):2–5. doi: 10.1053/jhep.1997.v25.ajhep0250002. [DOI] [PubMed] [Google Scholar]
- 22.Rockey DC. Noninvasive assessment of liver fibrosis and portal hypertension with transient elastography. Gastroenterology. 2008;134(1):8–14. doi: 10.1053/j.gastro.2007.11.053. [DOI] [PubMed] [Google Scholar]
- 23.Iwakiri Y, Groszmann RJ. The hyperdynamic circulation of chronic liver diseases: from the patient to the molecule. Hepatology. 2006;43(2 Suppl 1):S121–131. doi: 10.1002/hep.20993. [DOI] [PubMed] [Google Scholar]
- 24.Kowalski HJ, Abelmann WH. The cardiac output at rest in Laennec's cirrhosis. J Clin Invest. 1953;32(10):1025–1033. doi: 10.1172/JCI102813. [DOI] [PMC free article] [PubMed] [Google Scholar]
- 25.Millonig G, Reimann FM, Friedrich S, et al. Extrahepatic cholestasis increases liver stiffness (FibroScan) irrespective of fibrosis. Hepatology. 2008;48(5):1718–1723. doi: 10.1002/hep.22577. [DOI] [PubMed] [Google Scholar]
- 26.Rockey DC. Hepatic fibrosis, stellate cells, and portal hypertension. Clinics in Liver Disease. 2006;10(3):459–479. vii–viii. doi: 10.1016/j.cld.2006.08.017. [DOI] [PubMed] [Google Scholar]
- 27.Hori N, Wiest R, Groszmann RJ. Enhanced release of nitric oxide in response to changes in flow and shear stress in the superior mesenteric arteries of portal hypertensive rats. Hepatology. 1998;28(6):1467–1473. doi: 10.1002/hep.510280604. [DOI] [PubMed] [Google Scholar]
- 28.Geerts AM, Vanheule E, Praet M, Van Vlierberghe H, De Vos M, Colle I. Comparison of three research models of portal hypertension in mice: macroscopic, histological and portal pressure evaluation. International Journal of Experimental Pathology. 2008;89(4):251–263. doi: 10.1111/j.1365-2613.2008.00597.x. [DOI] [PMC free article] [PubMed] [Google Scholar]
- 29.Cardenas A, Lowe R, Oh S, et al. Hemodynamic effects of substance P and its receptor antagonist RP67580 in anesthetized rats with carbon tetrachloride-induced cirrhosis. Scand J Gastroenterol. 2008;43(3):328–333. doi: 10.1080/00365520701685691. [DOI] [PubMed] [Google Scholar]


