

Abstract
Non-invasive, high-throughput screening methods are valuable tools in breeding for abiotic stress tolerance in plants. Optical signals such as chlorophyll fluorescence emission can be instrumental in developing new screening techniques. In order to examine the potential of chlorophyll fluorescence to reveal plant tolerance to low temperatures, we used a collection of nine Arabidopsis thaliana accessions and compared their fluorescence features with cold tolerance quantified by the well established electrolyte leakage method on detached leaves. We found that, during progressive cooling, the minimal chlorophyll fluorescence emission rose strongly and that this rise was highly dependent on the cold tolerance of the accessions. Maximum quantum yield of PSII photochemistry and steady state fluorescence normalized to minimal fluorescence were also highly correlated to the cold tolerance measured by the electrolyte leakage method. In order to further increase the capacity of the fluorescence detection to reveal the low temperature tolerance, we applied combinatorial imaging that employs plant classification based on multiple fluorescence features. We found that this method, by including the resolving power of several fluorescence features, can be well employed to detect cold tolerance already at mild sub-zero temperatures. Therefore, there is no need to freeze the screened plants to the largely damaging temperatures of around −15°C. This, together with the method's easy applicability, represents a major advantage of the fluorescence technique over the conventional electrolyte leakage method.
Key words: chlorophyll fluorescence, cold acclimation, electrolyte leakage, high-throughput screening, natural accessions
Introduction
Susceptibility to low temperature limits the geographical distribution of plants in temperate and polar zones and can also adversely influence crop yields. Counteracting the limitation, many plant species are able to increase their low temperature tolerance by an acclimation to suboptimal temperatures.1 The cold acclimation includes complex cellular and biochemical changes such as altered membrane composition, accumulation of soluble sugars, proline, as well as the production of antifreeze proteins.2–5 In winter cereals6 and in Arabidopsis thaliana,7–8 the cold acclimation was shown to result in an increased photosynthetic activity. The capacity to acclimate to low temperature largely deviates in accessions of Arabidopsis thaliana originating from warm and cool climate habitats. The contrast in acclimation capacity in A. thaliana accessions has already been extensively exploited in efforts to identify the molecular basis of this trait.9–11 The resulting enhanced capacity of acclimated plants to survive subzero temperatures may be due to freezing tolerance and/or avoidance mechanisms. While freezing tolerant plants do not prevent formation of ice crystals in the extracellular space but, rather, limit the damage to cellular structures by the ice crystals, it has been reported that Arabidopsis survives low temperatures by freezing avoidance, i.e. by preventing ice crystal formation via supercooling of cellular and extracellular fluids.12–13
The research of cold tolerance/susceptibility largely relies on methods that can precisely measure the temperature at which irreversible damage occurs to the plants. The classical methods such as measurements of the survival rates and plants re-growth are lengthy and not very accurate in accessing the trait.14 Other methods focus on injury to the plasma membranes that leads to a leakage of electrolytes from plant tissues.15 The electrolyte leakage is easily quantified by conductivity measurements.16 For such experiments, plants are subjected to freeze-thaw cycles with minimum temperatures typically ranging from −1 to −50 °C. The electrolyte leakage caused by cooling is then measured. The parameter LT50EL is determined as a temperature at which 50% of the maximum leakage occurs.17
In an ideal case, the methods to quantify the cold tolerance of plants would be non-invasive and applicable at a high-throughput screening scale so that the underlying genetic determinants can be effectively identified. For that, one can turn to chlorophyll fluorescence emission as a reporter signal that is sensitive to the temperature dependent processes in the photosynthetic thylakoid membranes and, eventually, to the integrity of the chloroplast membranes.18–19 Chlorophyll fluorescence is contributed by pigment-protein complexes PSII and/or PSI of chloroplast thylakoid membranes, and their relative contributions changes with leaf temperature decreasing from 23 °C to chilling temperatures e.g. 4 °C.20
The impact of supercooling or freezing on chlorophyll fluorescence transients of different afroalpine species in vivo has been studied in nature during moderately cold to freezing day-night cycles.12 For Arabidopsis thaliana as well as in many other plant species, the chlorophyll fluorescence parameter Fv/Fm that is widely used as a proxy of the maximum quantum efficiency of PS II photochemistry was found to be highly correlated with low temperature tolerance.21–25 However, Fv/Fm measurements overestimates the cold tolerance in Rhododendron ferrugineum L. by 5 °C.26 Low temperature tolerance of various wheat cultivars was tested using non-imaging fast chlorophyll fluorescence induction kinetics, often called JIP tests.27–28 Chlorophyll fluorescence measurements in the above mentioned studies were mostly accomplished after controlled freeze - thaw cycles. In contrast, the basic fluorescence parameters such as F029–30 and Fm29 were also measured during progressive cooling and heating of detached leaves using non-imaging fluorimeters. To the best of our knowledge, only fluorescence F0 images were recorded during progressive cooling of the plant leaves by imaging fluorescence systems.31 Here, we report on measurements of complex chlorophyll fluorescence transients of nine A. thaliana accessions during progressive cooling. These A. thaliana accessions originate from different geographical regions and show substantial variation in cold tolerance. The accessions have been extensively characterized at the metabolic and molecular level by Hannah et al.10 We applied a complex fluorescence measurement protocol comprising two different actinic light regimes and measurements of photochemical and non-photochemical quenching processes at different temperatures by an imaging fluorescence system.32 Besides analysis of conventional fluorescence parameters, we applied combinatorial imaging33 to identify sets of fluorescence images able to differentiate cold tolerant and sensitive accessions. The results suggest that chlorophyll fluorescence emission can effectively be used as a reporter signal for high-throughput screening of plant's low temperature tolerance at non-lethal temperatures.
Results
Electrolyte leakage measurement.
The parameter LT50 of electrolyte leakage (LT50EL) is commonly used as an objective measure of plant cold tolerance.10 It is calculated as temperature at which 50% of electrolytes leak from the plant tissue following a freeze-thaw cycle. Therefore, we determined the LT50EL of A. thaliana accessions (Fig. 1) as a reference to evaluate the potential of fluorescence analysis. The most tolerant accession Te exhibits the lowest LT50EL value of −12.2 °C followed by Rsch (LT50EL = −10.6 °C), and Col-0 (LT50EL = −10.3 °C). Intermediate cold tolerance was found in Ler (LT50EL = −8.7 °C) and in Nd (LT50EL = −7.8 °C). The sensitive accessions: Co, Can, Cvi, and C24 that originate from warm climate zones have a LT50EL of approximately −6 °C. Calculation of the 95% confidence intervals revealed three significantly deviating groups consisting of the four sensitive accessions, the intermediate accessions Ler and Nd and the tolerant accessions Col-0, Rsch and Te, respectively.
Figure 1.
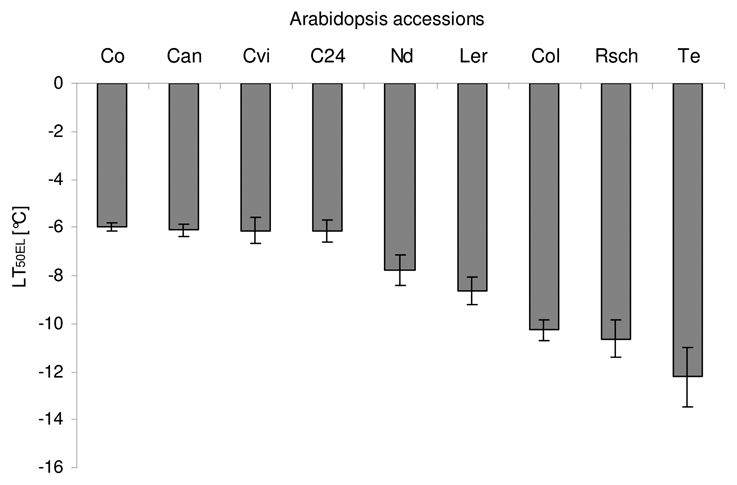
The temperature LT50EL (lethal temperature for 50 % of tissue) of the Arabidopsis thaliana accessions evaluated from electrolyte leakage method. The error bars show standard deviations in six independent measurements.
Chlorophyll fluorescence emission
Chlorophyll fluorescence parameters.
The measurement of chlorophyll fluorescence emission during cooling of the leaves from 4 °C down to −15 °C revealed dramatic modulation of basic fluorescence parameters (Fig. 2). The minimum fluorescence, F0, remained largely insensitive to cooling of the leaves until ca. −6 °C. A further decrease of the leaf temperature led to a significant increase of F0. A sharp non-linear increase of F0 below ca. −6 °C was observed in A. thaliana accessions that were identified as cold sensitive by the electrolyte leakage experiments. These accessions, Co, Can, Cvi, and C24, are represented in Figure 2A by blue lines. The increase of F0 towards lower temperatures was much weaker in the accessions Ler and Nd (green lines in Fig. 2A) that were identified as moderately tolerant. The tolerant accessions Te, Rsch and Col-0 displayed only a small variation of F0 at low temperatures (red lines in the Fig. 2A).
Figure 2.
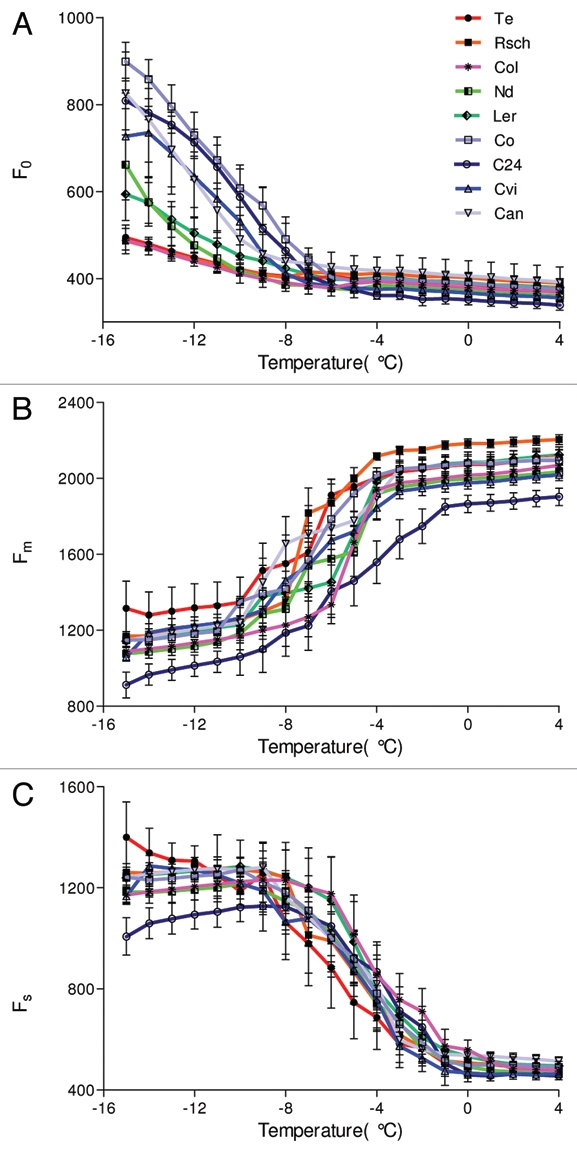
Chlorophyll fluorescence emission yields as a function of leaf temperature from 4 °C down to −15 °C for nine investigated accessions of A. thaliana. (A) minimal fluorescence, F0, (B) maximal fluorescence, Fm, and (C) steady state fluorescence, Fs. The graphs show means and standard deviations obtained in five independent experiments.
Figure 2B shows the temperature dependence of the maximum fluorescence yield, Fm, for all nine A. thaliana accessions. Fm remained approximately constant at temperatures above −4 °C with the exception of C24, where a decrease occurred at temperature below −1 °C (Fig. 2B). Below −4 °C, Fm was decreasing with lowering of the temperature. In contrast to F0, the trends in the Fm temperature dependence in the nine A. thaliana accessions were variable to an extent that prevented a clear distinction of low temperature tolerance classes.
Figure 2C shows that the steady state fluorescence emission Fs attained in actinic irradiance [40 µmol (photons) m−2s−1] was negatively correlated with temperature below 0 °C. The onset of the Fs modulation (Fig. 2C) occurred at a higher temperature as compared to F0 (Fig. 2A). However, the difference between the sensitive and tolerant accessions is not apparent in Fs to the extent observed for F0. Under high actinic light [120 µmol (photons) m−2s−1] the changes of Fs among different accessions were less prominent (data not shown).
The fluorescence parameters shown in Figure 2 are absolute signal levels digitized for each camera pixel and averaged over the leaf surface. Such measurements were independently repeated for five leaves of each accession. The averaged absolute signals represent leaf-to-leaf variability as well as the heterogeneity over the leaf surface. A part of this signal variability can be eliminated by using normalized fluorescence signals. Figure 3A shows the effect of normalization on the signal variability (compare with Fig. 2A) for the ratio of minimal fluorescence measured at the freezing temperatures T to the same parameter measured at 4 °C, F0(T)/F0(4°C). The variability decreased as a result of normalization, but qualitatively no new features emerged.
Figure 3.
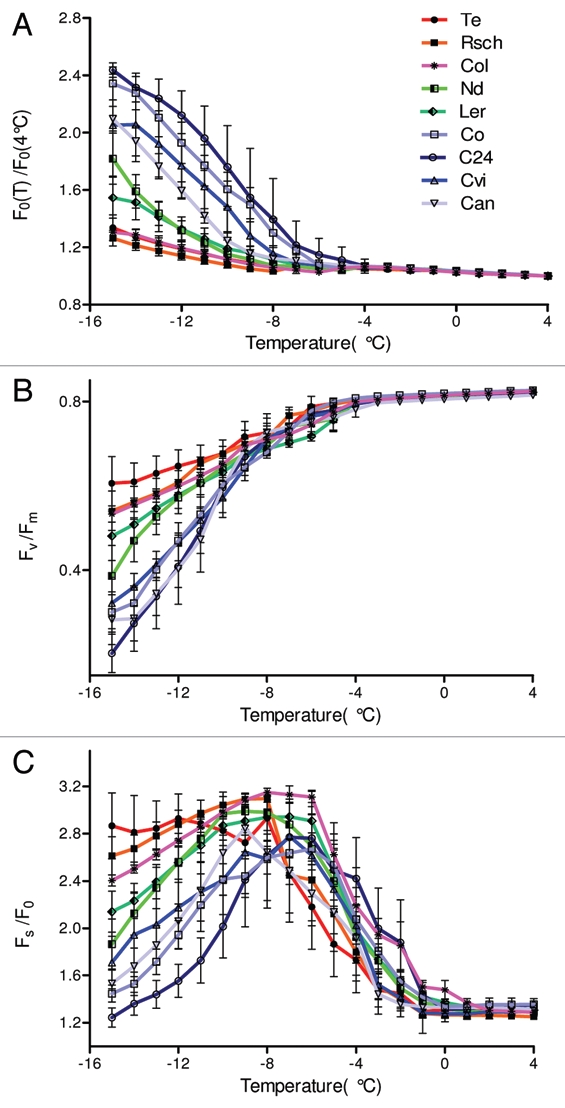
Dependence of chlorophyll fluorescence emission ratios on leaf temperature decreasing from 4°C down to −15 °C for the nine investigated accessions of A. thaliana. (A) Ratio of the minimal fluorescence measured at temperature T°C [F0(T)], to the same parameter at 4°C [F0(4°C)]. (B) Ratio of variable fluorescence Fv(T) = Fm(T) − F0(T) to the maximum fluorescence, Fm(T)) measured at the same temperature. (C) Ratio of steady state fluorescence Fs(T) to the minimum fluorescence, F0(T) measured at the same temperature.
Figure 3B shows the temperature dependence of maximum quantum yield of PSII photochemistry Fv(T)/Fm(T) for all nine A. thaliana accessions. The ratio dropped from over 0.8 in all accessions between 4 and −4 °C to about 0.5–0.6 in the tolerant accessions Te, Rsch, and Col at −15 °C. The drop was slightly more pronounced in the moderately tolerant accessions Nd and Ler, reaching a value around 0.4, while the sensitive accessions exhibited the strongest decline of Fv(T)/Fm(T) down to 0.1 – 0.3 at −15 °C. The variability of the temperature curves for Fv(T)/Fm(T) shown in Figure 3B is lower as compared to the curve showing absolute values of either F0(T) (Fig. 2A) or Fm(T) (Fig. 2B). However, the contrast between sensitive and tolerant accessions measured by Fv(T)/Fm(T) (Fig. 3B) is not apparently higher than the contrast found for F0(T) (Fig. 2A).
Figure 3C shows the ratio Fs(T)/F0(T) between the steady state fluorescence (Fs) and the minimum fluorescence (F0). This ratio integrates temperature responses of the two constituent signals. In the range of 0 to −8 °C, temperature dependence of Fs(T)/F0(T) is dominated by Fs(T), which starts rising when the leaf temperature falls below 0 °C. In this range, temperature dependence of Fs(T)/F0(T) correlates only weekly with cold tolerance of the A. thaliana accessions. At temperature below −8 °C the decline of Fs(T)/F0(T) dominantly reflects the increase of F0(T) and now correlates well with the cold tolerance of the accessions.
The graphs in Figure 4 show the correlation between the parameter LT50EL measured by the electrolyte leakage method (Fig. 1) and the normalized fluorescence parameters measured at −15°C (Fig. 3). The correlation is high (R2 = 0.86) for F0(−15 °C)/F0(4 °C) [Fig. 4A] that is relatively easy to quantify because measurement of F0 does not require a saturating flash. The application of the saturating flash permits measuring Fm and calculation of Fv/Fm. This parameter correlates with LT50EL with R2 = 0.92 (Fig. 4B). Application of actinic light and measurement of steady state fluorescence Fs can be used to determine Fs/F0 that correlates with LT50EL with the highest R2 (R2 = 0.95, Fig. 3C).
Figure 4.
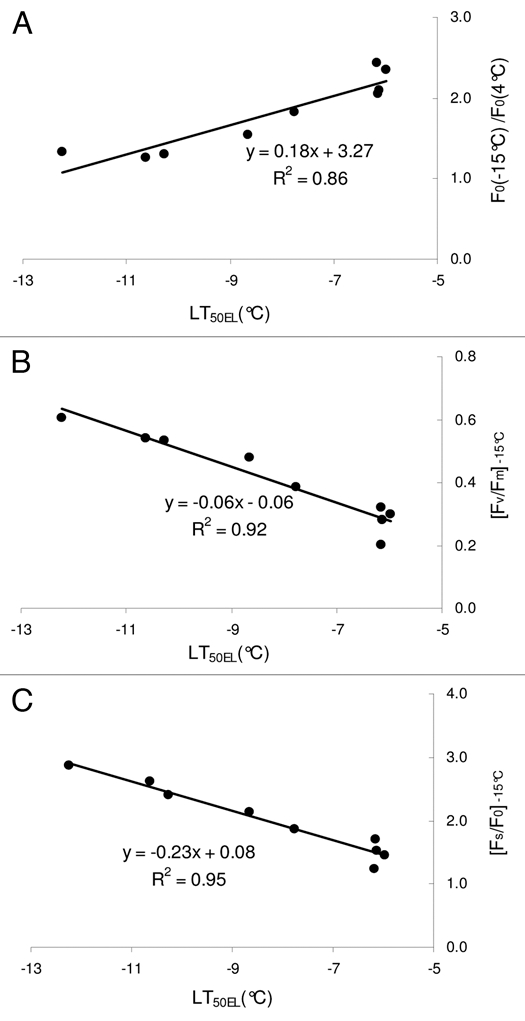
Correlation between LT50EL measured by the electrolyte leakage method and derived chlorophyll fluorescence parameters observed at temperature −15 °C: A− F0(−15°C)/F0(4°C); B− [Fv/Fm]−15°C; C− [Fs/F0]−15°C.
Chlorophyll fluorescence transients during low temperature stress.
Figures 5A–B present low light [40 µmol (photons) m−2s−1] induced chlorophyll fluorescence transients of the accession Te that is highly tolerant to low temperature stress. In the range from 5 to −10 °C, the initial rise of the fluorescence emission from the F0 level became faster and steeper with lowering of leaf temperature. The most pronounced qualitative difference in the transient profile occurred between −6 and −8 °C. In the slow phase of the fluorescence transients, the secondary maximum (M) is well formed at 0, −2, −4, and −6 °C and its position shifts from ca. 30 s at 0 °C to ca. 50 s at −6 °C.
Figure 5.

Chlorophyll fluorescence transients induced by low actinic light [40 µmol (photons) m−2s−1] in a cold tolerant (Te, panels A and B) and in a cold susceptible (Co, panels C and D) A. thaliana accessions. The chlorophyll fluorescence transients are the average of five measurements from different plant leaves. Left panels A and C show the initial fast phase of the transient whereas the entire transients during the low actinic light exposure, including 4 saturating flashes are shown in the right panels (B and D). The above transients are normalized with maximum fluorescence yield (Fm) and re-scaled from original transients (explained in M & M).
In the fluorescence transients of the highly cold sensitive accession Co (Figs. 5C–D), the secondary fluorescence maximum M dominates over the primary fluorescence peak P already at 5 °C and its amplitude rises steeply already between 5 and 0 °C. The position of this secondary maximum also shifts to longer times with lowering of the leaf temperature, but the shift is much smaller than in Te (Fig. 5B), remaining approximately close to 30 s – 45 s range.
In general, along with the increase in P level and broadening of the secondary peak a concomitant retardation in the kinetics of quenching was observed while cooling below 0 °C (Figs. 5B, D). Further lowering of the temperature virtually eliminated the slow part of the kinetics subsequent to P. The analysis of the shape of the chlorophyll fluorescence transients indicate that the cold tolerance could be detected without deep freezing of the investigated plants, possibly in a temperature range of around 0 to −5 °C.
Combinatorial imaging of low temperature stress.
In order to test whether cold tolerance of the A. thaliana accessions could be quantified solely based on fluorescence measurements in the temperature range around 0 °C to −5 °C, i.e. without exposure to lethal freezing, we employed a combinatorial imaging methods that was developed earlier and described in detail in Matouš et al.33 The method is based on a sequentional forward floating selection (SFFS)34 algorithm that identifies fluorescence images that yield the highest contrast between two classes of plants. The classification was done using the Linear Discriminant Classifier (LDC).35–37 By this method, we identified the three best performing images out of a total of 325 images of the sequence that captured the entire fluorescence transient. The selection was based on training and performance testing with transients in randomly selected pixel signals on Te and Co representing extremely cold tolerant and sensitive accessions, respectively. The training and testing was done using data obtained at −4 °C. The performance of the best performing classifier LDC with three images was around 81% when the simulated classification was executed with SFFS. The error of the classified pixels was approximately 9.5 % calculated as described in Mishra et al.38 The images identified as yielding the highest contrast between Te and Co accessions were I11(5s), I31(64s), and I50(82s). The three images yielded the linear combination F= 0.568*I(11)+ (−0.232)*I(31) +0.611*I(50) that is shown in Figure 6. The coefficients a, b, c were calculated as described in Matouš et al.33 Figure 6 shows the combinatorial images (F) for all nine accessions at different temperatures (−4 °C, 0 °C and −8 °C). The resulting image F was calculated according to the above mentioned equation and is shown in false color scale, where the color represents a virtual distance of the fluorescence signal from the training set that represented tolerant and sensitive phenotypes. The red color identifies signals that are close to the tolerant phenotype, while blue color shows the sensitive phenotype. Figure 6 indicates that classification was best in the temperature range of 0 to −4 °C not only in the accessions that were used in training (Co and Te) but also in other accessions. The classification failed at −8 °C and lower temperatures, where other features prevailed (Figs. 2 and 3). However, the result shown in Figure 6 demonstrates that a fluorescence-based assay of low temperature tolerance is effective without freezing the plants to lethal temperatures.
Figure 6.

Combinatorial images of leaves of nine differentially cold tolerant A. thaliana accessions. The images reflect classification by the linear discriminant classifier. The classification was trained with highly tolerant and susceptible accessions Te and Co phenotypes, respectively. The training was done with fluorescence transients captured at −4 °C. In this process, we obtained three coefficients for three images that are yielding the highest contrast between Te and Co accessions. The images of the other accession leaves are shown to demonstrate that the classification works for them at the temperature of training (−4 °C, left panel) as well as at 0 °C (central panel). The classification lost its capacity at −8 °C (right panel). Tolerant (Te, Rsch and Col) sensitive (Co, C24, Can and Cvi) and intermediates (Ler and Nd) accessions are marked by “+”, “−” and “±” with inside circle, respectively.
Discussion
Classification of differentially cold tolerant Arabidopsis thaliana accessions based on classical chlorophyll fluorescence analysis.
Subzero temperatures can initiate ice crystal formation in leaf tissues, usually starting with the intercellular space that surrounds the mesophyll cells. Because of the low water potential of ice, progressive ice crystal formation withdraws water from the cells, thus causing damage especially to the cellular membranes.39 The sensitivity of the membranes to cold damage is exploited by the electrolyte leakage method that quantifies cold tolerance by measuring leakage of electrolytes from cells following freeze-thaw cycles. This method mainly monitors intactness of the plasma membrane as a diffusion barrier, assuming that the degree of tissue injury is correlated with damage of the plasma membrane of mesophyll cells.40 Based on this method, we assigned nine A. thaliana accessions originating from differential geographical regions to three different cold tolerance groups, namely tolerant (Te, Rsch and Col-0), intermediate (Ler and Nd) and sensitive (Co, C24, Can and Cvi) (Fig. 1).
In contrast to the electrolyte leakage method, chlorophyll fluorescence based methods monitor the impact of low temperature on photosystems localized in the chloroplast thylakoid membranes of the leaf tissues. It is well documented that low temperature interferes with electron transport and structural integrity of photosystems,41 and, consequently, measurement of maximum yield of PSII photochemistry (Fv/Fm) has been successfully used to monitor cold tolerance after freeze-thaw cycles in Arabidopsis as well as in other plant species.22,25 Similar to the EL test, we found that the basic fluorescence parameter F0 (Fig. 2A) and derived parameters F0/F04°C, Fv/Fm and Fs/F0 (Fig. 3) evaluated from chlorophyll fluorescence transients measured during progressive cooling, discriminated three different groups of Arabidopsis accession, i.e. tolerant, intermediate and sensitive to low temperature. This discrimination was best at −15 °C. Our analysis demonstrated that the derived parameters F0(T)/F04°C and Fs(T)/F0(T) can as well be used for measuring low temperature tolerance (Fig. 3), and the parameter [Fs/F0]−15°C yielded a better correlation with LT50EL as compared to [Fv/Fm]-15°C (Fig. 4).
Measurement of chlorophyll fluorescence emission at temperatures lower than 0 °C can be partially affected by changes in the leaf optical properties as a consequence of ice crystal formation on the leaf surface. Due to the use of long pass filer (>695 nm), reflected light was already excluded from fluorescence measurements. However, optical effects could lower the intensity of absorbed light as well as prevent full saturation of the photosystems and thus the values of maximal fluorescence. Optical effects can be in principle minimized by in-filtering leaf samples in glycerin and by measuring the fluorescence in vacuum.29 Vacuum prevents the ice formation and glycerin can make an amorphous glass of the ice formed on the leaf surface. However, we cannot rule out effect on photosynthetic activity of the leaves by using glycerin and doing measurement in the vacuum is not practical for high-throughput scale. Therefore, we designed this experiment where a simultaneous fluorescence measurement of all nine differentially cold tolerant accessions was accomplished inside a freezer. In our experimental design absolute values may have partial effect of surface ice formation, in normalized fluorescence parameters possible impacts of leaf surface effects are circumvented and the calculated parameters should not be distorted.
We observed a prominent and non-linear increase in the minimal fluorescence F0 at temperatures below −6 °C. The steep change in F0 at subzero temperatures may be due to a limitation in the electron flow by mobile diffusion-limited transport molecules such as plastoquinones or due to reversible damage in PSII. In general, it clearly demonstrates that the ratio of F0 measured at low temperatures lower than −6 °C to F0 measured between −6 °C and +4 °C can be a good proxy of low temperature tolerance in A. thaliana accessions and, if the molecular mechanism is general, also in other plant species. F0 is strongly influenced by freezing induced dehydration of mesophyll protoplasts in alpine plants,30 and it could thus be argued that ice formation and subsequent cellular dehydration may be initiated in this temperature range. It has been hypothesized that Arabidopsis is actually not freezing tolerant but survives low temperatures only as long as ice formation can be avoided.13 However, the LT50EL values recorded by electrolyte leakage analysis do not exactly match the temperatures at which F0 started to increase. Although an effect of ice formation on F0 appears reasonable, F0 did not increase to high values in the tolerant accessions even at temperatures far lower than their LT50EL. This would argue against a direct causal relationship between ice formation and tissue damage in Arabidopsis leaves. Pospíšil et al.29 studied variation of F0 in a broad range of temperatures from − 100 °C to until 75 °C in barley plants. They observed a similar non-linear rise of F0 below −10 °C; however, in addition to this F0 rose concomitant with Fm below −50 °C. The minimum temperature (−15 °C) used in our experiments may thus not have been deep enough to observe the full rise of F0 in the tolerant accessions. Nevertheless, it becomes obvious that a direct correlation of the rise in F0 with tissue freezing or with tissue damage is not possible.
Chlorophyll fluorescence transients.
The chlorophyll fluorescence transients using the so called quenching analysis of modulated fluorescence by saturation pulses is a very useful technique to probe for photochemical activities in plants.42 Low actinic light [i=40 µmol (photons) m−2s−1] induced chlorophyll fluorescence induction curves showed the normal pattern in all nine Arabidopsis accessions above 0 °C. Cooling of the leaves to temperatures below 0 °C led to changes in the regular pattern of fluorescence (Fig. 5), probably resulting from alterations in photosynthesis, fluidity of membranes or osmotic potential at low temperatures.3 In contrast to the minimal fluorescence F0 that was invariable above −6 °C, a progressive increase in the fluorescence parameters peak P, peak M and steady state fluorescence (Fs) were observed already at temperatures below 0 °C. At the same time, fluorescence decay subsequent to P decreased, the position of P and M were shifted, and the slow phase containing peak M was broadened (Fig. 5B, D). Considering these chlorophyll fluorescence characteristics start changing as soon as subzero temperatures are reached, this might indicate that extracellular ice formation starts soon after the temperature falls below 0 °C and may not be directly linked to tissue damage. Low temperature reduction of chlorophyll quenching may also be caused by inhibition of oxygen evolving complexes,43 a slowdown of the Calvin cycle and hence the electron transport rate.44 Subsequent cooling causes Fs to attain the level of P, indicating that photosynthesis was completely abolished similar to what is observed when the electron transport was completely stopped by the application of the electron transport inhibitor DCMU [3-(3,4- Dichlorophenyl)-1,1-dimethylurea].45
Combinatorial imaging revealing low temperature tolerance at non-lethal temperature.
Combinatorial imaging based on advanced statistical analysis of fluorescence image sequences for information extraction from large data sets has already been demonstrated to be superior over conventional chlorophyll fluorescence parameter analysis in visualizing virus infection33 at very early stages and by discriminating plant species38 of the same family. We applied our advanced statistical approach of classifiers and feature selection methods to identify cold tolerance in A. thaliana accessions already at non-lethal temperatures where conventional chlorophyll fluorescence parameters failed to discriminate the accessions. We found that false color scale images obtained by combinatorial imaging gave better visual presentation and were able to discriminate freezing tolerant from sensitive accessions. Discrimination started immediately at 0 °C (Fig. 6) and became more prominent at −4 °C where the classifiers were trained. None of the conventional fluorescence parameters were able to distinguish freezing tolerant and sensitive accessions above −5 °C. This result reveals that the combinatorial imaging can be applied to achieve discrimination of tolerant and sensitive accessions of A. thaliana in a temperature range that is non-lethal. Such a system will be very useful for large scale screening of cold tolerance e.g. in recombinant inbred line populations or other plant sets consisting of individual plants representing different genotypes. The method is thus well suited for quantitative trait loci (QTL) mapping46 or mutant screening47 to identify genetic determinants of freezing tolerance, which may be used for plant breeding. Additionally the feature selection method reduces data sets as it selects only those images that contain useful information. This will not only speed up data analysis and facilitate data storage, but may also be a prerequisite for setting up automated screening systems.
Materials and methods
Plant material and growth conditions.
Nine accessions of A. thaliana extensively described in Hannah et al.10 were grown in soil/vermiculite (1:1) with three plants per 100 mm pot. The plants grew under natural light in a greenhouse that was supplemented to at least 80 µmol (photons) m−2s−1 from incandescent lamps from 6:00 A.M. to 10:00 P.M. (16 h). The temperature in the greenhouse was 22 °C during the day and 16 °C at night. The relative humidity was always around 70%. More details on the growth conditions are in Iftime et al.48
The accessions used in this study originate from various latitudes of the northern hemisphere: the Cvi accession from Cape Verde Islands, the Can accession from Canary Islands, the Co (Coimbra) and C24 accessions from Portugal). The Col-0 (Columbia-0) accession is genetically related to Gü (Gückingen) plants from Germany, the Nd (Niederzenz) accession from Germany, the Ler (Landsberg erecta) accession from Poland, the Rsch (Rschew) accession from Russia, and the Te (Tenela) accession from Finland. Twelve pots of each accession were grown for 6 weeks following the germination in 22 °C as described above. At the floral stage, plants were transferred to a cold chamber for acclimation at 4 °C for another 2 weeks. After the acclimation, a leaf was cut from each plant under water and used for the measurement of chlorophyll fluorescence emission transients. Other leaves of the same plant were used for the reference measurements of electrolyte leakage.
Electrolyte leakage test.
Electrolyte leakage from leaves after a freeze-thaw cycle was determined as a reference for low temperature tolerance of the Arabidopsis accessions. Three detached leaves from individual plants were placed in a glass tube containing 200 µl of distilled water. Glass tubes were transferred to a thermoregulated bath cooling at a rate of 2 °C.h−1. The minimum temperature of the freezing part of the cycle was set in the range between −1 °C and −20 °C as described in Rohde et al.16 Tubes were taken out from the cooling bath at different temperatures during cooling and thawed slowly on ice. Thawed leaves were then immersed in 7 ml of distilled water and placed on a shaker for 16 hours at 4 °C. The electrolyte leakage was determined as the ratio of the conductivity that was measured in the sample before and after boiling of the leaves. Non-linear sigmoidal curve fitting of the electrolyte leakage values was done using the software GraphPadPrism (www.graphpad.com/prism/Prism.htm). The temperature at which the electrolyte leakage ratio reached 0.5, i.e., 50% of tissue damage (LT50EL), was calculated as the log EC50 of the sigmoidal curve. Regression curves were calculated using means of 6 replicates.
Chlorophyll fluorescence imaging.
For the chlorophyll fluorescence measurement, leaves from plants of nine tested accession were cut and arranged on a metallic plate in such a way that petioles of the leaves were oriented outward and dipped in water inside plastic caps. The plate containing the leaves was placed inside a freezer that was slowly cooling down from 10 °C to −15 °C at a rate of 2 °C.h−1. The chlorophyll fluorescence emission of the leaves was measured every 30 min, i.e. after a decrease of the temperature by 1°C, using an imaging kinetic fluorometer (Handy FluorCam, model FC 1000-H, Photon Systems Instruments, Brno, Czech Republic, www.psi.cz). The handy FluorCam was equipped with a CCD camera (512 × 512 pixels, 12 bits) and four orange light emitting diode panels (LED's, 620 nm) as described in Nedbal et al.49 Flashes of the LED's were synchronized with the opening of the electronic shutter of the CCD camera. An optical filter RG695 was placed in front of the CCD camera to block the exciting light and allow recording of fluorescence images. The protocol of the fluorescence experiment (described in detail in Mishra et al.38) started with a measurement of minimum (F0) and maximum (Fm) fluorescence levels, followed by measurement of a fluorescence transient elicited by a sequential exposure to two levels of actinic irradiance [40 and 120 µmol (photons) m−2s−1] that were separated by 6 minutes of dark relaxation. Approximately equidistant during each actinic light exposure, 4 flashes of saturating light were given to probe the non-photochemical quenching of chlorophyll fluorescence (Fm). Another two saturating flashes were given in the dark following each actinic light exposure to sense the relaxation of the non-photochemical quenching. Image processing software integrated with the FluorCam (www.psi.cz) was used to process the captured image sequences. The fluorescence parameters were integrated over the whole leaf area and averages of five independent experiments were presented.
Combinatorial imaging of low temperature tolerance.
The combinatorial imaging was described earlier in Matouš et al.33 The technique identifies a small subset of fluorescence images that yield the best contrast between plants. Here, we applied the technique to enhance the contrast between plant accessions that were tolerant or susceptible to the low temperature treatment. The selection was from the total set of 325 fluorescence images in which the fluorescence transient of each accession was captured. All the images were first pre-processed by subtracting the background image segments where no plant was seen in the brightest Fm image. The statistical classifier was trained using fluorescence transients of a tolerant accession (Te, Finland) and of a susceptible accession (Co, Portugal), both transients measured at −4 °C. Each of the accessions was represented by fluorescence transients captured in randomly selected 800 camera pixels. The algorithm compared the tested fluorescence signals with these two training sets that represented tolerant and susceptible accessions. In comparison, the algorithm classified the signal captured in a particular pixel as belonging to either of the phenotypes. Here, we used the Linear Discriminant Classifier.35–37
The classification is an extremely demanding process if all the 325 data points of the fluorescence transient are included. The data processing time can be significantly shortened without compromising the performance by reducing the number of considered data points / images. The reduction is achieved by applying sequential forward floating feature selection (SFFS) algorithms.34 The method starts with identifying the fluorescence data point / image out of the original 325 sets in which the contrast between the susceptible and tolerant accession is maximal. This step is followed by finding a second point following the same criteria, followed by a homologous search in which the point that can be removed from the subset with a minimal loss of classification performance. This process is continued until an optimal classification subset is identified.
After identification of the three most contrasting images (features), the Linear Discriminant Analysis, LDA35 was used to find their most contrasting linear combination. The resulting image is constructed as a linear combination of signals in the given pixel of the three constituent images a.F(t1)+b.F(t2)+ c.F(t3). The linear combination was expressing a virtual distance of the fluorescence signal of a given pixel from the tolerant phenotype. In contrast to the conventional fluorescence parameters which were highly effective at temperatures approaching −15°C (Figs. 2 and 3), this combinatorial imaging aimed by their training at identifying the low temperature tolerance at relatively mild temperatures in between 0 to −5 °C.
Acknowledgements
The experiments were done in Stuttgart, Germany, with financial support of the Short Term Scientific Mission (STSM) program of European COST project, FA0605 to Anamika Mishra. Kumud B. Mishra acknowledges support by Ministry of Youth, Sports and Education of the Czech Republic projects (OC08055 and 2B06068) and CzechGlobe Centre that is being developed within the OP RDI and co-financed from EU funds and the State Budget of the Czech Republic (Project: CzechGlobe — Centre for Global Climate Change Impacts Studies, Reg. No. CZ.1.05/1.1.00/02.0073). We are thankful to the staff of Arnd G. Heyer laboratory for excellent assistance and hospitality during the experiments.
Abbreviations
- F0
minimal fluorescence emission of a dark adapted plant with primary quinine acceptor QA, oxidized and non-photochemical quenching inactive
- Fm
maximum fluorescence emission of a dark adapted plant exposed to a short pulse of a strong light leading to a transient reduction of QA
- Fv
variable fluorescence (Fv=Fm−F0)
- Fv/Fm
ratio interpreted as the maximum quantum yield of PSII photochemistry
- P
fluorescence peak at the beginning of the transient with actinic light
- M
the secondary maxima of the chlorophyll fluorescence transients subsequent to peak P
- Fs
steady state fluorescence
- PSII
Photosystem II
- PSI
Photosystem I
- EL
electrolyte leakage
- LT50EL
the temperature (lethal temperature) at which 50% of electrolyte leakage occurs when measured by conductivity in a freeze-thaw cycle
References
- 1.Smallwood M, Bowles DJ. Plants in a cold climate. Philos T R Soc B. 2002;357:831–846. doi: 10.1098/rstb.2002.1073. [DOI] [PMC free article] [PubMed] [Google Scholar]
- 2.Moon BY, Higashi SI, Gombos Z, Murata N. Unsaturation of the membrane-lipids of chloroplasts stabilizes the photosynthetic machinery against low-temperature photoinhibition in transgenic tomato plants. Proc Natl Acad Sci USA. 1995;92:6219–6223. doi: 10.1073/pnas.92.14.6219. [DOI] [PMC free article] [PubMed] [Google Scholar]
- 3.Moffatt B, Ewart V, Eastman A. Cold comfort: plant antifreeze proteins. Physiol Plant. 2006;126:5–16. doi: 10.1111/j.1399-3054.2006.00618.x. [DOI] [Google Scholar]
- 4.Heidarvand L, Amiri RM. What happens in plant molecular responses to cold stress? Acta Physiol Plant. 2010;32:419–431. doi: 10.1007/s11738-009-0451-8. [DOI] [Google Scholar]
- 5.Hincha DK. Cryoprotectin: a plant lipid-transfer protein homologue that stabilizes membranes during freezing. Philos T R Soc B. 2002;357:909–915. doi: 10.1098/rstb.2002.1079. [DOI] [PMC free article] [PubMed] [Google Scholar]
- 6.Öquist G, Huner NPA. Cold hardening induced resistance to photoinhibition in winter rye is dependent upon an increase capacity for photosynthesis. Planta. 1993;189:150–156. [Google Scholar]
- 7.Strand A, Hurry V, Henkes S, Huner N, Gustafsson P, Gardeström P, Stitt M. Acclimation of Arabidopsis leaves developing at low temperature: Increasing cytoplasmic volume accompanies increased activities of enzymes in the Calvin cycle and in the sucrose-biosynthesis pathway. Plant Physiol. 1999;119:1387–1397. doi: 10.1104/pp.119.4.1387. [DOI] [PMC free article] [PubMed] [Google Scholar]
- 8.Stitt M, Hurry V. A plant for all seasons: alteration in photosynthetic carbon metabolism during cold acclimation in Arabidopsis. Curr Opin Plant Biol. 2002;5:199–206. doi: 10.1016/s1369-5266(02)00258-3. [DOI] [PubMed] [Google Scholar]
- 9.Mitchell - Olds T, Schmitt J. Genetic mechanisms and evolutionary significance of natural variation in Arabidopsis. Nature. 2006;441:947–952. doi: 10.1038/nature04878. [DOI] [PubMed] [Google Scholar]
- 10.Hannah MA, Wiese D, Freund S, Fiehn O, Heyer AG, Hincha DK. Natural genetic variation of freezing tolerance in Arabidopsis. Plant Physiol. 2006;142:98–112. doi: 10.1104/pp.106.081141. [DOI] [PMC free article] [PubMed] [Google Scholar]
- 11.Zhen Y, Ungerer MC. Relaxed selection on the CBF/DREB1 regulatory genes and reduced freezing tolerance in the southern range of Arabidopsis thaliana. Mol Biol Evol. 2008;25:2547–2555. doi: 10.1093/molbev/msn196. [DOI] [PubMed] [Google Scholar]
- 12.Bodner M, Beck E. Effect of supercooling and freezing on photosynthesis in freezing tolerant leaves of Afroalpine gaint rosette plants. Oecologia. 1987;72:366–371. doi: 10.1007/BF00377565. [DOI] [PubMed] [Google Scholar]
- 13.Reyes-Díaz M, Ulloa N, Zúniga-Feest A, Gutiérrez A, Gidekel M, Alberdi M, Corcuera LJ, Bravo LA. Arabidopsis thaliana avoids freezing by supercooling. J Exp Bot. 2006;57:3687–3696. doi: 10.1093/jxb/erl125. [DOI] [PubMed] [Google Scholar]
- 14.Novillo F, Alonso JM, Ecker JR, Salinas J. CBF2/DREB1C is a negative regulator of CBF1/DREB1B and BF3/DREB1A expression and plays a central role in stress tolerance in Arabidopsis. Proc Natl Acad Sci USA. 2004;101:3985–3990. doi: 10.1073/pnas.0303029101. [DOI] [PMC free article] [PubMed] [Google Scholar]
- 15.Steponkus PL, Lynch DV, Uemura M. The influence of cold-acclimation on the lipid-composition and cryobehavior of the plasma-membrane of isolated rye protoplasts. Philos T R Soc B. 1990;326:571–583. [Google Scholar]
- 16.Rohde P, Hincha DK, Heyer AG. Heterosis in the freezing tolerance of crosses between two Arabidopsis thaliana accessions (Columbia-0 and C24) that show differences in non-acclimated and acclimated freezing tolerance. Plant J. 2004;38:790–799. doi: 10.1111/j.1365-313X.2004.02080.x. [DOI] [PubMed] [Google Scholar]
- 17.Murray MB, Cape JN, Fowler D. Quantification of frost damage in plant-tissues by rates of electrolyte leakage. New Phytol. 1989;113:307–311. doi: 10.1111/j.1469-8137.1989.tb02408.x. [DOI] [PubMed] [Google Scholar]
- 18.Rumich-Bayer S, Krause GH. Freezing damage and frost tolerance of the photosynthetic apparatus studied with isolated mesophyll protoplasts of Valerianella locusta L. Photosynth Res. 1986;8:161–174. doi: 10.1007/BF00035246. [DOI] [PubMed] [Google Scholar]
- 19.Hincha DK, Sieg F, Bakaltcheva I, Köth H, Schmitt JM. Freeze-thaw damage to thylakoid membranes: specific protection by sugars and proteins. In: Steponkus PL, editor. Advances in low-temperature biology. London: JAI Press; 1996. pp. 141–183. [Google Scholar]
- 20.Agati G, Cerovic ZG, Moya I. The effect of decreasing temperature up to chilling values on the in vivo F685/F735 chlorophyll fluorescence ratio in Phaseolus vulgaris and Pisum sativum: The role of the photosystem I contribution to the 735 nm fluorescence band. Photochem Photobiol. 2000;72:75–84. doi: 10.1562/0031-8655(2000)072<0075:teodtu>2.0.co;2. [DOI] [PubMed] [Google Scholar]
- 21.Artus NN, Uemura M, Steponkus PL, Gilmour SJ, Lin CT, Thomashow MF. Constitutive expression of the cold-regulated Arabidopsis thaliana COR15a gene affects both chloroplast and protoplast freezing tolerance. Proc Natl Acad Sci USA. 1996;93:13404–13409. doi: 10.1073/pnas.93.23.13404. [DOI] [PMC free article] [PubMed] [Google Scholar]
- 22.Ehlert B, Hincha DK. Chlorophyll fluorescence imaging accurately quantifies freezing damage and cold acclimation responses in Arabidopsis leaves. Plant Methods. 2008;4:12. doi: 10.1186/1746-4811-4-12. [DOI] [PMC free article] [PubMed] [Google Scholar]
- 23.Rizza F, Pagani D, Stanca AM, Cattivelli L. Use of chlorophyll fluorescence to evaluate the cold acclimation and freezing tolerance of winter and spring oats. Plant Breeding. 2001;120:389–396. [Google Scholar]
- 24.Peguero-Pina JJ, Morales F, Gil-Pelegrin E. Frost damage in Pinus sylvestris L. stems assessed by chlorophyll fluorescence in cortical bark chlorenchyma. Ann For Sci. 2008;65(8):813P1–813P6. [Google Scholar]
- 25.Baker NR, Rosenqvist E. Applications of chlorophyll fluorescence can improve crop production strategies: an examination of future possibilities. J Exp Bot. 2004;55:1607–1621. doi: 10.1093/jxb/erh196. [DOI] [PubMed] [Google Scholar]
- 26.Neuner G, Buchner O. Assessment of foliar frost damage: a comparison of in vivo chlorophyll fluorescence with other viability tests. J Appl Bot. 1999;73:50–54. [Google Scholar]
- 27.Rapacz M. Chlorophyll a fluorescence transient during freezing and recovery in winter wheat. Photosynthetica. 2007;45:409–418. [Google Scholar]
- 28.Rapacz M, Wołniczka A. A selection tool for freezing tolerance in common wheat using the fast chlorophyll a fluorescence transcients. Plant Breeding. 2009;128:227–234. [Google Scholar]
- 29.Pospíšil P, Skotnica J, Nauš J. Low and high temperature dependence of minimum F0 and maximum Fm chlorophyll fluorescence in vivo. Biochimica et Biophysica Acta. 1998;1363:95–99. doi: 10.1016/s0005-2728(97)00095-9. [DOI] [PubMed] [Google Scholar]
- 30.Neuner G, Pramsohler M. Freezing and high temperature thresholds of photosystem II compared to ice nucleation, frost and heat damage in evergreen subalpine plants. Physiol Plant. 2006;126:196–204. [Google Scholar]
- 31.Hacker J, Spindelbock JP, Neuner G. Mesophyll freezing and effects of freeze dehydration visualized by simultaneous measurement of IDTA and differential imaging chlorophyll fluorescence. Plant Cell Environ. 2008;31:1725–1733. doi: 10.1111/j.1365-3040.2008.01881.x. [DOI] [PubMed] [Google Scholar]
- 32.Nedbal L, Whitmarsh J. Chlorophyll fluorescence imaging of leaves and fruits. In: Papageorgiou G, Govindjee, editors. Chlorophyll a fluorescence: A signature of photosynthesis. Dordrech: Springer; 2004. pp. 389–407. [Google Scholar]
- 33.Matouš K, Benediktyova Z, Berger S, Roitsch T, Nedbal L. Case study of combinatorial imaging: What protocol and what chlorophyll fluorescence image to use when visualizing infection of Arabidopsis thaliana by Pseudomonas syringae? Photosynth Res. 2006;90:243–253. doi: 10.1007/s11120-006-9120-6. [DOI] [PubMed] [Google Scholar]
- 34.Pudil P, Novovicova J, Kittler J. Floating search methods in feature selection. Pattern Recogn Lett. 1994;15:1119–1125. [Google Scholar]
- 35.Fukunaga K, editor. Introduction to statistical pattern recognition. 2nd edn. San Diego, USA: Academic Press Professional; 1990. [Google Scholar]
- 36.Martinez AM, Kak AC. PCA versus LDA. IEEE Trans Pattern Anal Mach Intell. 2001;23:228–233. doi: 10.1109/34.908974. [DOI] [Google Scholar]
- 37.Wang XC, Paliwal KK. Feature extraction and dimensionality reduction algorithms and their applications in vowel recognition. Pattern Recogn. 2003;36:2429–2439. doi: 10.1016/S0031-3203(03)00044-X. [DOI] [Google Scholar]
- 38.Mishra A, Matouš K, Mishra KB, Nedbal L. Towards discrimination of plant species by machine vision: advanced statistical analysis of chlorophyll fluorescence transients. J Fluoresc. 2009;19:905–913. doi: 10.1007/s10895-009-0491-x. [DOI] [PubMed] [Google Scholar]
- 39.Dowgert MF, Steponkus PL. Behaviour of the plasma-membrane of isolated protoplasts during a freeze thaw cycle. Plant Physiol. 1984;75:1139–1151. doi: 10.1104/pp.75.4.1139. [DOI] [PMC free article] [PubMed] [Google Scholar]
- 40.Steponkus PL. Role of the plasma membrane in freezing-injury and cold acclimation. Annu Rev Plant Physiol Plant Mol Biol. 1984;35:543–584. [Google Scholar]
- 41.Barth C, Krause GH. Inhibition of photosystems I and II in chilling-sensitive and chilling-tolerant plants under light and low-temperature stress. Zeitschrift für Naturforschung C, J Biosci. 1999;54:645–657. (Ger). [Google Scholar]
- 42.Maxwell K, Johnson GN. Chlorophyll fluorescence: A practical guide. J Exp Bot. 2000;51:659–668. doi: 10.1093/jxb/51.345.659. [DOI] [PubMed] [Google Scholar]
- 43.Demeter S, Rozsa Z, Vass I, Hideg E. Thermo-luminescence study of charge recombination in photosystem-II at low temperatures.2. Oscillatory properties of the ZV and thermo-luminescence bands in chloroplast dark-adapted for various time periods. Biochim Biophys Acta. 1985;809:379–387. [Google Scholar]
- 44.Krause GH, Somersalo S. Fluorescence as a tool in photosynthesis research: Application in studies of photoinhibition, cold acclimation and freezing stress. Philos T R Soc B. 1989;323:281–293. [Google Scholar]
- 45.Govindjee Sixty-three years since Kautsky: chlorophyll α fluorescence. Aust J Plant Physiol. 1995;22:131–160. [Google Scholar]
- 46.Collard BCY, Jahufer MZZ, Brouwer JB, Pang ECK. An introduction to markers, quantitative trait loci (QTL) mapping and marker-assisted selection for crop improvement: The basic concepts. Euphytica. 2005;142:169–196. doi: 10.1007/s10681-005-1681-5. [DOI] [Google Scholar]
- 47.Codrea MC, Hakala-Yatkin M, Karlund-Marttila A, Nedbal L, Aittokallio T, Nevalainen OS, Tyystjävi E. Mahalanobis distance screening of Arabidopsis mutants with chlorophyll fluorescence. Photosynth Res. 2010;105:273–283. doi: 10.1007/s11120-010-9578-0. [DOI] [PubMed] [Google Scholar]
- 48.Iftime D, Hannah MA, Peterbauer T, Heyer AG. Stachyose in the cytosol does not influence freezing tolerance of transgenic Arabidopsis expressing stachyose synthase from adzuki bean. Plant Sci. 2011;180:24–30. doi: 10.1016/j.plantsci.2010.07.012. [DOI] [PubMed] [Google Scholar]
- 49.Nedbal L, Soukupová J, Kaftan D, Whitmarsh J, Trtílek M. Kinetic imaging of chlorophyll fluorescence using modulated light. Photosynth Res. 2000;66:3. doi: 10.1023/A:1010729821876. [DOI] [PubMed] [Google Scholar]