Abstract
The Poisson–Nernst–Planck (PNP) model is based on a mean-field approximation of ion interactions and continuum descriptions of concentration and electrostatic potential. It provides qualitative explanation and increasingly quantitative predictions of experimental measurements for the ion transport problems in many areas such as semiconductor devices, nanofluidic systems, and biological systems, despite many limitations. While the PNP model gives a good prediction of the ion transport phenomenon for chemical, physical, and biological systems, the number of equations to be solved and the number of diffusion coefficient profiles to be determined for the calculation directly depend on the number of ion species in the system, since each ion species corresponds to one Nernst–Planck equation and one position-dependent diffusion coefficient profile. In a complex system with multiple ion species, the PNP can be computationally expensive and parameter demanding, as experimental measurements of diffusion coefficient profiles are generally quite limited for most confined regions such as ion channels, nanostructures and nanopores. We propose an alternative model to reduce number of Nernst–Planck equations to be solved in complex chemical and biological systems with multiple ion species by substituting Nernst–Planck equations with Boltzmann distributions of ion concentrations. As such, we solve the coupled Poisson–Boltzmann and Nernst–Planck (PBNP) equations, instead of the PNP equations. The proposed PBNP equations are derived from a total energy functional by using the variational principle. We design a number of computational techniques, including the Dirichlet to Neumann mapping, the matched interface and boundary, and relaxation based iterative procedure, to ensure efficient solution of the proposed PBNP equations. Two protein molecules, cytochrome c551 and Gramicidin A, are employed to validate the proposed model under a wide range of bulk ion concentrations and external voltages. Extensive numerical experiments show that there is an excellent consistency between the results predicted from the present PBNP model and those obtained from the PNP model in terms of the electrostatic potentials, ion concentration profiles, and current–voltage (I–V) curves. The present PBNP model is further validated by a comparison with experimental measurements of I–V curves under various ion bulk concentrations. Numerical experiments indicate that the proposed PBNP model is more efficient than the original PNP model in terms of simulation time.
INTRODUCTION
One of the most interesting problems studied in biophysics is the molecular mechanism of ionic movements through transmembrane channels,1 which is of crucial importance to living cells. Ion channels are pore-forming proteins observed in cell membranes, usually allowing specific ions to pass across the membranes and maintaining the correct internal ion composition.2 They play important roles in the cellular activity via regulating the flow of ions,3 and are fundamental elements in many basic biological processes from excitation, signaling, gene regulation, to secretion and absorption.4 Therefore, ion channels are crucial to cell survival and function.
In order to understand the physiological function of the ion channels, a number of theoretical and computational approaches have been developed over the past few decades based on the molecular structures of channel components.5 In classical molecular dynamics (MD), ion, water, and protein dynamics are described in the atomic detail. Due to computational cost, it is challenging to carry out the MD simulation up to the time scale required for a sufficiently large number of ions to pass through the channels and thereby determine the macroscopic current.5, 6 To improve the computational efficiency, approaches that reduce the dimensionality of the ion channel systems by making some simplified assumptions become popular in the study of ion channel dynamics and transport. One of these approaches is Monte Carlo (MC) methods,7 in which “the ions are undergoing a random walk on a discrete mesh.”8 Another class of important simplified models is Brownian dynamics (BD), in which motions of ions follow a stochastic governing equation describing some effective potential effects. Both MC and BD approaches represent ions explicitly while treating solvent and lipids as featureless dielectric media.8 These reduced models are simpler and computationally less demanding than all-atom MD methods and have been attractive in ion channel transport modeling and predictions for many years. A quantum dynamics in continuum model via the Poisson–Boltzmann Kohn–Sham equations has been proposed to account for the quantum effect in the proton transport of transmembrane proteins.9 Further simplifications based on continuum theory, which are the so called mean field approximations, also gain much attention recently. In the mean field continuum theory, the involved ion species are represented by macroscopic ion concentrations instead of microscopic discrete particles. Since all the above mentioned models treat the system of interest with different levels of complexity, each model has its own merits and limitations.5, 6, 8, 9, 10, 11, 12
One of the most popular continuum theories describing ion transport in complex biological systems is the Poisson–Nernst–Planck (PNP) model. In the PNP theory, the Poisson equation is applied to describe the electric field in terms of the electrostatic potential, whose gradient serves as the electric driven force of the ion motion. The Nernst–Planck (NP) equation is used to describe the electrodiffusion of ions in terms of ion concentration. The coupled PNP equations are widely used in chemistry, physics, biology, and many engineering sciences. However, the PNP model has some well-known limitations, such as the neglect of the finite volume effect of ion particles7 and correlation effects (i.e., self-energy). These limitations may become important for ion transport in highly confined channels.13 Concerning about the model limitations such as ion–ion interactions and steric effects,14 some modifications have been developed recently to improve the theory. Corry et al.15 demonstrated that if a specific self-energy term is included in the Nernst–Planck equation, qualitative improvements could be observed in PNP computational results comparing to the BD simulations. Kilic et al.14, 16 proposed a simple modification of the widely used PNP equations, which could include the steric effects for the ionic transport. Therefore, PNP theory has gained much attention in the sense that it provides a general framework to successfully describe the essential ionic transport phenomenon in electrochemistry.17 It offers reasonable predictions for many applications and its limitations in some specific applications, such as ion channel systems, can be improved by simply adjusting the diffusion coefficients, or by considering additional force contributions in the ion flux term of the Nernst–Planck equation. Despite many limitations, the PNP theory is still one of the most well-established models in this field. The basic framework and essential assumptions of the PNP theory are still used in most modifications.
In many applications of the PNP model, the goal is to generate the electrostatic potential profile around the biomolecule and the concentration profiles of each ion species. For realistic applications in the cellular environment, the PNP theory may become cumbersome due to the existence of a large number of ion species. First, a three-dimensional (3D) concentration profile is to be computed from a Nernst–Planck equation for each ionic species. This can be a computational burden when the number of ionic species is very large. Additionally, in the solution of the NP equations, diffusion coefficient profiles are required for all ionic species. Experimental measurements are often not available for complex ionic species, such as nucleotides. Even for simple ionic species, their diffusion coefficient profiles are often not accurate in the geometrically confined locations. This fact severely limits the prediction power of the PNP model. Therefore, it is highly desirable to come up with a modified PNP model in which one does not have to solve one 3D NP equation for each ionic species, but is still able to offer the basic prediction of electrostatic profile around the biomolecule and the concentration profiles of each ionic species.
The objective of the present work is to explore the possibility of avoiding the solution of some or all of the NP equations in realistic applications. We present implicit treatments of certain or all ionic species as those in the implicit solvent theory.18, 19, 20, 21 Consider a system where multiple ionic species coexist, and the ion transport is driven by the external electric field. We model the ion species in two different manners. For the target ions (ions of interest), the Nernst–Planck equation is used for the description; whereas for the rest ions in the system (ions of no interest), Boltzmann distributions of the total potential, including electrostatic and chemical potentials, is employed for their descriptions. All ion species contribute to the electrostatic potential governed by the Poisson theory. Consequently, we have a system of coupled Poisson–Boltzmann Nernst–Planck (PBNP) equations. We call this a PBNP model, or an implicit PNP model. The coupled PBNP equations are derived from a total energy functional using the variational method via the Euler–Lagrange equation. One advantage of this semiexplicit ionic representation is that fewer Nernst–Planck equations are to be solved. Additional benefit of our PBNP model is that one can avoid the modeling errors due to incomplete knowledge of diffusion coefficient profiles for many ion species. The rationalities of treating ion concentrations in the implicit representation lie in the following aspects: First, if the ionic flux is zero for the electrodiffusion system, PNP system is known to be equivalent to Poisson–Boltzmann system;8 Second, in the electrochemical potential representation, an exponential relation can be observed between the ion concentration and electrostatic potential, both in the equilibrium and nonequilibrium systems; Third, several researchers have pointed out the connections and differences between the PNP and Poisson–Boltzmann (PB) models under various circumstances. If the electrostatic potential is decomposed into two parts, i.e., externally imposed potential and the internal electric potential, usually the internal electric potential is modeled by the PB equation for the bulk region.22, 23 The difference between PB and PNP models in the analysis of electro-osmotic flows is studied. It is found that the PB model provides a good prediction if the electric double layer (EDL) is thin and the solvent region is of regular shapes.22, 23 While in other cases where the EDL is thick or the solvent region is of irregular shapes where the convective transport of ions is not negligible, it is necessary to apply the PNP model for a reasonable prediction. Also, in a reduced model24 for the reactive and nonreactive species, the reactive species is modeled by the Nernst–Planck model and the nonreactive species follows equilibrium Boltzmann distribution. Differences are observed by comparisons between PB equations and the reduced model when there is a chemical reaction. While the differences between equilibrium PB and Nernst–Planck models are emphasized in previous work, the present work considers an electrodiffusion system under external electric field and explores the connections of Nernst–Planck equations and the general Boltzmann distribution. The PB equation 20 in the present work is different from that in the original PB equation18, 19, 20 and that in other reduced model.24 The relations between the proposed model and the original Nernst–Planck representations are discussed.
The rest of the present paper is organized as follows. Section 2 is devoted to the theory and formulation of our theoretical models. The basic theories are briefly reviewed to illustrate the motivation and establish notations. The PBNP model is presented. In Sec. 3, a number of associated computational algorithms are proposed and discussed. Both linear and nonlinear implementations of the PB equation are discussed for solving the electrostatic potential. For the interface problem in the Poisson equation and the PB equation, the matched interface and boundary (MIB) method25, 26, 27 is utilized to enforce the interface jump condition and to obtain the second order of accuracy. The Gummel iteration technique28, 29 is utilized for coupled iteration between electrostatic potential and ion concentrations. A Dirichlet to Neumann mapping (DNM) technique is used to improve the convergence of the PB equation in the presence of singular charges. To verify the feasibility of the proposed model, comparison between PNP and PBNP models are carried out in Sec. 4. It can be observed that predictions obtained from the PBNP model are in an excellent agreement with those obtained from the PNP model in terms of ion concentration and electrostatic potential profiles. Therefore, the proposed PBNP model can be utilized as an alternative model to reduce the computational complexity when multiple ionic species exist in chemical, physical, and biological systems. The proposed PBNP model is carefully validated in terms of electrostatic potential, ionic concentration profiles and current–voltage (I–V) curves by using realistic biomolecular systems. Applications are considered to the Gramicidin A (GA) channel and cytochrome c551. A comparison with experimental data further confirms the validity of the present PBNP model. A comparison of central processing unit (CPU) cost indicates that the proposed PBNP model is much more efficient than the PNP model. In the end, the present work is summarized and some applicable areas are discussed in the conclusion part.
THEORY AND FORMULATION
To establish notations and a framework for our implicit model, we briefly review the PNP model. A more comprehensive derivation of the PNP model together with a differential geometry based solvent-solute interface description can be found elsewhere.18 The variational derivation of the PBNP model via the Euler–Lagrange variational theory is presented.
Poisson-Nernst-Planck (PNP) model
Consider an open domain Ω∈R3, Ω = Ωm∪Ωs, where Ωm represents the solute region (or the ion exclusion region) and Ωs represents the solvent region (or the ion inclusion region). The interface is denoted by Γ such that Γ = Ωm∩Ωs. In electrochemistry, the electrochemical potential is the mechanical work done in bringing one mole of an ion species from a standard state to a specified concentration and electrical potential. Under the conditions that the particles do not interact and that their concentrations are sufficiently low, the total chemical potential (electrochemical potential) of the αth ion species, denoted as , can be expressed as30
| (1) |
where Φ is the electrostatic potential of the system, kB and T are the Boltzmann constant and the absolute temperature, respectively, nα and qα are the concentration and the valence of the αth ion species, respectively. Here, nQα is the intrinsic concentration of the αth species,30 note that the intrinsic concentration is independent of the concentration nα, and for a specific ion species, it is a constant under a given temperature. For example, nQ is the density of state for an ideal gas nQ = ((mgkBT)/(2πℏ2))3/2, where mg is the molecular mass of the gas and ℏ is the reduced Planck constant.
Denote as a homogeneous reference chemical potential at which the associated ion concentration is n0α and Φ = 0. Then the following relation can be obtained from Eq. 1:
| (2) |
Then the concentration has the following form:
| (3) |
where . Note that is position independent.
When the system is in equilibrium, then μα(r)=0, one has ρα = qαnα = qαn0α exp [ − (qαΦ)/(kBT)], which is the charge source term in the normal Poisson–Boltzmann equation. Define the ion flux Jα as
| (4) |
and according to the general conservation law,14
| (5) |
Therefore, the concentration nα is governed by the following Nernst–Planck equation:
| (6) |
where Dα(r) is the spatially dependent diffusion coefficient of ion species α and Nc is the total number of ion species in the systems. In general, it is difficult to obtain valid Dα(r) profiles for nanobio environments, although its bulk values are commonly known from experimental measurements. Moreover, for complex ion species, such as charged ligand and many biomolecules, experimental data of the bulk diffusion coefficients may not be available. This difficulty limits the applicability and predictive accuracy of the Nernst–Planck equation. In Eq. 6, the potential Φ is governed by the Poisson equation
| (7) |
where the fixed charge density is given by
| (8) |
with qj being the (fractional) charge of the biomolecule at position rj(j = 1, 2, …, Na), r indicates the position where the function∕variable is defined, (r = (x, y, z) ∈ Ω), and Na indicates the total number of charged atoms in the solute. In most biophysical models, the dielectric function ε is defined as a piecewise constant
| (9) |
where εm and εs are the dielectric constants in the molecular and solvent regions, respectively. Equations 6, 7 form the PNP system, where the Poisson equation describes the electrostatic potential and the Nernst–Planck equation describes the concentration of each ion species. The PNP equations are coupled together to form a closed system and have been widely used for electrochemical diffusion, nanofluidic systems and ion channel applications.
Poisson-Boltzmann-Nernst-Planck (PBNP) model
The PNP model gives a good prediction of ion transport phenomena in the biological channels for nonequilibrium systems. However, the computational cost increases dramatically as the number of ion species in the system increases. Since the concentration of each ion species is governed by one Nernst–Planck equation, the number of equations needed to be solved depends directly on the number of ion species in the system. In a complex system with multiple ion species, the PNP system can be a complicated model. Here an alternative model is proposed to reduce the number of Nernst–Planck equations needed for a system with multiple ion species. In our model, we treat ion species in two different representations. Specifically, the Nernst–Planck equation is applied for the description of the ion species of interest, while the concentrations of other ion species in the system are represented by the Boltzmann distributions as shown in Eq. 3. As a result, the electrostatic potential of the system is governed by the Poisson–Boltzmann equation, rather than by the Poisson equation 7.
Assuming that the total number of ion species in the system is Nc, and we are interested in certain ion species (which are called the target ion species), while the rest of the ion species are not the ions of interest, but their impact on the system has to be returned. We denote nα(α = 1, …, NNP) as the concentration of the target ion species, nβ(β = NNP + 1, …, Nc) as the concentration of the remaining ion species in the system, where NNP is the total number of ion species treated by using the Nernst–Planck equation, and NB = Nc − NNP is the total number of the remaining ion species which are represented by the Boltzmann distribution. Based on this consideration, we propose the total free energy functional
| (10) |
The total energy functional is designed in the same spirit as our earlier variational formalism18 and as that in the literature.31, 32 By taking the variation of G[Φ, nα, NNP] with respect to the electrostatic potential, Φ, one has
| (11) |
where static charge sources and quasiequilibrium charge sources are represented by
| (12) |
| (13) |
Here n0β represents the bulk concentration of the βth ion species.
By taking the variation of G[Φ, nα, NNP] with respect to nα (α = 1, 2, …, NNP),
| (14) |
Similarly, we consider the dynamic ion flux Jα
| (15) |
and the conservation of density leads to
| (16) |
Therefore, the concentration nα is governed by the following Nernst–Planck equation:
| (17) |
Equations 11, 17 are coupled to each other and form a closed equation system, i.e., the Poisson–Boltzmann–Nernst–Planck equations.
To ensure the well posedness, Eq. 11 satisfies the jump conditions at the interface Γ
| (18) |
where Φn indicates the derivative along the normal direction with n being the outward normal direction of the interface. For a function u, the jump [ · ] in Eq. 37 is defined as
| (19) |
The steady state of the equation system 11, 17 can be written as follows:
| (20) |
and
| (21) |
Equations 20, 21 are together named a steady state Poisson–Boltzmann–Nernst–Planck system, and its time-dependent version is given in Eqs. 11, 17. The PBNP system differs from the original PNP system in the sense that only the ions of interest are described by the Nernst–Planck equation while others are described by the Boltzmann distribution. An advantage of the PBNP system is that one does not have to solve one Nernst–Planck equation for each ion species. This can reduce the computational cost when there are multiple ion species in a biomolecular system. Additionally, since the Nernst–Planck equation requires the knowledge of the diffusion coefficient for each ion species in the solvent domain, this can be a hurdle in real applications. Particularly, the diffusion coefficient is position-dependent in general and its experimental measurement is often unavailable for different ion channels. Therefore, the proposed PBNP model can avoid this difficulty for many ion species. Moreover, the PB equation 20 in the present PBNP system is different from that in the original PB equation18, 19, 20 and that in other reduced model.24
Define ∂Ω as the boundary of the whole domain for the Poisson equation or the Poisson–Boltzmann equation, the electrostatic potential satisfies the far field boundary condition, i.e., limr→±∞Φ(r)=0. In practical computations, Dirichlet and Neumann boundary conditions are mostly used, i.e., Φ(r)=Φ0(r) is given on ∂Ω where the external voltage is applied. The Neumann boundary can be used in other parts of boundaries. Numerical tests indicate that as long as boundaries are sufficiently far from the ion channel region, the boundary conditions are not very important, except for the applied voltage conditions.
Note that the boundary of the Nernst–Planck equation is defined only as the boundary of the solvent domain Ωs. First, zero flux condition is applied on the interface Γ = Ωm∩Ωs (Ref. 17)
| (22) |
Furthermore, on the boundary ∂Ωs∩∂Ω, nα(r)=n0α is enforced according to the bulk concentration of each species. The knowledge of μβ is required in the application of the proposed PBNP system to ion channel transport. We show in the present work that μβ can be estimated during the computation. In fact, for equilibrium system without external electrical field, μβ vanishes.
It remains to explore the domain of applicability, the usefulness and the effectiveness of the PBNP model. In particular, we are interested in the understanding whether the proposed PBNP model can be used in place of the PNP model for ion channel transport in complex biomolecular systems, with and without the presence of the external voltage. To this end, we develop computational techniques for the present PBNP model in Sec. 3.
NUMERICAL ALGORITHMS
The solution of the proposed PBNP equations is quite technically intriguing. For the closely related PNP equations, a second order accurate scheme has not been developed until very recently for realistic biomolecular systems.17 Here, “second order accurate” means that when the mesh size is halved, the accuracy increases by a factor of 22 times. Although achieving this factor may appear easy in the solution of many other partial differential equations, it is a severe challenge in solving the PBNP equations for realistic biomolecular systems. The first difficulty is due to the fact that the proposed PBNP equations are nonlinear and closely coupled, making their solution nontrivial. Additionally, the presence of complex solvent-solute interface in the PBNP equations attributes to challenges in constructing high order numerical methods. In particular, the possible presence of geometric singularity in protein molecular surfaces33 makes it difficult to implement interface jump conditions 18. Moreover, discontinuous coefficients shown in Eq. 9 lead to slow convergence in commonly used numerical discretization methods. Finally, the singular charges represented by the Dirac delta functions 8 also cause slow convergence in numerical simulation.
Since Eqs. 20, 21 are coupled together, Φ and nα need to be solved iteratively. Here two different approaches are discussed and compared based on different implementation of the nonlinear PB equation. For the sake of simplicity, we assume NNP = NB = 1 in this section, while actual algorithms are easily extended to a system with more ion species (i.e., NNP > 1 or NB > 1). Given NNP = NB = 1, define ψ = (Φ)/(kBT) and γ = (4π)/(kBT), Uα = (μα)/(kBT), then Eqs. 20, 21 take the following simpler forms:
| (23) |
and
| (24) |
We present a linear algorithm and a nonlinear algorithm for Eqs. 23, 24.
Linear algorithm
Equation 23 itself is a nonlinear equation of Φ(r); however in terms of implementation, it can be implemented by solving a linear equation as shown below.
Iterative procedure
The iteration loop for the linear implementation starts from an initial guess of ψ(0) and , then is obtained by solving
| (25) |
And ψ(1) can be obtained by
| (26) |
where the superscripts of ψ and n1 indicate the iteration step. To ensure the convergence, the Gummel scheme28, 29 widely used in the PNP system is applied for updating ψ at the jth iteration step (j = 1, 2, …), that is,
| (27) |
where
| (28) |
Thus in Gummel iteration, Eqs. 25, 27 are solved iteratively. Meanwhile n2 is actually updated accordingly. Therefore, the overall iteration starts from an initial guess, followed by solving the linear equations 25, 27, where an additional term is applied to ensure the convergence, and further followed by another iteration. The stopping criteria is that
Two related computational issues are discussed here for the implementation of this algorithm. First issue is how to treat the fixed charge term ρf which contains the singular source term in the Poisson equation and how to solve the resulting Poisson equation. The other issue is how to find U2 in each iteration step.
Dirichlet to Neumann mapping
To remove the Dirac delta functions describing partial charge sources in ρf, the Green's function formulation technique is employed.19, 34 Split ψ into the regular part and the singular part , i.e., , where is defined only in Ωm.19, 35 Define , here ψ*(r) is the Green's function which can be given analytically
To compensate the values induced by the Green's function ψ* on the interface Γ, ψ0(r) satisfies the following Laplace equation with a Dirichlet boundary condition:
| (29) |
This decomposition of ψ gives rise to a Poisson equation for without the singular term,
| (30) |
Due to the introduction of the new Neumann interface condition in Eq. 30, this method is also called Dirichlet to Neumann mapping.
Note that after the decomposition, depends on the geometry of the computational domain and fixed protein charge information and is independent of the concentration. Therefore, needs to be solved only once. In contrast, is coupled to the ion concentrations, therefore is to be solved in each iteration step.
Matched interface and boundary method
The discretization of Eq. 30 requires the enforcement of interface jump conditions 18 in a very careful manner and taking care of discontinuous coefficients 9 to ensure the second order accuracy for arbitrarily complex molecular surfaces. In this work, we utilize the matched interface and boundary method25, 26, 27, 36, 37, 38 for the discretization of Eq. 30. The main idea of the MIB method is that to maintain the designed order of accuracy, the finite difference schemes for regular points (away from the interface) and irregular points (near the interface) are different. As illustrated in Fig. 1, on the mesh line where j and k values are fixed, points (i − 2, j, k), (i − 1, j, k), and (i + 2, j, k) are all regular points, while (i, j, k) and (i + 1, j, k) are irregular points. For the discretization along x direction at point (i − 1, j, k), we use the standard finite difference scheme,
| (31) |
where Δx is the mesh size on the x direction. However, for the point (i, j, k), since point (i + 1, j, k) lies on a different subdomain, and the solution might not be smooth across the interface, a fictitious value is utilized for the discretization
| (32) |
where fi + 1, j, k is the fictitious value defined at point (i + 1, j, k) and the value is interpolated by using the interface jump conditions shown in Eq. 30. This is nontrivial for complex biomolecules since the discretization of the jump conditions is defined on the interface, and in most cases the interface points are off grid. The discretizations from both sides of the interface are required for the enforcement of the jump conditions, which needs many auxiliary points. The details of the technique are referred to the related work on the MIB method.25, 26, 36, 37, 38 Essentially, the MIB method makes use of simple Cartesian grids, standard finite difference schemes, lower order physical jump conditions and the idea of fictitious values defined on irregular points close to the interface. While the physical jump conditions are enforced at each intersecting point of the interface and the mesh lines, the MIB method takes care of the interface condition in a systematic way. It is the only known method that is able to achieve the second order accuracy for solving the PB equation with realistic molecular surfaces of proteins and associate singular charges to our knowledge.
Figure 1.
A 1D illustration of the regular points and irregular points near the interface point (o, j, k). The green line shows the interface, black dots are regular points while red dots are irregular points.
Algebraic equation solver
Here, solution of the formed linear algebraic system is credited to “the portable, extensible toolkit for scientific computation” (PETSc), see the webpage “http:∕/www.mcs.anl.gov∕petsc∕petsc-as∕” for detail. It is a suite of data structures and routines for the scalable (parallel) solution of scientific applications modeled by partial differential equations.
Electrochemical potential
Another issue here is how to find U2 in each iteration step. As stated before, for the ions of no interest, we use the estimation in the Boltzmann distribution based on the information obtained from solving the concentration of the target ion species. For example, after is solved from Eq. 25, can be obtained based on Eq. 1, that is, , assuming that , where a, E12 are constants taking account the different chemical property of different ions. Here can be used in Eq. 33.
Nonlinear algorithm
As mentioned earlier, Eq. 23 itself is a nonlinear equation of Φ(r). The iteration loop still starts from an initial guess of ψ(0) and . Then is obtained by solving Eq. 25. However, the difference is that ψ(1) is obtained by solving
| (33) |
Similarly the singular term ρf is removed by the above mentioned Dirichlet to Neumann technique and the discretization is also done by using the MIB method. Note that the resulting discretized system is nonlinear in terms of ψ and the convergence of the algebraic equations can be a problem. Here, solution of the formed nonlinear system is credited to (PETSc). For PETSc options, the scalable nonlinear equations solvers component provides an easy-to-use interface to Newton-based methods for solving systems of nonlinear equations.
Nonlinear algorithm versus linear algorithm
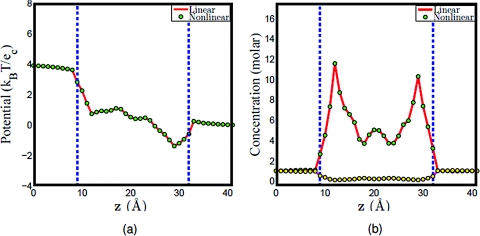
Basically, the implementation procedure is quite similar between the nonlinear algorithm and linear algorithm; while the only difference is how to treat the nonlinear Poisson–Boltzmann equation during the iteration process. Theoretically, both ways should converge to the same results if the uniqueness of the solution exists, and through the numerical verification, the potential and concentration profiles are exactly the same for two algorithms as shown in Fig. 2 for Gramicidin A (see Sec. 4A for implementation detail). However, it takes much longer CPU time to solve the nonlinear system compared to the linear one. For example, for one given boundary condition, it takes 1147 s for the nonlinear algorithm while only 267 s for the linear algorithm in solving the same equations. Therefore, while both algorithms can be utilized to get the solution, the linear algorithm is preferred for the computational efficiency. The computations in the rest of this paper are carried out by using the linear algorithm implementation.
Figure 2.
Comparison of the linear algorithm and the nonlinear algorithm. The enclosed region between the dashed lines is the channel region. (a) Potential profiles, (b) concentration profiles, the solid lines (red and magenta) represent the concentration of Na + and Cl − in PNP computation, while the dots (green and yellow) represent the concentration of Na + and Cl − in PBNP computation.
TEST AND VALIDATION
In this section, we examine the performance of the proposed PBNP system and validate the computational algorithms discussed in the earlier sections. First, we consider a situation there is no external electrical field. In such a case, we need to establish the equivalence between the PB model and the PNP model for electrostatic potential profiles. Meanwhile, we also need to examine the equivalence of ionic concentration distributions predicted by PB and PNP models. Our main task is to confirm the performance of the proposed PBNP system under the presence of external electric field across the membrane protein.
Two proteins are used for our tests. One protein is a heme-binding protein, cytochrome c551 (PDB ID: 451c), from the organism Pseudomonas aeruginosa. This protein binds one heme group per molecule and biologically functions as an electron donor for cytochrome cd1 in nitrite and nitrate respiration. The second example is an ion channel, Gramicidin A (PDB ID: 1mag). The GA is a widely used biomolecule for many ion channel models.9, 17 Experimental measurements are available in terms of current–voltage (I–V) curves under various concentrations and lipid bilayer polarization environments.39 Therefore, this is a good benchmark test for the proposed PBNP model.
Chemical diffusion in biomolecular systems
To demonstrate the validity of the proposed model and efficiency of numerical algorithms, the computation is first carried out given that no external voltage is applied to the system. As discussed in Sec. 2, both PBNP and PNP models would be equivalent to the PB model when there is no external electrical field. Note that the nonlinear Boltzmann factor in the PB model reduces to the normal one without the electrochemical potential
| (34) |
where all quantities are defined in early sections. Therefore, the numerical results should agree with each other if the computations are carried out in an appropriate manner.
Cytochrome c551
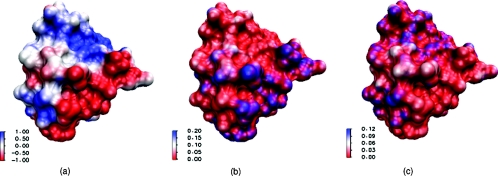
Our first test example is the protein structure of cytochrome c551 (PDB: 451c). The structure preparation is done according to the following procedure. First, the molecular surface of the protein is generated by the MSMS program (a fast molecular surface calculation library, the webpage is “http:∕/mgltools.scripps.edu∕packages∕MSMS∕”.)33 with density 10 and probe radius 1.4 Å. All the atomic van der Waals radii are adopted from the CHARMM22 force field.40 The partial charges for each atom in the protein are obtained by using the PDB2PQR software46, 47 and are accounted in ψ*. The solvent environment is represented by the dielectric continuum bulk environment, and the computational domain is a box which contains the protein. Assume that there are monovalent positive and negative ions in the solvent, then the computation is done by using both the PB model and the PNP model. It turns out that the computational results are very close to each other. Figure 3 shows the computational results illustrated on the surface of the protein. From the color indication, basically the concentration of the negative ions follow the same pattern as the potential profile while the concentration of the positive ions shows the opposite pattern.
Figure 3.
Illustrations of computational results on the molecular surface of protein 451c. (a) Electrostatic potential profile; (b) concentration of positive ions; (c) concentration of negative ions. The unit of electrostatic potential is kBT/ec, and the unit of concentration is molar, here the blue color shows larger values while red color shows smaller values.
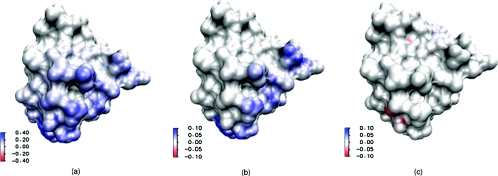
It is interesting to check the differences between results predicted by PB and PNP models. We map these differences on the molecular surface of protein c551. The surface plot of differences is very sensitive and depends not only on theoretical models, but also on the numerical procedure.19, 41 Figure 4 illustrates the differences in electrostatic potentials, positive ion concentrations, and negative ion concentrations. Clearly, the differences of results calculated from two models are relatively small in most regions. Therefore, when there is no external electric field, PB and PNP models offer consistent results on electrostatic potential and ion concentration.
Figure 4.
The differences between results predicted by PB and PNP models mapped on the surface of protein 451c. (a) Difference of electrostatic potential profiles; (b) difference of positive ion concentrations; and (c) difference of negative ion concentrations.
Gramicidin A
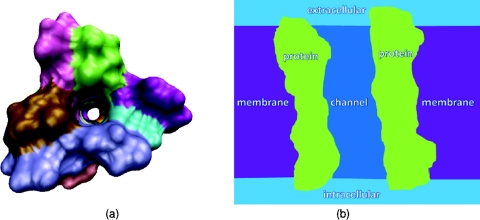
Our second test concerns Gramicidin A ion channel (PDB: 1mag) as shown in Fig. 5a. The GA is one of the most popular ion channel models in the literature. A wide variety of theoretical models have been applied to the GA channel because of its relatively small number of atoms and the availability of experimental data in the literature.9, 17, 39, 42 The computational domain of the GA channel incorporates four different regions, i.e., the channel region, bulk ion region, protein region, and the membrane layers, see Fig. 5b. As stated in the literature, it is known that the GA channel pore region is along the z direction.17, 42 Therefore, to locate channel grid points in the solvent, the surface is sliced along z direction. For each slice, the solvent region enclosed by the biomolecule is the channel pore region, and the solvent region outside the biomolecule is the bulk ion region. After all the channel pore points are located, the membrane layers are added to the geometry. Here a slab with no charge and a total length of 24 Å along the z direction is used for the representation of implicit membrane layers. In general, the position of membrane layers has little impact to the channel transport property because no charge is assigned to the membrane in the present work. On the other hand, it would be very important to precisely define the membrane position had the membrane been doped with charges, which can be easily done. Figure 6 illustrates the electrostatic potential and concentration profiles (which are averaged on each x–y plane for given z value) along the z direction. It is seen that the computational results for PB and PNP models are essentially the same when the external voltage is set to zero. This agreement also validates our computational algorithms discussed in Sec. 3.
Figure 5.
Illustrations of ion channel protein and computational setup of the channel system. (a) Illustrations of ion channel geometry from the top view, where the hole in the middle is the channel region formed by the protein; (b) Illustrations of the computational setup for the membrane protein environment from the side view, where the light blue color shows the extracellular and intracellular bulk regions, the light green color shows the channel protein, the purple color shows the membrane region, and the dark blue color shows the channel region where ions exchange between extracellular and intracellular environment.
Figure 6.
Computational results for PB and PNP models. (a) Electrostatic potential profile along z direction; (b) concentration profile along z direction.
Ion transport over transmembrane channel
In this subsection, we consider the present PBNP model under the presence of the external electric field in the GA channel. The GA channel is selective to monovalent positive ions such as sodium and potassium where reject negative ions such as chlorine. However, in the extracellular and intracellular environment, there could be many ion species. Here, the computational setup of the GA channel is the same as that shown in Fig. 5b, while the ion concentrations of different species are included in the description of the PBNP model. Two electrodes are located on the top and bottom boundaries of the GA channel, respectively. The ion transport path (the pore region) is along z direction where electrical voltage applies. For the boundary condition in the channel, defining z ∈ [zbottom, ztop], then the concentration and potential values at zbottom and ztop are given. For the rest of the computational boundary, the Neumann boundary condition is employed for the potential and the Dirichlet boundary condition is employed for the concentration. Note that actually the Neumann boundary condition ((∂Φ)∕(∂n)=0) can be replaced by assigning the protein with fixed charges at the boundary, i.e., the Dirichlet boundary condition. For the diffusion coefficient, the value in the bulk region can be obtained from the experimental measurement; however, there are very limited experimental data available for the diffusion coefficients in the channel pore region. For experimental measurements in other field, such as magnetic resonance imaging, it is generally known that diffusion coefficients are much smaller in confined systems, such as microchannels and nanopores, than those in the bulk regions. Computationally, here we introduce buffering regions between the bulk and channel regions, where the diffusion coefficient is interpolated by the value between the bulk and channel regions. The diffusion coefficient function is defined as follows:
| (35) |
where the function f(r) is given by
| (36) |
where n is an integer, n ⩾ 2 and z ∈ [zchannel, zbulk]. Here we assume that the channel structure lies along the z direction, and similar profiles can be constructed for other transport direction as well. This construction is a generalization of the diffusion profile mentioned by Hwang et al.7 And the bulk diffusion coefficients in this work are taken from Table 10.1 in the literature,4 given the temperature is 25°C.
We are interested in examining the consistence between the PBNP model and the PNP model for the prediction of electrostatic potential, ion concentration profiles, and I–V curves. Two systems are employed to demonstrate our PBNP model. The first system consists of two ion species, K+ and Cl−, or Na+ and Cl−. The other system includes three ion species, K+, Na+, and Cl−. In our calculations, the concentrations of one or two ion species are represented by the Boltzmann distributions. We then compare predictions of two models.
Ion channel transport with two ion species
Assuming that there are two different ion species in the system, we consider two different combinations, a K+– Cl− pair and a Na+– Cl− pair. Both the PNP model and the PBNP model are employed for these systems.
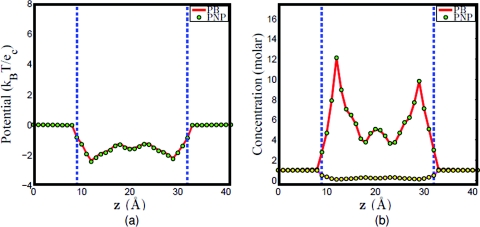
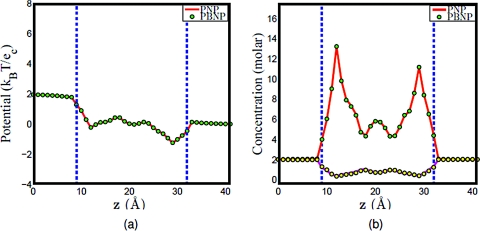
a. K+and Cl−system. Assuming that K+ and Cl− are the ion species in the computational system. For the original PNP model, the concentrations of K+ and Cl − are both governed by the Nernst–Planck equation ( and , , and ). For the PBNP model, we assume that the concentration of K+ is governed by the Nernst–Planck equation (use the same diffusion profile as in the PNP computation), while the concentration of Cl − is represented by the Boltzmann distribution as shown in Eq. 20. Assume that U1 is the electrochemical potential of K+ and U2 is the electrochemical potential of Cl −. As stated in the construction of the PBNP model, U1 can be obtained once the concentration of K+ is solved by the Nernst–Planck equation, and since the dominant contribution here is the electrostatics, then by approximation, U2 is estimated by −U1. To see the feasibility of this estimation, the PBNP model is solved self-consistently to obtain the electrostatic potential and concentration profiles, and then compared to the computational results of the original PNP model. Figure 7 shows the computational results of these two models given the electrical voltage of 50 mV and the bulk concentration of 2 M; whereas Fig. 8 shows the computational results of these two models given the electrical voltage of 200 mV and the bulk concentration of 2 M. Obviously, there are excellent agreements between the results obtained by the PNP model and those of the PBNP model under the same boundary and geometry setup. In fact, the agreement is even better when the applied electrical voltage is smaller.
Figure 7.
Comparison of PNP and PBNP models with V0=50 mV and n0=2 M in the KCl mixture. (a) Electrostatic potential profiles; (b) concentration profiles, the solid lines (red and magenta) represent the concentration of K+ and Cl − in PNP computation, while the dots (green and yellow) represent the concentration of K+ and Cl − in PBNP computation.
Figure 8.
Comparison of PNP and PBNP models with V0=200 mV and n0=2 M in the KCl mixture. (a) Electrostatic potential profiles; (b) concentration profiles.
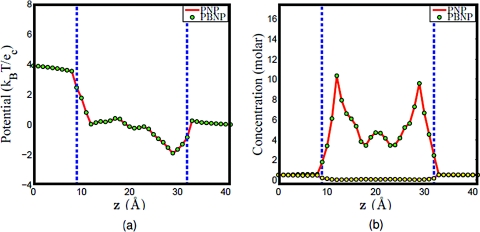
b. Na+and Cl−system. Similarly, we assume that Na + and Cl − are the ion species in the system. In our PBNP model, we assume that the concentration of Na + follows the Nernst-Planck equation ( and ), while the concentration of Cl − is represented by the Boltzmann distribution as shown in Eq. 20. We denote U1 as the electrochemical potential of Na + and U2 as the electrochemical potential of Cl −. Similar to the last case, U1 is obtained once the concentration of Na + is solved by the Nernst–Planck equation. We estimate U2 by setting U2 = −U1. Again, the computational results of the PBNP model are compared with those of the original PNP model, in which the concentration of Na + and Cl − are both governed by the Nernst–Planck equation. We illustrate our comparison in Fig. 9, where the given electrical voltage is 100 mV and the bulk concentration is 0.5 M. Once again, we see an excellent agreement between the results of the PNP model and those of the PBNP model under the same boundary and geometry setup.
Figure 9.
Comparison of PNP and PBNP models with V0=100 mV and n0=0.5 M in the NaCl mixture. (a) Electrostatic potential profiles; (b) concentration profiles.
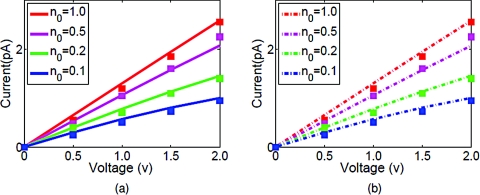
To further validate the proposed PBNP model, we consider the I–V curves predicted by two models under a number of external field strengths and bulk ion concentrations. This is a much more meaningful test because our PBNP model can be compared directly with experimental measurements.39 We evaluate electric current across the GA channel by the expression17
| (37) |
The current is evaluated at each cross section inside the pore and it is found that the value is not sensitive to the location of the cross section. The current through the middle of the pore is shown in the present work. Figure 10 depicts the I–V curves computed for the GA channel using these two different models. Our results indicate that the proposed PBNP model is able to provide the full scale prediction of ion channel transport. Particularly, the comparison with experimental I–V plots for GA channel from Busath et al.39 confirms the usefulness and validity of the present PBNP model.
Figure 10.
I–V curves for NaCl. (a) The solid lines represent the PNP computational results and the squares represent experimental data;39 (b) The dashed lines represent the PBNP computational results and the squares represent experimental data.39
Ion channel transport with three ion species
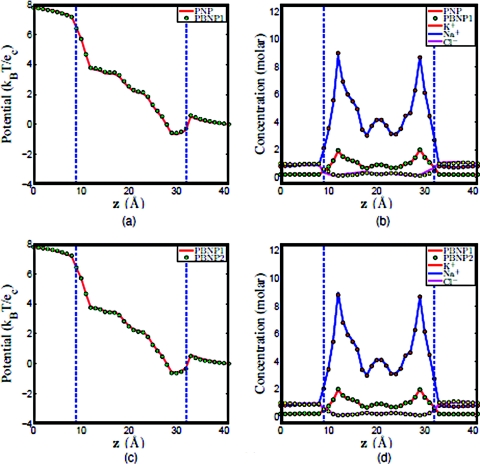
One of our motivations in proposing the PBNP model is to reduce the number of Nernst–Planck equations needed for systems with multiple ion species. In this subsection, we test the ability and the performance of the proposed PBNP model. The computational setup of the GA channel is shown in Fig. 5b, which is the same as that used in the above calculations. However, in the present calculation, we assume that there are three different ion species, namely, K+, Na +, and Cl − in the system. For the implementation of the PBNP model in the present case, two different treatments are considered. In our first treatment (called PBNP1), we assume the concentrations of K+ and Na + are still governed by the Nernst–Planck equation, while the concentration of Cl − is represented by the Boltzmann distribution as shown in Eq. 20. Therefore, n1 and n2 are both explicitly solved while n3 is estimated in the same manner as described in Sec. 3. In our second treatment (called PBNP2), we assume the concentration of one positive ion species follows the Nernst–Planck equation, while the rest are represented by the Boltzmann distribution as shown in Eq. 20. Therefore, μK+ can be obtained after nK+ is computed, and U2 and U3 are approximated by using U1. Here, since Na + carries same charge as K+, in the bulk region, we assume U2 = U1 and for the channel region a smaller value is given to differentiate two species, i.e., U2 = U1 + 0.1kBT. One reason is that this provides a good match to the PNP computation given that K+: Na +=1:1. For other ratios of the mixture, we use the same constants for the estimation. For U3, it still takes the opposite sign compared to U1, i.e., U3 = −U1. As a comparison, we carry out similar computations with the original PNP model, in which the concentrations of Na +, K+, and Cl − are all governed by the Nernst–Planck model, and the corresponding concentrations n1, n2, and n3 are all solved from the Nernst–Planck equation.
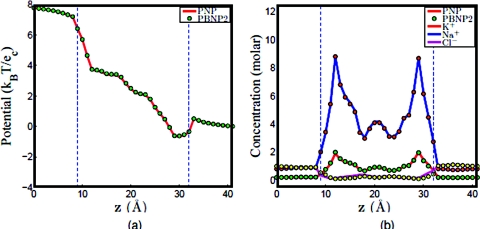
First, we check the consistence among the original PNP model, the PBNP1 model, and the PBNP2 model. Figure 11 shows the computational results obtained by PNP, PBNP1, and PBNP2 models. Clearly, there is little deviation between the results obtained by PNP and PBNP1 models as shown in Figs. 11a, 11b. We further examine the consistence between the PBNP1 and PBNP2 models in Figs. 11c, 11d. Obviously, there is no visible deviation in these two PBNP models, although two ion species are approximated by the Boltzmann distribution in the PBNP2 model.
Figure 11.
Comparison of PNP, PBNP1, and PBNP2 models with V0=200 mV , n0=1.0 M, and K+:Na+ = 2:8. (a) Electrostatic potential profiles computed from PNP and PBNP1; (b) Concentration profiles computed from PNP and PBNP1; (c) electrostatic potential profiles computed from PBNP1 and PBNP2; (d) concentration profiles computed from PBNP1 and PBNP2.
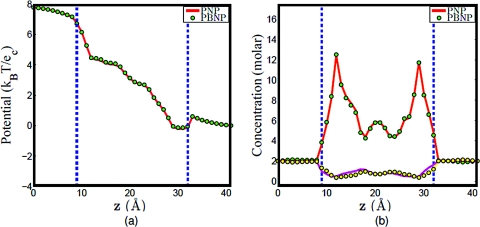
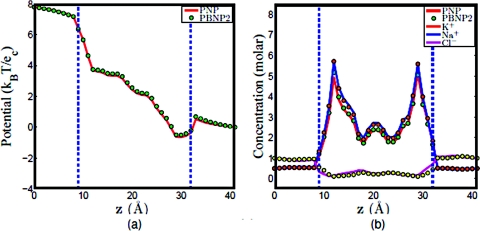
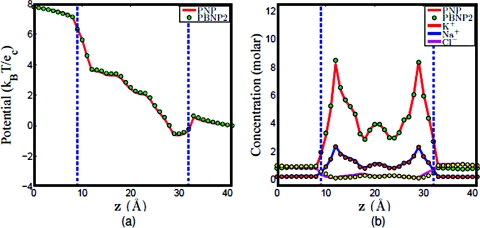
Since two ion species are represented by the PBNP2 model, it is interesting to understand how the ratio of KCl and NaCl concentrations will affect the performance of the PBNP2 model. To this end, we consider three cases in which the concentration ratios of K+: Na + are set to 1:1, 8:2, and 2:8, respectively. The results obtained by using the PNP model and PBNP2 model are depicted in Figs. 121314. The electrostatic potentials computed by these two models are almost identical in all cases. This is good indication that the proposed PBNP2 works well for ion mixtures. When the bulk concentration of Na+ is the same as that of K+, it is interesting to note that the concentration profile of Na+ is slightly higher than that of K+ in the ion channel as illustrated in Fig. 12b. This difference is caused by the difference in their diffusion coefficients. In the next two cases where the concentration ratios of K+: Na + are, respectively, 8:2 and 2:8, we use the Nernst–Planck equation to represent ion with higher bulk concentration. The results plotted in Figs. 1314 show an excellent agreement between the PBNP model and the original PNP model.
Figure 12.
Comparison of PNP and PBNP2 models with V0=200 mV , n0=1.0 M, and K+:Na+ = 1:1. (a) Electrostatic potential profiles; (b) concentration profiles.
Figure 13.
Comparison of PNP and PBNP2 models with V0=200 mV , n0=1.0 M, and K+:Na+ = 8:2. (a) Electrostatic potential profiles and (b) concentration profiles.
Figure 14.
Comparison of PNP and PBNP2 models with V0=200 mV , n0=1.0 M and K+:Na+ = 8:2. (a) Electrostatic potential profiles; (b) concentration profiles.
Finally, we examine the current values obtained in these three cases. Table 1 lists the results obtained from the PNP model and the present PBNP models under three concentration ratios. Apparently, for a given total positive ion concentration, the higher molar fraction of K+, the larger current is, due to the impact of diffusion coefficients. However, in all calculations, there are very good agreements among three models.
Table 1.
Current values of PNP, PBNP1, and PBNP2 models with different mix ratios
| K+: Na + | PNP | PBNP1 | PBNP2 |
|---|---|---|---|
| 2:8 | 3.68 | 3.71 | 3.73 |
| 1:1 | 5.41 | 5.43 | 5.49 |
| 8:2 | 7.24 | 7.25 | 7.23 |
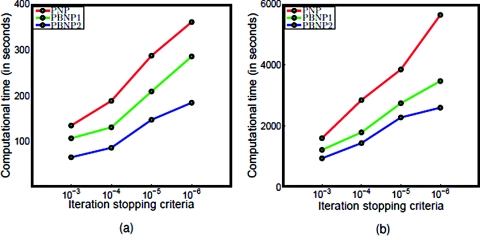
Furthermore, as fewer equations are solved in the PBNP models, less CPU time is expected for these models. To examine the computational efficiency, the above mentioned models are employed at the same initial and boundary conditions, the computational time for the uniform grid with the mesh sizes of 1.0 and 0.5 Å are reported in Table 2 under different stopping criteria and illustrated in Fig. 15. The computational time may vary due to the available resource in the shared research computers, however, a basic time saving pattern can be observed from the figure due to the reduction in the number of governing equations. Specifically, for the PNP model, four 3D equations, one for the electrostatic potential and three for the concentrations, are solved in each iteration, while only three 3D equations are solved for the PBNP1 model, and only two 3D equations are solved for the PBNP2 model in each iteration, which results in the better computational efficiency.
Table 2.
Computational time of PNP, PBNP1, and PBNP2 models with different mesh sizes and iteration stopping criteria (ISC)
| Mesh size = 1.0 Å |
Mesh size = 0.5 Å |
|||||||
|---|---|---|---|---|---|---|---|---|
| ISC | ||||||||
| Method | 10−3 | 10−4 | 10−5 | 10−6 | 10−3 | 10−4 | 10−5 | 10−6 |
| PNP | 134 | 188 | 287 | 361 | 1602 | 2852 | 3856 | 5646 |
| PBNP1 | 107 | 131 | 209 | 286 | 1219 | 1793 | 2748 | 3474 |
| PBNP2 | 65 | 86 | 147 | 184 | 942 | 1441 | 2282 | 2603 |
Figure 15.
Computational time of PNP, PBNP1, and PBNP2 models with different mesh sizes. (a) Mesh size = 1.0 Å; (b) mesh size = 0.5 Å.
CONCLUDING REMARKS
The Poisson–Nernst–Planck model is a well-established electrodiffusion model for a wide variety of applications in chemistry, physics, nanoscience, and biology. However, the PNP model has limited validity due to its mean-field approximation and its nature of continuum approximation. Additionally, the PNP model may become cumbersome when applied to a system of multiple ion species. Computationally, it can be a burden to solve one 3D Nernst–Planck equation for each ion species in the system, regardless whether it is the ion of interest or not. Moreover, the PNP model requires the diffusion coefficients for all ion species. In general, diffusion coefficients are position dependent functions and are very sensitive to the biological environment. Unfortunately, there are very limited experimental data of diffusion coefficients available for biomolecular systems, such as ion channels, nanopores, and microchannels. For these reasons, it is desirable to solve as fewer number of Nernst–Planck equations as possible, while maintaining the accuracy of the PNP prediction in many realistic applications.
We propose a simplified model to address this need. We use the Boltzmann distribution to represent the 3D ion concentration profile for certain ion species so as to avoid solving the Nernst–Planck equation for all the ion species. In our case, the Boltzmann distribution in terms of the electrochemical potential, instead of the electrostatic potential, is required due to the presence of external voltages. As a result, we obtain coupled Poisson–Boltzmann–Nernst–Planck equations from the variational principle. The proposed PBNP model can be used for the prediction of ion transport of membrane proteins subject to applied external electric fields. This model is further reduced to the Poisson–Boltzmann equation when the external voltage is absent. In fact, the equivalence between the PNP model and the PB model in the absence of external voltage is well known.8
To implement the proposed PBNP model in an efficient manner, we design a number of computational techniques. First, we make use of a Dirichlet to Neumann mapping technique in which one splits the solution of the PB equation into a regular part and a singular part so that the singular part can be solved analytically by the Green's function.19 The resulting regular part is solved numerically, subject to a Neumann boundary condition. Additionally, we solve regular part of the PB equation by using the matched interface and boundary technique which achieves the second order accuracy for realistic molecular surfaces of proteins.25, 26, 36, 37, 38 The MIB technique is also employed to solve the Nernst–Planck equation in the present work subject to nonflux boundary condition. Finally, the coupled PNP equations or PBNP equations are solved by iterative procedures. Both linear and nonlinear schemes are proposed in solving the PB equation. Appropriate iteration schemes are used to ensure the convergence of the iterations.
Two proteins, cytochrome c551 and Gramicidin A, are utilized to validate the proposed PBNP model and to demonstrate its usefulness. The heme-binding protein, cytochrome c551, is immersed in a salt solvent to study the electrostatic potential profile on the protein surface and the distribution of ion concentrations induced by the electrostatic field. This is normally done with the PNP model. In the present work, we show that the Boltzmann distribution obtained from the PB model delivers essentially the same result as that obtained by using the PNP model. The Gramicidin A is a transmembrane channel and has been widely used to test various theoretical models for ion channel transport subject to external electric fields. We consider the situations there are two and three ion species in the system. The goal is to examine the electrostatic potentials, ion concentration profiles, and current–voltage (I–V) curves under various bulk concentrations and subject to a wide range of external voltages. In the case of two ion species, we show that the concentration of one of the two species can be represented by the Boltzmann distribution and the results predicted by using the present PBNP model are essentially the same as those obtained from the PNP model. In the case of three ion species, we design two different settings. In the first setting called PBNP1, the Boltzmann distribution of an ion concentration is used to substitute one Nernst–Planck equation. We show that there is an excellent consistence between the PNP model and PBNP1 model in terms of electrostatic potentials, ion concentration profiles and I–V curves. It is interesting to note that the validity of our I–V curves has also been confirmed by experimental data. In our second setting called PBNP2, we use two Boltzmann distributions to replace two Nernst–Planck equations. Again, excellent consistence between the PNP model and PBNP2 model is found in terms of electrostatic potentials, ion concentration profiles and current values. The CPU costs of the PNP and the proposed PBNP models are compared over two different mesh sizes and a number of iteration stopping criteria. The present PBNP model is much more efficient than the PNP model.
We expect that the present PBNP model will play an important role in other chemical, physical, and biological systems. One possible application is nanoelectronic devices where electrons, holes, and other charge carriers are typically modeled by the PNP model or the Poisson–Schrödinger equation.43 Another example is microfluidic and nanofluidic systems and electro-osmotic flows in microchannels and nanochannels.22, 23 Other possible applications are to model multiple charged ions or charged molecules in the direct seawater desalination44 or molecular sieving (i.e., electrostatic seiving).45
It is noted that the proposed PBNP model inherits limitations from the PB model and PNP model. Therefore, all previous modifications which are aimed to improve the PB and PNP models can be similarly applied to the present PBNP model.18 This aspect is under our investigation.
ACKNOWLEDGMENTS
This work was supported in part by NSF Grant No. CCF-0936830, NIH Grant No. R01GM-090208, and MSU Competitive Discretionary Funding Program Grant No. 91-4600. The authors thank Duan Chen for useful discussion.
References
- Gillespie D., Nonner W., and Eisenberg R. S., J. Phys.: Condens. Matter 14(46), 12129 (2002). 10.1088/0953-8984/14/46/317 [DOI] [Google Scholar]
- Ball F. G. and Rice J. A., Math. Biosci. 112(2), 189 (1992). 10.1016/0025-5564(92)90023-P [DOI] [PubMed] [Google Scholar]
- Eisenman G. and Dani J. A., Ann. Rev. Biophys. Biophys. Chem. 16, 205 (1987). 10.1146/annurev.bb.16.060187.001225 [DOI] [PubMed] [Google Scholar]
- Hille B., Ionic Channels of Excitable Membranes (Sinauer Associates, Sunderland, MA, 1992). [Google Scholar]
- Tieleman D. P., Biggin P. C., Smith G. R., and Sansom M. S. P., Q. Rev. Biophys. 34(04), 473 (2001). 10.1017/S0033583501003729 [DOI] [PubMed] [Google Scholar]
- Chung S.-H. and Kuyucak S., Biochim. Biophys. Acta 1565, 267 (2002). 10.1016/S0005-2736(02)00574-6 [DOI] [PubMed] [Google Scholar]
- Hwang H., Schatz G. C., and Ratner M. A., J. Phys. Chem. A 111(49), 12506 (2007). 10.1021/jp075838o [DOI] [PubMed] [Google Scholar]
- Roux B., Allen T., Bernèche S., and Im W., Q. Rev. Biophys. 37, 15 (2004). 10.1017/S0033583504003968 [DOI] [PubMed] [Google Scholar]
- Chen D. and Wei G. W., “Quantum dynamics in continuum for proton channel transport I: Basic formulation,” J. Chem. Phys. (submitted). [DOI] [PMC free article] [PubMed]
- Levitt D. G., Annu. Rev. Biophys. Biophys. Chem. 15, 29 (1986). 10.1146/annurev.bb.15.060186.000333 [DOI] [PubMed] [Google Scholar]
- Levitt D. G., J. Gen. Physiol. 113(6), 789 (1999). 10.1085/jgp.113.6.789 [DOI] [PMC free article] [PubMed] [Google Scholar]
- Kuyucak S., Andersen O. S., and Chung S.-H., Rep. Prog. Phys. 64, 1427 (2001). 10.1088/0034-4885/64/11/202 [DOI] [Google Scholar]
- Jung Y. W., Lu B. Z., and Mascagni M., J. Chem. Phys. 131(21), 215101 (2009). 10.1063/1.3268774 [DOI] [PubMed] [Google Scholar]
- Kilic M. S., Bazant M. Z., and Ajdari A., Phys. Rev. E 75, 021502 (2007). 10.1103/PhysRevE.75.021502 [DOI] [PubMed] [Google Scholar]
- Corry B., Kuyucak S., and Chung S.-H., Biophys. J. 84, 3594 (2003). 10.1016/S0006-3495(03)75091-7 [DOI] [PMC free article] [PubMed] [Google Scholar]
- Kilic M. S., Bazant M. Z., and Ajdari A., Phys. Rev. E 75, 021503 (2007). 10.1103/PhysRevE.75.021503 [DOI] [PubMed] [Google Scholar]
- Zheng Q., Chen D., and Wei G. W., “Second-order Poisson–Nernst–Planck solver for ion transport,” J. Comput. Phys. (in press). 10.1016/j.jcp.2011.03.020 [DOI] [PMC free article] [PubMed]
- Wei G. W., Bull. Math. Biol. 72, 1562 (2010). 10.1007/s11538-010-9511-x [DOI] [PMC free article] [PubMed] [Google Scholar]
- Geng W., Yu S., and Wei G. W., J. Chem. Phys. 127, 114106 (2007). 10.1063/1.2768064 [DOI] [PubMed] [Google Scholar]
- Chen Z., Baker N. A., and Wei G. W., J. Comput. Phys. 229, 8231 (2010). 10.1016/j.jcp.2010.06.036 [DOI] [PMC free article] [PubMed] [Google Scholar]
- Chen Z., Baker N. A., and Wei G. W., “Differential geometry based solvation models II: Lagrangian formulation,” J. Math. Biol. (2011). 10.1007/s00285-011-0402-z [DOI] [PMC free article] [PubMed]
- Park H. M., Lee J. S., and Kim T. W., J. Colloid Interface Sci. 315(2), 731 (2007). 10.1016/j.jcis.2007.07.007 [DOI] [PubMed] [Google Scholar]
- Park H. M. and Choi Y. J., Int. J. Heat Mass Transfer 52(19–20), 4279 (2009). 10.1016/j.ijheatmasstransfer.2009.04.022 [DOI] [PMC free article] [PubMed] [Google Scholar]
- Li B., Lu B. Z., Wang Z. M., and McCammon J. A., Physica A 389(7), 1329 (2010). 10.1016/j.physa.2009.12.024 [DOI] [PMC free article] [PubMed] [Google Scholar]
- Zhou Y. C., Zhao S., Feig M., and Wei G. W., J. Comput. Phys. 213(1), 1 (2006). 10.1016/j.jcp.2005.07.022 [DOI] [Google Scholar]
- Yu S. and Wei G. W., J. Comput. Phys. 227, 602 (2007). 10.1016/j.jcp.2007.08.003 [DOI] [Google Scholar]
- Chen D., Chen Z., Chen C., Geng W. H., and Wei G. W., J. Comput. Chem. 32(4), 756 (2011). 10.1002/jcc.21646 [DOI] [PMC free article] [PubMed] [Google Scholar]
- Gummel H. K., IEEE Trans. Electron Devices 11(10), 455 (1964). 10.1109/T-ED.1964.15364 [DOI] [Google Scholar]
- Hollerbach U., Chen D. P., and Eisenberg R. S., J. Sci. Comput. 16(4), 373 (2002). 10.1023/A:1013203223798 [DOI] [Google Scholar]
- Kittel C. and Kroemer H., Thermal Physics (Macmillan, New York, 1980). [Google Scholar]
- Fogolari F. and Briggs J. M., Chem. Phys. Lett. 281, 135 (1997). 10.1016/S0009-2614(97)01193-7 [DOI] [Google Scholar]
- Sharp K. A. and Honig B., J. Phys. Chem. 94, 7684 (1990). 10.1021/j100382a068 [DOI] [Google Scholar]
- Sanner M. F., Olson A. J., and Spehner J. C., Biopolymers 38, 305 (1996). [DOI] [PubMed] [Google Scholar]
- Zhou Z., Payne P., Vasquez M., Kuhn N., and Levitt M., J. Comput. Chem. 17, 1344 (1996). [DOI] [PubMed] [Google Scholar]
- Chern I. L., Liu J. G., and Wang W. C., Methods and Applications of Analysis 10(2), 309 (2003). [Google Scholar]
- Yu S., Zhou Y., and Wei G. W., J. Comput. Phys. 224(2), 729 (2007). 10.1016/j.jcp.2006.10.030 [DOI] [Google Scholar]
- Zhao S. and Wei G. W., J. Comput. Phys. 200(1), 60 (2004). 10.1016/j.jcp.2004.03.008 [DOI] [Google Scholar]
- Zhou Y. C. and Wei G. W., J. Comput. Phys. 219(1), 228 (2006). 10.1016/j.jcp.2006.03.027 [DOI] [Google Scholar]
- Busath D. D., Thulin C. D., Hendershot R. W., Phillips L. R., Maughan P., Cole C. D., Bingham N. C., Morrison S., Baird L. C., Hendershot R. J., Cotten M., and Cross T. A., Biophys. J. 75(6), 2830 (1998). 10.1016/S0006-3495(98)77726-4 [DOI] [PMC free article] [PubMed] [Google Scholar]
- A. D.MacKerell, Jr., Bashford D., Bellott M., L.Dunbrack, Jr., Evanseck J. D., Field M. J., Fischer S., Gao J., Guo H., Ha S., Joseph-McCarthy D., Kuchnir L., Kuczera K., Lau F. T. K., Mattos C., Michnick S., Ngo T., Nguyen D. T., Prodhom B., W. E.Reiher, III, Roux B., Schlenkrich M., Smith J. C., Stote R., Straub J., Watanabe M., Wiórkiewicz-Kuczera J., Yin D., and Karplus M. , J. Phys. Chem. B 102(18), 3586 (1998). 10.1021/jp973084f [DOI] [PubMed] [Google Scholar]
- Yu S., Geng W., and Wei G. W., J. Chem. Phys. 126, 244108 (2007). 10.1063/1.2743020 [DOI] [PubMed] [Google Scholar]
- Cardenas A. E., Coalson R. D., and Kurnikova M. G., Biophys. J. 79, 80 (2000). 10.1016/S0006-3495(00)76275-8 [DOI] [PMC free article] [PubMed] [Google Scholar]
- Chen D. and Wei G. W., J. Comput. Phys. 229, 4431 (2010). 10.1016/j.jcp.2010.02.002 [DOI] [PMC free article] [PubMed] [Google Scholar]
- Kim S. J., Ko S. H., Kang K. H., and Han J., Nat. Nanotechnol. 5, 297 (2010). 10.1038/nnano.2010.34 [DOI] [PubMed] [Google Scholar]
- Han J., Fu J. P., and Schoch R. B., Lab Chip 8(1), 23 (2008). 10.1039/b714128a [DOI] [PMC free article] [PubMed] [Google Scholar]
- Dolinsky T. J., Nielsen J. E., McCammon J. A., and Baker N. A., Nucleic Acids Res. 32, W665 (2004). 10.1093/nar/gkh381 [DOI] [PMC free article] [PubMed] [Google Scholar]
- Dolinsky T. J., Czodrowski P., Li H., Nielsen J. E., Jensen J. H., Klebe G., and Baker N. A., Nucleic Acids Res. 35, W522 (2007). 10.1093/nar/gkm276 [DOI] [PMC free article] [PubMed] [Google Scholar]


