

Abstract
Childhood studies of the fat‐bone relationship are conflicting, possibly reflecting the influence of metabolic abnormalities in some but not all obese children. Bone mass was compared between prepubertal overweight children with (n = 41) and without (n = 99) prediabetes. Associations of bone mass with measures of total and central adiposity, glucose intolerance, insulin sensitivity, lipid profile, systemic inflammation, and osteocalcin also were determined. In 140 overweight children aged 7 to 11 years, an oral glucose tolerance test was used to identify those with prediabetes and for determination of glucose, 2‐hour glucose, glucose area under the curve (AUC), insulin, 2‐hour insulin, and insulin AUC. Blood samples also were assessed for lipids, C‐reactive protein, and osteocalcin. Total‐body bone mineral content (BMC), fat‐free soft tissue mass (FFST), and fat mass (FM) were measured by dual‐energy X‐ray absorptiometry (DXA). Visceral adipose tissue (VAT) and subcutaneous abdominal adipose tissue (SAAT) were assessed using MRI. Total‐body BMC was 4% lower in overweight children with prediabetes than in those without prediabetes after controlling for sex, race, height, and weight (p = .03). In the total sample, FM was positively related with BMC (β = 0.16, p = .01) after adjusting for sex, race, height, and FFST. However, VAT (β = −0.13, p = .03) and SAAT (β = −0.34, p = .02) were inversely associated with BMC after controlling for sex, race, height, FFST, FM, and SAAT or VAT. No significant associations were found between BMC and the biochemical measurements. Prepubertal overweight children with prediabetes may be at risk for poor skeletal development. In addition, it appears that greater levels of central rather than total adiposity may be deleterious for developing bone. © 2010 American Society for Bone and Mineral Research.
Keywords: TYPE 2 DIABETES, IMPAIRED GLUCOSE, OBESITY, BONE, CHILDREN
Introduction
Childhood obesity increases the risk for metabolic conditions such as hypertension, type 2 diabetes, and cardiovascular diseases.1 Now there is increasing concern that being overweight may be associated with suboptimal bone growth and development because there is mounting evidence linking childhood obesity to skeletal fractures.2, 3, 4 Inevitably, the potential for increasing adiposity to negatively affect pediatric skeletal integrity is a subject of growing interest because achieving optimal bone mass and size during growth presumably will reduce the risk of osteoporotic fractures later in life.5
Although childhood obesity is a major public health concern and risk factor for many diseases, it has been challenging to determine whether adiposity is either beneficial or detrimental to the growing skeleton. Whereas some studies report greater bone mass in overweight children compared with their healthy‐weight peers,6, 7, 8, 9 others conclude that overweight youth have decreased bone mass relative to bone size and body weight.10, 11, 12, 13 A limitation of these pediatric bone‐fat investigations is that biochemical parameters indicative of metabolic abnormalities were not reported. Comorbidities associated with adult obesity, such as type 2 diabetes, hypertension, and dyslipidemia, also occur in children and adolescents, and more important,1 the prevalence of these metabolic abnormalities is increasing alongside childhood obesity.14 Recently, it was reported that 16% of the US pediatric population have diagnosed prediabetes.15 Since animal work suggests that impaired glucose tolerance in the presence of high adiposity may negatively influence bone development,16, 17 it is possible that discrepancies in the pediatric bone‐fat studies may have been attributed to prediabetes in some of the obese subjects. In the only pediatric investigation to date of the effect of prediabetes on bone in overweight youth, Afghani and colleagues18 linked impaired glucose tolerance to lower total‐body bone mineral content (BMC). Although this finding proposes a potential concern, further work is warranted.
Another possible explanation for the inconsistent data linking childhood adiposity and bone can be attributed to the methodologic limitations when comparing bone outcomes between overweight and normal‐weight children of the same age. At any given age, a wide variation exists among children in stature, body composition, rate of growth, and timing and tempo of biologic maturation. Since overweight compared with normal‐weight children of the same age are generally further advanced in maturation, their skeletal development likewise is more advanced because of increased hormonal activity than their normal‐weight peers.
The primary objective of this study was to compare total‐body BMC between prepubertal overweight children with and without prediabetes. The study tested the hypothesis that total‐body BMC would be lower in the prepubertal overweight children with prediabetes. In addition to group comparisons, associations of total‐body BMC with measurements of total and central adiposity, glucose intolerance, insulin sensitivity, lipid profile, systemic inflammation, and osteocalcin (carboxylated and uncarboxylated) were determined in the entire cohort. Since sex, race, total mass (ie, body weight), muscle mass (ie, fat‐free soft tissue mass), and skeletal size (ie, height) are known to be independent predictors of bone outcomes in children,19, 20 these variables were considered as potential confounders in our analyses.
Methods
Participants
This study included the baseline data from 140 prepubertal overweight children (43% female, 46% black) who were part of an investigation at the Medical College of Georgia to determine the effects of aerobic exercise on cognitive function in sedentary overweight children.21 Three cohorts of children were enrolled in the study, the first from November 2003 to May 2004, the second from June to November 2004, and the third from December 2004 to May 2005. Inclusion criteria were the following: white or black/African‐American race, age 7 to 11 years, overweight [body mass index (BMI) ≥ 85th percentile for age and sex],22 and sedentary (no regular participation in an exercise program more than 1 hour per week). Children were excluded if they were taking medications or had any medical conditions that could affect growth, maturation, physical activity, nutritional status, or metabolism or were unable to provide blood samples. Only children who were prepubertal (Tanner stage I, absence of secondary sex characteristics) were selected in order to minimize the confounding effects of the pubertal transition on bone, glucose, and insulin metabolism because puberty is known to be associated with insulin resistance and hyperglycemia.23 Pubertal maturation was determined by a pediatrician based on criteria (ratings of breast/testes and pubic hair development) described by Tanner.24
Participants underwent anthropometrics, body composition scans, oral glucose tolerance tests (OGTTs), and interviews that assessed physical activity and diet. Informed consent and assent were obtained from all parents and children, respectively. All procedures were approved by the Medical College of Georgia Human Assurance Committee (Institutional Review Board).
Anthropometry
Participants were measured for height and weight in light indoor clothing after the removal of shoes. Height was measured to the nearest 0.1 cm using a wall‐mounted stadiometer (Tanita Corporation, Arlington Heights, IL, USA), and body weight was measured to the nearest 0.1 kg using an electronic scale (Cardinal Detecto, Model CN2OL, Webb City, MO, USA).
Body composition
Bone outcomes of the total body [BMC (g), bone area (cm2), and areal bone mineral density (aBMD, g/cm2)] were measured using dual‐energy X‐ray absorptiometry (DXA; QDR‐4500W, Hologic Waltham, MA, USA). Because of the limitations of aBMD in children and adolescents, total‐body BMC has been proposed as the most appropriate outcome measure of bone mass status in youth.25 Therefore, total‐body BMC was chosen as our primary bone outcome measure for bone mass status. Total‐body composition also was determined by DXA for FFST mass (kg), fat mass (kg), and percentage body fat. Anthropomorphic phantoms were scanned daily for quality assurance. In this laboratory, using a one‐way random‐effects model, single‐measure intraclass correlation coefficients (ICCs) were calculated in 219 adolescents aged 13 to 18 years. Each participant was scanned twice within a 7‐day period for BMC, bone area, aBMD, FFST mass, fat mass, and %BF (all R ≥ 0.97).
Visceral adipose tissue (VAT) and subcutaneous abdominal adipose tissue (SAAT) were measured using a 1.5‐T MRI system (General Electric Medical Systems, Milwaukee, WI, USA). Assessments of VAT and SAAT are described in detail elsewhere.26 Briefly, a series of five transverse images was acquired from the lumbar region beginning at the inferior border of the fifth lumbar vertebra and proceeding toward the head; a 2‐mm gap between images was used to prevent crosstalk. To calculate volumes for VAT and SAAT, the cross‐sectional area (cm2) from each slice was multiplied by the slice width (1 cm), and then the individual volumes (cm3) were summed. The ICCs for repeat analyses of the same scans on separate days within a 7‐day period were R ≥ 0.98 for both VAT and SAAT.
Oral glucose tolerance test (OGTT)
After an overnight fast, a 2‐hour OGTT was conducted in which the participants ingested a standard oral glucose solution (1.75 g/kg of body weight up to a maximum of 75 g) at time 0. Blood was sampled for glucose and insulin at −15, −10, −5, 0, 30, 60, 90, and 120 minutes relative to the oral glucose ingestion. Fasting glucose (mmol/L) and insulin (pmol/L) levels were determined from averaging the −15‐, −10‐, and −5‐minute blood collections, and the 120‐minute blood sample was used for the 2‐hour glucose and insulin levels. Glucose and insulin areas under the curve (AUCs) were calculated via the trapezoidal rule.27 AUCs are reported in millimoles per liter and picomoles per liter glucose and insulin, respectively. Homeostasis model assessment of insulin resistance (HOMA‐IR) was calculated by using the formula: Fasting insulin (pmol/L) × fasting glucose (mmol/L)/22.5.28
Assay of glucose, insulin, lipids, C‐reactive protein, and osteocalcin parameters
Glucose was measured in 10 µL of serum using an Ektachem DT System (Johnson and Johnson Clinical Diagnostics, Rochester, NY, USA). The mean intraassay coefficient of variation (CV) for this analysis was 0.61%, and the mean interassay CV was 1.45%. Specific insulin was assayed in duplicate 100‐µL samples with reagents obtained from Linco (St Charles, MO, USA). The mean intra‐ and interassay CVs for the insulin assay were 5% and 5.6%, respectively. Commercial quality control sera of low, medium, and high insulin concentration are included in every assay to monitor variation over time.
Between the −15‐ and 0‐minute time points, an additional 10 mL was drawn for determination of lipids, C‐reactive protein (CRP, mg/L), and osteocalcin (OCN) parameters. Triglycerides (mmol/L), total cholesterol (mmol/L), and high‐density lipoprotein cholesterol (HDL‐C; mmol/L) were measured with the Ektachem DT II System ((Johnson and Johnson Clinical Diagnostics). With this system, HDL‐C is analyzed using a two‐reagent system involving stabilization of low‐density lipoprotein, very low‐density lipoprotein, and chylomicrons using cyclodextrin and dextrin sulfate and subsequent enzymatic‐colorimetric detection of HDL‐C. Control sera of low and high substrate concentrations are analyzed within each group of samples, and values for these controls must fall within accepted ranges before samples are analyzed. The DT II System is calibrated every 6 months with reagents supplied by the manufacturer. Low‐density lipoprotein cholesterol (LDL‐C, mmol/L) was determined using the Friedewald formula.29 C‐reactive protein was measured using high‐sensitivity ELISA (ALPCO Diagnostics, Windham, NH, USA). The mean intra‐ and interassay CVs for CRP were 10% and 10.2%, respectively. Serum concentrations of uncarboxylated OCN and total OCN were analyzed using an RIA method with an antibody that recognizes both carboxylated and uncarboxylated OCN.30 Carboxylated OCN was separated from uncarboxylated OCN by adsorption on hydroxyapatite.30 The carboxylated OCN concentration was calculated as the total OCN minus the uncarboxylated OCN. The mean intra‐ and interassay CVs for total OCN, carboxylated OCN, and uncarboxylated OCN ranged from 3.7% to 8.2%.
Physical activity
Information on moderate and vigorous physical activity (PA) was collected using questions 80 and 81 from the 2001 Youth Risk Behavior Survey (YRBS), established by the Centers for Disease Control and Prevention.31 Moderate PA (days/wk) was determined by the question, “On how many of the past 7 days did you participate in PA for at least 30 minutes that did not make you sweat or breathe hard, such as fast walking, slow bicycling, skating, pushing a lawn mower, or mopping floors?” Vigorous PA (days/wk) was determined by the question, “On how many of the past 7 days did you exercise or participate in PA for at least 20 minutes that made you sweat or breathe hard, such as bicycling, fast dancing, or similar aerobic activities?” The moderate and vigorous PA variables derived from the YRBS have shown modest reliability and validity in this age group.32
Dietary intake
To assess energy (kcal/day), dietary calcium (mg/day), and vitamin D (µg/day) and the percentage of kilocalories per day from carbohydrates (%CHO), protein (%PRO), and fat (%FAT), participants and their parents completed three 24‐hour diet recalls within two weeks of the blood collection. Prior to the first 24‐hour recall, a registered dietitian gave parents training with a 24‐hour recall questionnaire and provided food models, portion booklets, and serving containers to assist in estimating serving size. A trained lab technician analyzed the diet records using the Nutrition Data System for Research, Version 2006 (Nutrition Coordinating Center, University of Minnesota, Minneapolis, MN, USA).
Statistical analysis
The sample was dichotomized into a normal‐glucose group and a prediabetes group, as defined by the American Diabetes Association Expert Committee on Diagnosis and Classification of Diabetes Mellitus.33 A child was considered to have prediabetes if he or she had impaired fasting glucose [IFG; fasting plasma glucose ≥ 5.6 mmol/L (100 mg/dL) but <7.0 mmol/L (126 mg/dL)] or impaired glucose tolerance [IGT; 2‐hour glucose ≥ 7.8 mmol/L (140 mg/dl) but <11.1 mmol/L (200 mg/dL)].
Descriptive statistics for raw variables are presented as mean ± SD. Normal distribution and homogeneity of variances were confirmed by Shapiro‐Wilks W and Levene tests, respectively. Group differences for anthropometric, body composition, biochemical measures, physical activity, and dietary intake were determined using independent samples two‐tailed t tests if data were distributed normally and Mann‐Whitney U tests otherwise. The proportions of males and females and of blacks and whites were compared between the normal‐glucose group and the prediabetes group by using Fisher's exact test. An F test was performed to test the assumption of homogeneity of regression slopes for the interaction between the independent variables (ie, normal‐glucose and prediabetes groups) and the covariates (ie, sex, race, height, and weight or FFST mass). Because there was no interaction, analysis of covariance was used to compare the bone variables between the normal‐glucose group and prediabetes group after adjusting for sex, race, height, and weight (or FFST mass). Estimated means of bone variables in the adjusted analyses are reported as mean ± SE. In addition to the group comparisons, partial Pearson's correlation coefficients between total‐body BMC and the biochemical measurements were determined separately in the normal‐glucose group and the prediabetes group.
In the total sample, stepwise linear regression analysis was performed to identify independent correlates of total‐body BMC using the stepwise procedure. Variables with p < .10 in the adjusted (using the covariates of sex, race, height, and weight) univariate linear regression model then were entered in the multiple linear regression model. Prior to analyses, 2‐hour glucose, glucose AUC, fasting insulin, 2‐hour insulin, insulin AUC, HOMA‐IR, triglycerides, and CRP were log‐transformed so that each of these variables followed an approximate normal distribution. All statistical analyses were performed using SPSS Version 17.02 for Mac OS X (PASW Statistics, Chicago, IL, USA). A p value of .05 or less was considered statistically significant for all analyses.
Results
Participant characteristics
The descriptive characteristics are shown in Table 1. Thirty percent of the 140 prepubertal overweight children were identified with prediabetes, and the number of prediabetic children with IFG, IGT, and IFG + IGT were 21, 14, and 6, respectively. The prediabetes group, on average, was taller and heavier with greater levels of FFST mass, VAT, fasting glucose, 2‐hour glucose, glucose AUC, fasting insulin, 2‐hour insulin, and HOMA‐IR than the normal‐glucose group (all p < .05). In addition, uncarboxlated OCN was significantly lower in the prediabetes group than in the normal‐glucose group (p = .04). Age, BMI, fat mass, percentage body fat, SAAT, insulin AUC, triglycerides, total cholesterol, HDL‐C, LDL‐C, CRP, total OCN, carboxylated OCN, PA, and dietary intake were not statistically different between groups.
Table 1.
Descriptive Characteristics of the Participants
| Variable | Total sample (n = 140) | Normal‐glucose group (n = 99) | Prediabetes groupa (n = 41) |
|---|---|---|---|
| Sex (M/F) | 80/60 | 51/48 | 29/12b |
| Race (W/B) | 75/65 | 48/51 | 27/14 |
| Age (years) | 9.1 ± 1.1 | 9.1 ± 1.1 | 9.3 ± 1.0 |
| Height (cm) | 138.4 ± 8.1 | 137.4 ± 7.5 | 141.0 ± 8.9c |
| Weight (kg) | 48.4 ± 10.8 | 47.4 ± 10.7 | 50.8 ± 10.7c |
| BMI percentile | 96.8 ± 3.3 | 96.7 ± 3.3 | 97.2 ± 3.2 |
| FFST mass (kg) | 27.1 ± 4.8 | 26.5 ± 4.7 | 28.5 ± 4.9c |
| Fat mass (kg) | 20.1 ± 6.7 | 19.7 ± 6.9 | 21.0 ± 6.4 |
| Percent body fat (%) | 40.1 ± 6.6 | 40.1 ± 6.8 | 40.1 ± 6.0 |
| VAT (cm3) | 34.3 ± 17.5 | 31.3 ± 16.0 | 41.7 ± 18.8c |
| SAAT (cm3) | 253.0 ± 100.1 | 247.1 ± 106.3 | 267.5 ± 82.7 |
| Fasting glucose (mmol/L) | 5.18 ± 0.43 | 5.01 ± 0.28 | 5.61 ± 0.44c |
| 2‐Hour glucose (mmol/L)e | 6.68 ± 1.22 | 6.28 ± 0.94 | 7.51 ± 1.33d |
| Glucose AUC (mmol/L)e | 874.8 ± 123.7 | 827.3 ± 86.1 | 976.1 ± 131.4d |
| Fasting insulin (pmol/L)e | 132.0 ± 77.8 | 127.8 ± 84.7 | 143.1 ± 58.3d |
| 2‐Hour insulin (pmol/L)e | 714.6 ± 713.9 | 547.3 ± 368.8 | 1076.5 ± 1068.8d |
| Insulin AUC (pmol/L)e | 570.9 ± 431.3 | 503.5 ± 261.8 | 715.3 ± 643.1 |
| HOMA‐IRe | 4.37 ± 2.46 | 4.07 ± 2.54 | 5.11 ± 2.13d |
| Triglycerides (mmol/L)e | 0.92 ± 0.51 | 0.88 ± 0.50 | 1.02 ± 0.52 |
| Total cholesterol (mmol/L) | 4.28 ± 0.76 | 4.26 ± 0.76 | 4.33 ± 0.83 |
| HDL‐C (mmol/L) | 1.23 ± 0.31 | 1.28 ± 0.33 | 1.24 ± 0.27 |
| LDL‐C (mmol/L) | 2.56 ± 0.67 | 2.56 ± 0.69 | 2.57 ± 0.61 |
| CRP (mg/L)e | 2.92 ± 3.06 | 2.76 ± 3.10 | 3.29 ± 2.97 |
| Total OCN (ng/mL) | 26.3 ± 8.7 | 26.9 ± 8.6 | 24.7 ± 8.7 |
| Carboxylated OCN (ng/mL) | 18.8 ± 6.6 | 19.0 ± 6.4 | 18.3 ± 7.1 |
| Uncarboxylated OCN (ng/mL) | 7.5 ± 3.9 | 8.0 ± 4.1 | 6.5 ± 3.2c |
| Moderate PA (days/wk)e | 2.0 ± 2.2 | 2.1 ± 2.3 | 1.8 ± 1.6 |
| Vigorous PA (days/wk)e | 3.2 ± 2.5 | 3.4 ± 2.5 | 2.7 ± 2.3 |
| Energy intake (kcal/day) | 1750 ± 637 | 1797 ± 696 | 1629 ± 435 |
| Calcium intake (mg/day) | 731 ± 358 | 744 ± 382 | 697 ± 292 |
| Vitamin D intake (µg/day) | 4.1 ± 3.0 | 4.3 ± 3.3 | 3.7 ± 2.3 |
All values are means ± SD. BMI = body mass index; FFST = fat‐free soft tissue; VAT = visceral adipose tissue; SAAT = subcutaneous abdominal adipose tissue; AUC = area under the curve; HOMA‐IR = homeostatic model assessment of insulin resistance; HDL‐C = high‐density lipoprotein cholesterol; LDL‐C = low‐density lipoprotein cholesterol; OCN = osteocalcin.
Prediabetes was defined as having a fasting plasma glucose ≥5.6 mmol/L (100 mg/dL) but <7.0 mmol/L (126 mg/dL) or 2‐hour values in the oral glucose tolerance test of ≥7.8 (140 mg/dL) but <11.1 mmol/L (200 mg/dL).
Significantly different from the normal‐glucose group, p ≤ .05 (Fisher's exact test).
Significantly different from the normal‐glucose group, p ≤ .05 (independent‐samples t test).
Significantly different from the normal‐glucose group, p ≤ .05 (Mann‐Whitney U test).
Tests of significance between groups were based on the Mann‐Whitney U test.
Bone comparisons between normal‐glucose and prediabetes groups
Group‐specific means ± SE for bone outcomes based on an analysis of covariance that statistically controls for sex, race, height, and body weight (or FFST mass) were determined. Figure 1 shows that after controlling for sex, race, height, and body weight, the prediabetes versus normal‐glucose group had significantly lower total‐body BMC (1140.5 ± 15.7 versus 1182.5 ± 9.9 g, p = .03) and total‐body bone area (1385.4 ± 9.4 versus 1410.8 ± 5.9 cm2, p = .03) but not total‐body aBMD (0.819 ± 0.007 versus 0.833 ± 0.005 g/cm2, p = .13). Similar findings were observed between groups when FFST mass was substituted for body weight as a covariate such that the prediabetes versus normal‐glucose group had significantly lower total‐body BMC (1139.0 ± 15.9 versus 1183.0 ± 10.1 g, p = .02) and total‐body bone area (1385.4 ± 9.4 versus 1410.8 ± 5.9 g, p = .05) but not total‐body aBMD (0.818 ± 0.007 versus 0.833 ± 0.005 g/cm2, p = .10).
Figure 1.
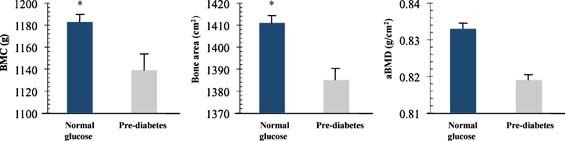
Total body bone mineral content (BMC), bone area, and areal bone mineral density (aBMD) in overweight prepubertal children with normal glucose levels (n = 99) and overweight children with pre‐diabetes (n = 41). Pre‐diabetes was defined as having a fasting plasma glucose ≥ 100 mg/dL (5.6 mmol/L) but < 126 mg/dL (7.0 mmol/L) or 2‐h values in the oral glucose tolerance test of ≥ 140 mg/dL (7.8 mmol/L) but < 200 mg/dL (11.1 mmol/L). Bone outcomes are adjusted means ± SE controlling for sex, race, height, and weight; tests of significance between groups were based on group main effect using ANCOVA. *, P ≤ 0.05, significantly different from pre‐diabetes group.
Partial correlations of total‐body BMC with biochemical parameters in the normal‐glucose and prediabetes groups
Table 2 reports partial correlations (adjusting for sex, race, height, and weight) of total‐body BMC with the biochemical parameters separately for the normal‐glucose group and the prediabetes group. In the normal‐glucose group, fasting glucose, 2‐hour glucose, glucose AUC, fasting insulin, 2‐hour insulin, insulin AUC, HOMA‐IR, triglycerides, total cholesterol, HDL‐C, LDL‐C, CRP, total OCN, carboxylated OCN, and uncarboxylated OCN were not significantly associated with total‐body BMC. Similar findings were observed in the prediabetes group; however, 2‐hour insulin, insulin AUC, and CRP were inversely related to total‐body BMC (all p < .04).
Table 2.
Partial Correlations of TOTAL‐BODY BMC With Biochemical Parameters in Overweight Prepubertal Children With Normal Glucose Levels and With Prediabetesa
| Variable | Normal‐glucose group (n = 99) | Prediabetes groupa (n = 41) | ||
|---|---|---|---|---|
| R | p value | R | p value | |
| Fasting glucose | 0.136 | 0.188 | 0.026 | 0.880 |
| 2‐Hour glucose | −0.122 | 0.328 | 0.134 | 0.452 |
| Glucose AUC | −0.066 | 0.566 | −0.019 | 0.916 |
| Fasting insulin | −0.103 | 0.320 | −0.116 | 0.493 |
| 2‐Hour insulin | −0.021 | 0.858 | −0.372 | 0.030 |
| Insulin AUC | −0.066 | 0.571 | −0.369 | 0.032 |
| HOMA−IR | −0.075 | 0.472 | −0.070 | 0.681 |
| Triglycerides | −0.124 | 0.229 | 0.072 | 0.670 |
| Total cholesterol | −0.155 | 0.133 | −0.041 | 0.809 |
| HDL‐C | −0.013 | 0.904 | 0.153 | 0.367 |
| LDL‐C | −0.130 | 0.208 | −0.237 | 0.157 |
| CRP | −0.079 | 0.452 | −0.426 | 0.008 |
| Total OCN | −0.048 | 0.655 | −0.053 | 0.763 |
| Carboxylated OCN | −0.011 | 0.918 | −0.049 | 0.779 |
| Uncarboxylated OCN | −0.083 | 0.438 | −0.038 | 0.827 |
Note: Statistical analysis was conducted by using Pearson's partial correlation adjusted for sex, race, height, and weight. BMC = bone mineral content; AUC = area under the curve; HOMA‐IR = homeostatic model assessment of insulin resistance; HDL‐C = high‐density lipoprotein cholesterol; LDL‐C = low‐density lipoprotein cholesterol; OCN = osteocalcin.
Prediabetes was defined as having a fasting plasma glucose ≥ 100 mg/dL (5.6 mmol/L) but <126 mg/dL (7.0 mmol/L) or 2‐hour values in the oral glucose tolerance test of ≥140 mg/dL (7.8 mmol/L) but <200 mg/dL (11.1 mmol/L).
Independent predictors of total‐body BMC in the total sample
Adjusted univariate linear regression demonstrated a positive association between total fat mass and total‐body BMC (p = .01) after controlling for sex, race, height, and FFST mass (Fig. 2). However, VAT and SAAT were negative predictors of total‐body BMC (both p < 0.03; Figs. 3 and 4) after controlling for sex, race, height, FFST mass, fat mass, and SAAT or VAT.
Figure 2.
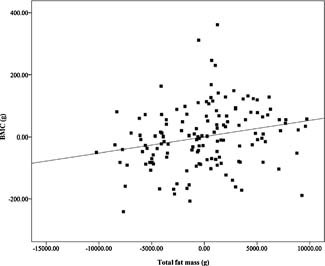
Relationship of fat mass with total body bone mineral content (BMC), after adjustment for sex, race, height, and fat‐free soft‐tissue mass (β = 0.159, P = 0.008). N = 140.
Figure 3.
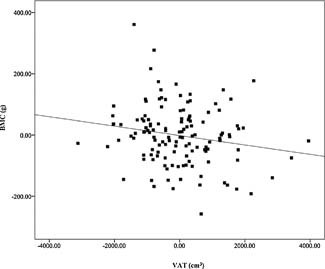
Relationship of visceral adipose tissue (VAT) with total body bone mineral content (BMC), after adjustment for sex, race, height, fat‐free soft‐tissue mass, fat mass, and subcutaneous abdominal adipose tissue (β = −0.126, P = 0.027). N = 140.
Figure 4.
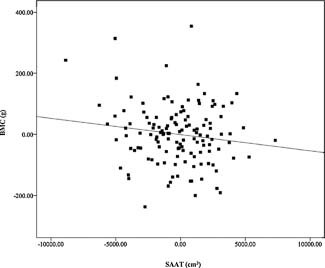
Relationship of subcutaneous abdominal adipose tissue (SAAT) with total body bone mineral content (BMC), after adjustment for sex, race, height, fat‐free soft‐tissue mass, fat mass, and visceral adipose tissue (β = −0.333, P = 0.018). N = 140.
Table 3 shows that none of the biochemical, PA, or diet parameters were significant predictors of total‐body BMC after adjustment for covariates. Stepwise multiple linear regression was conducted to examine the independent association of sex, race, height, weight, fat mass, VAT, SAAT, triglycerides, LDL‐C, CRP, vigorous PA, and energy intake with total‐body BMC. Multiple regression coefficients and partial/total R values are presented in Table 4. Height (11%), weight (65%), VAT (4%), and SAAT (2%) explained a total of 82% of the variance in total‐body BMC in total sample, with no contribution by sex, race, fat mass, triglycerides, LDL‐C, CRP, vigorous PA, or energy intake.
Table 3.
Univariate Linear Regression Including Biochemical, Physical Activity, and Diet Parameters as Independent Predictors of Total‐Body BMC in the Total Sample (n = 140)
| BMC | ||
|---|---|---|
| βa | p Value | |
| Biochemical parameters | ||
| Fasting glucose | −0.018 | .652 |
| 2‐Hour glucose | 0.003 | .949 |
| Glucose AUC | −0.055 | .202 |
| Fasting insulin | −0.078 | .103 |
| 2‐Hour insulin | −0.073 | .127 |
| Insulin AUC | −0.054 | .277 |
| HOMA‐IR | −0.076 | .104 |
| Triglycerides | −0.069 | .096 |
| Total cholesterol | −0.057 | .136 |
| HDL‐C | 0.019 | .632 |
| LDL‐C | −0.072 | .063 |
| CRP | −0.079 | .074 |
| Total OCN | −0.027 | .489 |
| Carboxylated OCN | −0.014 | .720 |
| Uncarboxylated OCN | −0.037 | .346 |
| PA and diet parameters | ||
| Moderate PA | 0.006 | .873 |
| Vigorous PA | 0.074 | .052 |
| Energy intake | 0.064 | .099 |
| Calcium intakeb | −0.022 | .642 |
| Vitamin D intakeb | −0.023 | .592 |
BMC = bone mineral content; AUC = area under the curve; HOMA‐IR = homeostatic model assessment of insulin resistance; HDL‐C = high‐density lipoprotein cholesterol; LDL‐C = low‐density lipoprotein cholesterol; OCN = osteocalcin; CRP = C‐reactive protein.
β, standardized coefficient adjusted for sex, race, height, and weight.
β, standardized coefficient adjusted for sex, race, height, weight, and energy intake.
Table 4.
Multiple Linear Regression Model for Total‐Body BMC in the Total Sample of Overweight Prepubertal Children (n = 140)
| Variable | β ± SE | R 2 |
|---|---|---|
| Intercept | −831.6 ± 191.9 | |
| Sex | NS | |
| Race | NS | |
| Height | 9.52 ± 1.89a | 0.11 |
| Weight | 19.75 ± 2.47a | 0.65 |
| Fat mass | NS | |
| Visceral adipose tissue | −0.023 ± 0.006a | 0.04 |
| SAATb | −0.008 ± 0.002a | 0.02 |
| Triglycerides | NS | |
| LDL‐C | NS | |
| CRP | NS | |
| Vigorous PA | NS | |
| Energy intake | NS | |
| Total R 2 | 0.82 |
β = multiple regression unstandardized coefficient; SE = standard error; R 2 = proportion of variability in total‐body BMC that is attributable to the regression equation.
Tests of significance were determined by stepwise linear regression at p < .05. NS = nonsignificant.
Subcutaneous abdominal adipose tissue.
Discussion
The purpose of this study was to determine if the bone mass of prepubertal overweight children with prediabetes is lower than that of prepubertal overweight children with normal glucose levels. We found that total‐body BMC was 4% lower in overweight children with prediabetes than in those without prediabetes after taking into account sex, race, height, and weight or fat‐free soft tissue mass. This finding suggests that abnormal glucose regulation may have a negative effect on the growing skeleton prior to puberty.
To our knowledge, this is the first study to examine bone mass in prepubertal overweight children by prediabetes status. The notion that prediabetes may be associated with reduced bone mass in children was introduced by Afghani and colleagues18 in a cohort of Hispanic‐American youth ranging in pubertal development from Tanner stage I to stage V. They found total‐body BMC (unadjusted and adjusted for age, pubertal stage, and FFST mass) to be lower in those with impaired glucose tolerance compared with a normal‐glucose group; however, these differences did not reach statistical significance. The same investigators determined relations in their IGT group and found that total‐body BMC was significantly and inversely associated with markers of insulin resistance, as determined by OGTT.18 In another study that included obese Brazilian adolescents (Tanner stage V), total‐body BMC was negatively related to HOMA‐IR.34 In our study, inverse associations were found not only with markers of insulin resistance but also with CRP in the overweight children with prediabetes. CRP is a recognized marker of a systemic inflammation associated with cardiovascular risk, but its role in bone metabolism is unclear. Evidence suggests, however, that increased inflammation may reduce osteoblast differentiation, as demonstrated in vitro.35, 36 Collectively, our data, along with the two aforementioned pediatric studies, may provide preliminary insight for the link between childhood obesity and skeletal fractures; however, the causal order of these cross‐sectional associations cannot be determined. Further investigations are warranted that will require prospective study design and sufficient representation of children and adolescents at all stages of growth and development.
Although type 1 diabetes is known to have negative effects on bone metabolism,37, 38 it was not until recently that type 2 diabetes was considered a potential risk for skeletal fractures.39, 40 The low bone mass typically associated with type 1 diabetes is thought to contribute to the greater number of skeletal fractures observed in type 1 diabetes patients than in controls.41, 42 Type 2 diabetes patients, on the other hand, generally are characterized with high BMC and aBMD,41, 43 although reduced bone size and structure, assessed by 3D bone imaging, has been reported recently in type 2 diabetic adult men.44 This finding, along with animal work,16 suggests that increased bone fragility in type 2 diabetes may not be discerned as much from bone mass as from other aspects of skeletal strength, such as bone size and structure. Although we did not measure structural parameters of bone strength by 3D bone imaging, our comparison of total‐body bone area between groups seems to indicate a smaller bone size in those with prediabetes. The mechanism for potential negative effects of impaired glucose metabolism on bone is unknown; however, some hypotheses include increased calcium excretion,45 alterations in vitamin D metabolism,46 increased concentrations of advanced glycation end products in collagen,47 and increased inflammation.35 It is possible that obesity in children promotes both low bone mass accrual and risk for diabetes through events that are mechanistically associated. Recent studies conducted in mice have uncovered the presence of a unique “bone‐fat‐pancreas axis” that regulates energy homeostasis, coordinates energy partitioning between bone and adipose tissue, and affects insulin sensitivity.48, 49 According to Lee and colleagues,48 only the uncarboxylated form of OCN has the capacity to induce insulin secretion and the expression of genes encoding adiponectin and insulin and ultimately improving glucose metabolism. In contrast, carboxylated OCN was found to have none of these effects. The same researchers revealed further that the adipocyte‐derived hormone leptin inhibits bone formation via sympathetic activation.49 Decreased bone formation, in turn, depresses insulin sensitivity and secretion via decreased production of uncarboxylated OCN. In this study, uncarboxlated OCN was significantly lower in the prediabetes group than in the normal‐glucose group; however, including uncarboxylated OCN as a covariate in our analyses did not change any of our bone outcomes between groups (data not shown). Given that few human studies exist on the effect of uncarboxylated and carboxylated OCN on the “bone‐fat‐pancreas axis,” further work in this area is warranted, particularly since it is unclear which form of OCN (carboxylated or uncarboxylated) is associated with metabolism.50, 51, 52
One of the key findings in this study was that the influence of adiposity on bone mass may depend on the manner in which it accumulates. A limitation of previous pediatric investigations of fat‐bone relationships, which were inconclusive, was that most did not investigate the separate influence of total and central adiposity on bone. The fact that obesity‐related metabolic abnormalities are more strongly related to central rather than total adiposity may be another potential explanation for the large body of conflicting data.53 To date, three pediatric studies have investigated relations between central adiposity and bone.54, 55, 56 In these reports, central adiposity was negatively associated with bone mass in white, African‐American, and Hispanic‐American children and adolescents,54, 55 as well as with bone structure in late‐adolescent white females.56 Although these studies reported relations between central adiposity and bone, they did not discuss54, 55 or report56 their findings between total adiposity and bone. In our study, we found that both total adiposity and central adiposity have significant but opposing relations with bone mass. Whereas total fat mass had a positive association with total‐body bone mass, the central adiposity measurements (VAT and SAAT) had negative relations with total‐body bone mass. In our regression analyses, however, it was VAT and SAAT rather than total‐body fat mass that were independent predictors of bone mass. Taken together, it seems that increased central body adiposity, which is more clinically relevant for metabolic abnormalities than for increased total‐body adiposity, could play an adverse role in bone health.
Modifiable factors such as PA and diet not only play an important role in obesity and prediabetes progression but also affect skeletal development. Thus it is possible that differences in bone mass found between groups could be attributed to dissimilarities in PA and diet. In this study, no significant differences were found between groups for the number of days of moderate and vigorous PA; however, we did not collect information on the types of activities performed by the participants. Therefore, it is uncertain the degree to which participants engaged in high‐impact PA. Certain types of PAs with high‐impact loading (eg, artistic gymnastics) have been documented as having a greater positive effect on bone mineral accrual than low‐impact loading (eg, swimming), particularly during growth.57 With regard to dietary intake, the groups reported no significant differences in energy, macronutrient, and micronutrient intakes. However, it is important to note that the mean self‐reported calcium and vitamin D intakes in both groups were considerably lower than the recommended adequate intakes of 1300 mg/day and 5 µg/day, respectively. Given the limitations of childhood dietary recall, it would be preferable to measure calcium absorption/excretion and circulating concentrations of vitamin D. Since obese individuals with impaired glucose metabolism tend to have increased calcium excretion and lower levels of circulating vitamin D,58 calcium and vitamin D could be mediating factors in the relations between adiposity, bone, and glucose‐insulin metabolism.
Strengths of this study were the comprehensive suite of glucose metabolism parameters collected using robust methodology and the assessment of centralized adiposity by MRI. Furthermore, we minimized the degree of variability in factors known to influence bone, such as body size and maturational status, by comparing two groups of overweight children in Tanner stage I of puberty. A limitation in our study was that we used only DXA‐derived bone measurements of the total body. Although DXA‐derived regional bone measurement would have provided additional information, we recognize the limitations of using DXA in children.25 3D imaging techniques such as peripheral quantitative computed tomography would afford more definitive information on volumetric BMD and bone geometry and the effect of adiposity and prediabetes on the individual cortical and trabecular compartments. Nevertheless, our study findings with total‐body BMC cannot be disregarded because BMC is considered one of the preferred bone measurements for the assessment of bone status in youth (reproducibility, low radiation, and lack of areal density–related errors),25 and more important, total‐body BMC has been shown to be a good predictor of fracture risk.59 Another important limitation to note is that our small sample size did not allow separate analysis of data by males and females or by whites and blacks. Some studies have reported sex and race differences of not only skeletal development but also of fat accumulation and glucose metabolism.19, 20, 54, 60 Although determining the effects of prediabetes on bone mass by sex and race was not the objective of this study, future work in the area is warranted.
Our study in prepubertal overweight children provides further insight into the fat‐bone relationship by taking into account abnormal glucose regulation and associated biochemical parameters. Specifically, our data suggest that prediabetic overweight children may be at risk for poor skeletal development. It also appears that central rather than total adiposity may be detrimental to bone health.
Disclosures
All the authors state that they have no conflicts of interest.
Acknowledgements
A special thanks goes to the study subjects and their parents, who made this research possible. In addition, we gratefully acknowledge Dr Caren Gundberg for assessment of the osteocalcin parameters. This study was supported by National Institute of Diabetes and Digestive and Kidney Diseases Grant RO1 DK 60692.
References
- 1. Weiss R, Dziura J, Burgert TS, et al. Obesity and the metabolic syndrome in children and adolescents. N Engl J Med. 2004;350:2362–2374. [DOI] [PubMed] [Google Scholar]
- 2. Goulding A, Jones IE, Taylor RW, Manning PJ, Williams SM. More broken bones: a 4‐year double cohort study of young girls with and without distal forearm fractures. J Bone Miner Res. 2000;15:2011–2018. [DOI] [PubMed] [Google Scholar]
- 3. Skaggs DL, Loro ML, Pitukcheewanont P, Tolo V, Gilsanz V. Increased body weight and decreased radial cross‐sectional dimensions in girls with forearm fractures. J Bone Miner Res. 2001;16:1337–1342. [DOI] [PubMed] [Google Scholar]
- 4. Taylor ED, Theim KR, Mirch MC, et al. Orthopedic complications of overweight in children and adolescents. Pediatrics. 2006;117:2167–2174. [DOI] [PMC free article] [PubMed] [Google Scholar]
- 5. Hui SL, Slemenda CW, Johnston CC Jr. Age and bone mass as predictors of fracture in a prospective study. J Clin Invest. 1988;81:1804–1809. [DOI] [PMC free article] [PubMed] [Google Scholar]
- 6. Leonard MB, Shults J, Wilson BA, Tershakovec AM, Zemel BS. Obesity during childhood and adolescence augments bone mass and bone dimensions. Am J Clin Nutr. 2004;80:514–523. [DOI] [PubMed] [Google Scholar]
- 7. Clark EM, Ness AR, Tobias JH. Adipose tissue stimulates bone growth in prepubertal children. J Clin Endocrinol Metab. 2006;91:2534–2541. [DOI] [PMC free article] [PubMed] [Google Scholar]
- 8. Ducher G, Bass SL, Naughton GA, Eser P, Telford RD, Daly RM. Overweight children have a greater proportion of fat mass relative to muscle mass in the upper limbs than in the lower limbs: implications for bone strength at the distal forearm. Am J Clin Nutr. 2009;90:1104–1111. [DOI] [PubMed] [Google Scholar]
- 9. Ellis KJ, Shypailo RJ, Wong WW, Abrams SA. Bone mineral mass in overweight and obese children: diminished or enhanced? Acta Diabetol. 2003;40 (Suppl 1): S274–S277. [DOI] [PubMed] [Google Scholar]
- 10. Pollock NK, Laing EM, Baile CA, Hamrick MW, Hall DB, Lewis RD. Is adiposity advantageous for bone strength? A peripheral quantitative computed tomography study in late adolescent females. Am J Clin Nutr. 2007;86:1530–1538. [DOI] [PubMed] [Google Scholar]
- 11. Petit MA, Beck TJ, Shults J, Zemel BS, Foster BJ, Leonard MB. Proximal femur bone geometry is appropriately adapted to lean mass in overweight children and adolescents. Bone. 2005;36:568–576. [DOI] [PubMed] [Google Scholar]
- 12. Janicka A, Wren TA, Sanchez MM, et al. Fat mass is not beneficial to bone in adolescents and young adults. J Clin Endocrinol Metab. 2007;92:143–147. [DOI] [PubMed] [Google Scholar]
- 13. Pollock NK, Laing EM, Hamrick MW, Baile CA, Hall DB, Lewis RD. Bone and fat relationships in postadolescent black females: a pQCT study. Osteoporos Int. 2010; DOI: 10.1007/s00198-010-1266-6. [DOI] [PubMed] [Google Scholar]
- 14. Sinha R, Fisch G, Teague B, et al. Prevalence of impaired glucose tolerance among children and adolescents with marked obesity. N Engl J Med. 2002;346:802–810. [DOI] [PubMed] [Google Scholar]
- 15. Li C, Ford ES, Zhao G, Mokdad AH. Prevalence of pre‐diabetes and its association with clustering of cardiometabolic risk factors and hyperinsulinemia among U.S. adolescents: National Health and Nutrition Examination Survey 2005‐2006. Diabetes Care. 2009;32:342–347. [DOI] [PMC free article] [PubMed] [Google Scholar]
- 16. Ahmad T, Ohlsson C, Saaf M, Ostenson CG, Kreicbergs A. Skeletal changes in type‐2 diabetic Goto‐Kakizaki rats. J Endocrinol. 2003;178:111–116. [DOI] [PubMed] [Google Scholar]
- 17. Prisby RD, Swift JM, Bloomfield SA, Hogan HA, Delp MD. Altered bone mass, geometry and mechanical properties during the development and progression of type 2 diabetes in the Zucker diabetic fatty rat. J Endocrinol. 2008;199:379–388. [DOI] [PubMed] [Google Scholar]
- 18. Afghani A, Cruz ML, Goran MI. Impaired glucose tolerance and bone mineral content in overweight latino children with a family history of type 2 diabetes. Diabetes Care. 2005;28:372–378. [DOI] [PubMed] [Google Scholar]
- 19. Bachrach LK, Hastie T, Wang MC, Narasimhan B, Marcus R. Bone mineral acquisition in healthy Asian, Hispanic, black, and Caucasian youth: a longitudinal study. J Clin Endocrinol Metab. 1999;84:4702–4712. [DOI] [PubMed] [Google Scholar]
- 20. Baxter‐Jones AD, Mirwald RL, McKay HA, Bailey DA. A longitudinal analysis of sex differences in bone mineral accrual in healthy 8‐19‐year‐old boys and girls. Ann Hum Biol. 2003;30:160–175. [DOI] [PubMed] [Google Scholar]
- 21. Davis CL, Tomporowski PD, Boyle CA, et al. Effects of aerobic exercise on overweight children's cognitive functioning: a randomized controlled trial. Res Q Exerc Sport. 2007;78:510–519. [DOI] [PMC free article] [PubMed] [Google Scholar]
- 22. Kuczmarski RJ, Ogden CL, Grummer‐Strawn LM, et al. CDC growth charts: United States. Adv Data. 2000;314:1–27. [PubMed] [Google Scholar]
- 23. Goran MI, Gower BA. Longitudinal study on pubertal insulin resistance. Diabetes. 2001;50:2444–2450. [DOI] [PubMed] [Google Scholar]
- 24. Tanner J. Growth and Adolescence 2nd Edition ed Oxford, UK: Blackwell Scientific Publications, 1962. [Google Scholar]
- 25. Gordon CM, Bachrach LK, Carpenter TO, et al. Dual energy X‐ray absorptiometry interpretation and reporting in children and adolescents: the 2007 ISCD Pediatric Official Positions. J Clin Densitom. 2008;11:43–58. [DOI] [PubMed] [Google Scholar]
- 26. Owens S, Gutin B, Allison J, et al. Effect of physical training on total and visceral fat in obese children. Med Sci Sports Exerc. 1999;31:143–148. [DOI] [PubMed] [Google Scholar]
- 27. Matthews JN, Altman DG, Campbell MJ, Royston P. Analysis of serial measurements in medical research. BMJ. 1990;300:230–235. [DOI] [PMC free article] [PubMed] [Google Scholar]
- 28. Matthews DR, Hosker JP, Rudenski AS, Naylor BA, Treacher DF, Turner RC. Homeostasis model assessment: insulin resistance and beta‐cell function from fasting plasma glucose and insulin concentrations in man. Diabetologia. 1985;28:412–419. [DOI] [PubMed] [Google Scholar]
- 29. Friedewald WT, Levy RI, Fredrickson DS. Estimation of the concentration of low‐density lipoprotein cholesterol in plasma, without use of the preparative ultracentrifuge. Clin Chem. 1972;18:499–502. [PubMed] [Google Scholar]
- 30. Gundberg CM, Nieman SD, Abrams S, Rosen H. Vitamin K status and bone health: an analysis of methods for determination of undercarboxylated osteocalcin. J Clin Endocrinol Metab. 1998;83:3258–3266. [DOI] [PubMed] [Google Scholar]
- 31.Centers for Disease Control and Prevention. Methodology of the youth risk behavior surveillance system. Morb Mortal Wkly Rep 2004; 53(RR‐12):1‐13. [PubMed]
- 32. Brener ND, Collins JL, Kann L, Warren CW, Williams BI. Reliability of the Youth Risk Behavior Survey Questionnaire. Am J Epidemiol. 1995;141:575–580. [DOI] [PubMed] [Google Scholar]
- 33. Diagnosis and classification of diabetes mellitus. Diabetes Care. 2008;31 (Suppl 1): S55–60. [DOI] [PubMed] [Google Scholar]
- 34. do Prado WL, de Piano A, Lazaretti‐Castro M, et al. Relationship between bone mineral density, leptin and insulin concentration in Brazilian obese adolescents. J Bone Miner Metab. 2009;27:613–619. [DOI] [PubMed] [Google Scholar]
- 35. Mody N, Parhami F, Sarafian TA, Demer LL. Oxidative stress modulates osteoblastic differentiation of vascular and bone cells. Free Radic Biol Med. 2001;31:509–519. [DOI] [PubMed] [Google Scholar]
- 36. Manolagas SC, Almeida M. Gone with the Wnts: beta‐catenin, T‐cell factor, forkhead box O, and oxidative stress in age‐dependent diseases of bone, lipid, and glucose metabolism. Mol Endocrinol. 2007;21:2605–2614. [DOI] [PubMed] [Google Scholar]
- 37. Albright F, Reifenstein E. The parathyroid glands and metabolic bone disease; selected studies. Baltimore, MD: Williams & Williams, 1948. [Google Scholar]
- 38. Schwartz AV, Sellmeyer DE, Ensrud KE, et al. Older women with diabetes have an increased risk of fracture: a prospective study. J Clin Endocrinol Metab. 2001;86:32–38. [DOI] [PubMed] [Google Scholar]
- 39. Holmberg AH, Johnell O, Nilsson PM, Nilsson J, Berglund G, Akesson K. Risk factors for fragility fracture in middle age. A prospective population‐based study of 33,000 men and women. Osteoporos Int. 2006;17:1065–1077. [DOI] [PubMed] [Google Scholar]
- 40. Melton LJ 3rd, Leibson CL, Achenbach SJ, Therneau TM, Khosla S. Fracture risk in type 2 diabetes: update of a population‐based study. J Bone Miner Res. 2008;23:1334–1342. [DOI] [PMC free article] [PubMed] [Google Scholar]
- 41. Buysschaert M, Cauwe F, Jamart J, et al. Proximal femur density in type 1 and 2 diabetic patients. Diabete Metab. 1992;18:32–37. [PubMed] [Google Scholar]
- 42. Hofbauer LC, Brueck CC, Singh SK, Dobnig H. Osteoporosis in patients with diabetes mellitus. J Bone Miner Res. 2007;22:1317–1328. [DOI] [PubMed] [Google Scholar]
- 43. van Daele PL, Stolk RP, Burger H, et al. Bone density in non‐insulin‐dependent diabetes mellitus. The Rotterdam Study. Ann Intern Med. 1995;122:409–414. [DOI] [PubMed] [Google Scholar]
- 44. Petit MA, Paudel ML, Taylor BC, et al. Bone Mass and Strength in Older Men with Type 2 Diabetes: The Osteoporotic Fractures in Men Study. J Bone Miner Res. 2009;25:285–291. [DOI] [PMC free article] [PubMed] [Google Scholar]
- 45. McNair P, Madsbad S, Christensen MS, et al. Bone mineral loss in insulin‐treated diabetes mellitus: studies on pathogenesis. Acta Endocrinol (Copenh). 1979;90:463–472. [DOI] [PubMed] [Google Scholar]
- 46. Bouillon R. Diabetic bone disease. Calcif Tissue Int. 1991;49:155–160. [DOI] [PubMed] [Google Scholar]
- 47. Miyata T, Notoya K, Yoshida K, et al. Advanced glycation end products enhance osteoclast‐induced bone resorption in cultured mouse unfractionated bone cells and in rats implanted subcutaneously with devitalized bone particles. J Am Soc Nephrol. 1997;8:260–270. [DOI] [PubMed] [Google Scholar]
- 48. Lee NK, Sowa H, Hinoi E, et al. Endocrine regulation of energy metabolism by the skeleton. Cell. 2007;130:456–469. [DOI] [PMC free article] [PubMed] [Google Scholar]
- 49. Hinoi E, Gao N, Jung DY, et al. An Osteoblast‐dependent mechanism contributes to the leptin regulation of insulin secretion. Ann N Y Acad Sci. 2009;1173 (Suppl 1): E20–30. [DOI] [PubMed] [Google Scholar]
- 50. Shea MK, Gundberg CM, Meigs JB, et al. Gamma‐carboxylation of osteocalcin and insulin resistance in older men and women. Am J Clin Nutr. 2009;90:1230–1235. [DOI] [PMC free article] [PubMed] [Google Scholar]
- 51. Foresta C, Strapazzon G, De Toni L, et al. Evidence for Osteocalcin Production by Adipose Tissue and Its Role in Human Metabolism. J Clin Endocrinol Metab. 2010;95:3502–3506. [DOI] [PubMed] [Google Scholar]
- 52. Prats‐Puig A, Mas‐Parareda M, Riera‐Perez E, et al. Carboxylation of osteocalcin affects its association with metabolic parameters in healthy children. Diabetes Care. 2010;33:661–663. [DOI] [PMC free article] [PubMed] [Google Scholar]
- 53. Wisse BE. The inflammatory syndrome: the role of adipose tissue cytokines in metabolic disorders linked to obesity. J Am Soc Nephrol. 2004;15:2792–2800. [DOI] [PubMed] [Google Scholar]
- 54. Afghani A, Goran MI. Racial differences in the association of subcutaneous and visceral fat on bone mineral content in prepubertal children. Calcif Tissue Int. 2006;79:383–388. [DOI] [PubMed] [Google Scholar]
- 55. Afghani A, Goran MI. The interrelationships between abdominal adiposity, leptin and bone mineral content in overweight Latino children. Horm Res. 2009;72:82–87. [DOI] [PMC free article] [PubMed] [Google Scholar]
- 56. Gilsanz V, Chalfant J, Mo AO, Lee DC, Dorey FJ, Mittelman SD. Reciprocal relations of subcutaneous and visceral fat to bone structure and strength. J Clin Endocrinol Metab. 2009;94:3387–3393. [DOI] [PMC free article] [PubMed] [Google Scholar]
- 57. Cassell C, Benedict M, Specker B. Bone mineral density in elite 7‐ to 9‐yr‐old female gymnasts and swimmers. Med Sci Sports Exerc. 1996;28:1243–1246. [DOI] [PubMed] [Google Scholar]
- 58. Bell NH, Epstein S, Greene A, Shary J, Oexmann MJ, Shaw S. Evidence for alteration of the vitamin D‐endocrine system in obese subjects. J Clin Invest. 1985;76:370–373. [DOI] [PMC free article] [PubMed] [Google Scholar]
- 59. Clark EM, Tobias JH, Ness AR. Association between bone density and fractures in children: a systematic review and meta‐analysis. Pediatrics. 2006;117:e291–7. [DOI] [PMC free article] [PubMed] [Google Scholar]
- 60. Gower BA, Nagy TR, Goran MI. Visceral fat, insulin sensitivity, and lipids in prepubertal children. Diabetes. 1999;48:1515–1521. [DOI] [PubMed] [Google Scholar]