Abstract
Methods are described for generating 3D time-resolved contrast-enhanced MR angiograms of the hands and feet. Given targeted spatial resolution and frame times, it is shown that acceleration of about one order of magnitude or more is necessary. This is obtained by a combination of 2D Sensitivity Encoding (SENSE) and homodyne (HD) acceleration methods. Image update times from 3.4 to 6.8 sec are provided in conjunction with view sharing. Modular receiver coil arrays are described which can be designed to the targeted vascular region. Images representative of the technique are generated in the vasculature of the hands and feet in volunteers and in patient studies.
Keywords: contrast-enhanced MRA, parallel acquisition, time-resolved MRI
INTRODUCTION
Ever since the introduction in the mid-1990s of contrast-enhanced MR angiography (CE-MRA) (1) there has been steady improvement in the technique. Early investigations identified a number of performance targets, including the desire for high spatial resolution 3D images, the need to synchronize the data acquisition to the arterial phase of the contrast bolus passage, and the desirability of minimal venous enhancement. These early targets were addressed to a great extent with the development of short repetition time (TR) gradient echo pulse sequences, non-real-time (2) and real-time (3, 4) means for determination of accurate timing, and development of centric view orders allowing extended acquisition times into the venous phase (5). CE-MRA is now widely used in imaging multiple vascular territories (6).
Imaging the vasculature of the hands and feet with CE-MRA has its own specific challenges. The fine vascular detail requires very high spatial resolution, which can translate into long acquisition times. Also, because these arterial beds are so distal from the heart, particularly for the feet, the inter-subject range of transit times from contrast injection to the arterial phase can be broader than for virtually any other vascular region (7).
To place this current work into context, Table 1 presents summaries of performance parameters for 3D contrast-enhanced MRA over approximately the last decade for the hands (a) and feet (b), with data taken from Refs. (8–15) for the hands and from Refs. (16–24) for the feet. Another approach studied previously but not included in the tables is one using high frame rate 2D acquisition (25, 26). Figures 1a and b show plots for the hands and feet, respectively, of spatial resolution vs. frame time using the data of Table 1, where spatial resolution is defined as the voxel volume. Points marked with an asterisk indicate that the volume calculation used interpolated pixel sizes along at least one direction. As seen in the points becoming closer to the origin of each plot, there has been a general trend over this past decade for improved spatial and temporal resolution. The methods described in this work are designated by the diamond (◆) in each plot.
Table 1a.
Summary of performance parameters for contrast-enhanced MR angiography of the hands.
| No. | Investigator (Reference) Year | Voxel Dimensions (each in mm) | Voxel Volume (mm3) | Frame Time (sec) | Notes |
|---|---|---|---|---|---|
| 1 | Winterer (8) 2000 | 0.87 × 0.78 × 1.5 | 1.02 | 39 | |
| 2 | Goldfarb (9) 2001 | 1.4 × 0.75 × 2.0 | 2.10 | 23 | 2 |
| 3 | Connell (10) 2002 | 0.58 × 0.67 × 0.8 | 0.31 | 40 | 1, 2 |
| 4 | Wentz (11) 2003 | 0.59 × 0.29 × 0.7 | 0.12 | 95 | 1, 3 |
| 5 | Gluecker (12) 2006 | 0.62 × 1.14 × 1.3 | 0.71 | 20 | 1, 3 |
| 6 | Brauck (13) 2007 | 1.0 × 0.7 × 1.3 | 0.91 | 2 (8) | 1, 4 |
| 7 | Winterer (14) 2008 | 0.4 × 0.4 × 1.0 | 0.16 | 20 | 1 |
| 8 | Reisinger (15) 2009 | 0.9 × 0.9 × 0.9 | 0.73 | 24 | 1, 3 |
| 9 | Haider (this work) | 0.75 × 0.75 × 1.0 | 0.56 | 3.5 (12.5) | 4 |
Notes:
Stated voxel dimensions are after interpolation or zero filling in one or more directions. Sampling resolution is coarser than values shown.
Unilateral acquisition
Cuff compression used to delay venous return.
For these studies the temporal footprint, or acquisition time for a fully sampled image, is longer than the frame time because of view sharing, and is shown in parentheses.
Figure 1.
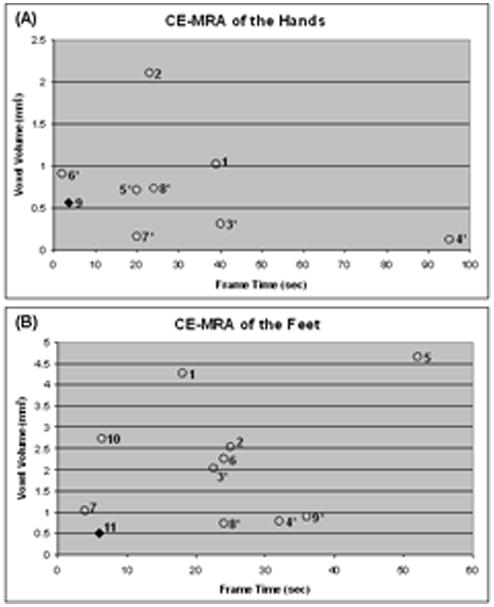
Plots of voxel volume vs. frame time for contrast-enhanced MRA of the hands (A) and feet (B) using the data from Table 1. The methods reported in this work are indicated by the diamond (◆) in each plot. Points identified with an asterisk indicate that the voxel volume was determined using pixel dimensions which resulted from interpolation along at least one dimension.
The purpose of this work is to describe recent developments in time-resolved contrast-enhanced MR angiography (CE-MRA) of the hands and feet which allow simultaneous levels of performance in spatial and temporal resolution which have not previously been attained. The technical enablers of the method are 2D parallel acquisition (27) with high (R≥8) acceleration factors, modular multi-element receiver coil arrays, and special purpose methods for effectively sampling k-space. These are discussed and the results from in vivo studies are presented in the next sections. This work is based on a presentation at the 2009 Meeting of the ISMRM (28).
METHODS
k-Space Sampling for Time-Resolved CE-MRA of the Hands and Feet
The k-space sampling and data acquisition for this work is based on the Cartesian Acquisition with Projection Reconstruction-like sampling (CAPR) method (29). As a reference the sampling pattern for the phase encoding (kY-kZ) plane for the assumed 3DFT acquisition is shown in Fig. 2A, and the playout of phase encoding “views” and data sorting are shown in Fig. 2B. Details have been provided previously in (29), but briefly, all sampling is done on a rectilinear grid of points. However, only those points which fall within the central orange zone at the k-space center or one of the colored vane sets in the surrounding annular region are actually sampled. In Fig. 2A each individual vane is diametrically opposed by a gap between other vanes. Points within these gaps are not sampled, allowing a reduction in the number of measurements by a factor of 1.8 vs. full sampling. Values at these unsampled points are estimated using homodyne reconstruction which exploits symmetry properties of the k-space data and a measurement of the phase map using data in the central orange zone. This process is more familiarly done in reducing the number of phase encoding measurements in 2DFT acquisition or in performing partial echo acquisition (30, 31).
Figure 2.
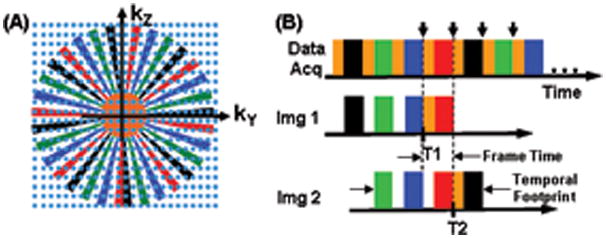
A. Plot in kY-kZ space of the sampling pattern for the CAPR sequence.
B. Temporal playout of the k-space sampling of (A) and sorting of the measurements into the first two fully sampled images, Img 1 and Img 2.
The playout of sampling is shown in Fig. 2B, with acquisition starting at central orange k-space followed by one of the colored vane sets, black in this example. The sampling order used is elliptical centric (5). The process repeats with central k-space again sampled followed by another vane set, here green, and continues cyclically. Images are reconstructed using the data sorting also shown in Fig. 2B. Each image is formed from samplings of all four vane sets as well as central orange k-space. This provides for samples of all identified regions of Fig 2A to be included in image formation. Given that central k-space is sampled four times during the time required to sample all four vane sets in peripheral k-space, there are options how to use the central k-space sampling. As discussed in Ref. (32), we have found that the sorting shown in Fig. 2B works well for the depiction of vasculature, with other choices either blunting the appearance of the bolus leading edge, causing artifactual signal in advance of the leading edge, or causing diminished lateral spatial resolution. The second image designated, Img 2, is formed by updating the central orange k-space and the earliest vane set (here black) used for Img 1. Samples of the other vane sets (green, blue, and red) are shared from Img 1 to Img 2. This process continues for data selection for subsequent images in the series. The temporal footprint identified in Fig. 2B is defined as the total duration over which any data are used to form an unsubtracted image. It accounts for the characteristic of view-shared sequences that the image acquisition time is not as short as the frame time (29).
The CAPR sequence shown in Fig. 2 was initially developed for CE-MRA of the vasculature of the brain (29) and then of the calves (33). In this current work it has been adapted to imaging the vasculature of the feet and the hands. A coarse estimation of the level of acceleration necessary can be determined as indicated in Table 2. For the feet the spatial resolution was targeted as being somewhat finer (0.75 × 0.75 × 0.90 mm3) than the 1 mm isotropic previously attained in the calves in Ref. (33). The targeted frame time was kept at 6 sec with a temporal footprint approximately four times larger, 24 sec. A sagittal acquisition was assumed with a field of view (FOV) encompassing both feet: frequency encoding direction superior/inferior (S/I), phase encoding anterior/posterior (A/P), and slice encoding left/right (L/R) with typical respective values of 30.0 × 24.0 × 19.8 cm3. These specifications can be converted into a rectangular kY-kZ space sampling pattern. If the k-space corners are not sampled (34), as indicated in Fig. 2A, this reduces the number of necessary samples by about π/4, leading to an overall requirement of about 52,000 samples. For a repetition time (TR) of 5.85 msec, as used in this work, the acquisition time necessary for this number of samples is about 300 sec. The net level of acceleration is approximately equal to the ratio of this unaccelerated acquisition time with the desired temporal footprint, 300 sec/24 sec = 12.5. For this work this was obtained using a combination of 2D SENSE and 2D homodyne methods.
Table 2.
Sampling parameters for CE-MRA of the hands and feet. Sagittal acquisition was assumed for the feet and coronal acquisition for the hands.
| Feet | Hands | |||||
|---|---|---|---|---|---|---|
| Parameter | X | Y | Z | X | Y | Z |
| FOV (cm) | 30.0 | 24.0 | 19.8 | 30.0 | 24.0 | 10.8 |
| Resolution (mm) | 0.75 | 0.75 | 0.90 | 0.75 | 0.75 | 1.00 |
| No. Samples | 400 | 320 | 220 | 400 | 320 | 108 |
| Number of Views (NY × NZ) | 70,400 | 34,500 | ||||
| Cut k-Space Corners (π/4 ≈ 0.75) | 52,800 | 25,920 | ||||
| TR (msec) | 5.85 | 5.85 | ||||
| Unaccelerated Scan Time (sec) | 309 | 152 | ||||
| Target Temporal Footprint (sec) | 24 | 15 | ||||
| Target Net Acceleration | 12.87 | 10.11 | ||||
For bilateral imaging of the hands similar considerations were used. The target resolution was 0.75 × 0.75 × 1.0 mm3 with the targeted frame time set to be smaller (3.5 sec) than for the feet to allow better temporal resolution. This resulted in a targeted temporal footprint of 15 sec. Coronal acquisition was assumed, with the frequency encoding direction placed along the long axes of the arms, phase encoding L/R, and slice encoding A/P, with typical field of view (FOV) values of 30.0 × 22.5 × 10.8 cm3. Analysis similar to that used for imaging the feet again leads to the requirement for acceleration factors of about 10 or higher.
Receiver Coil Arrays for CE-MRA of the Feet and Hands
The development of receiver coil arrays for the calves for 2D SENSE-accelerated CE-MRA has been discussed in Ref. (33). One notable finding of that work was that because the two directions of the parallel acquisition for the coronal-format CE-MRA acquisition lie within the transverse plane, the placement of coil elements circumferentially around the calves provides both good SNR and low g-factors. The same reasoning applies to the sagittal format used here for imaging the feet.
For this work several multi-element coil arrays were used, all designed for circumferential placement around the targeted anatomy, feet or hands. The design of each array was similar. First, a basic element size was specified, with the length chosen to allow imaging along the extent of the S/I FOV and the width selected to provide moderate falloff of sensitivity along the transverse FOV. Second, two elements were then overlapped to minimize mutual inductance and attached to form a two-element module. Next, a sufficient number of modules were then attached together using detachable clasping into an extended linear array for placement around the region under study. The leading and trailing modules of the array were attached to each other using the same clasping arrangement for circumferential placement. The modular design accommodates patients of different sizes. Figure 3 shows individual modules and the placement of the coil used for imaging of the hands.
Figure 3. Example of modular receiver coil arrays used for CAPR CE-MRA.
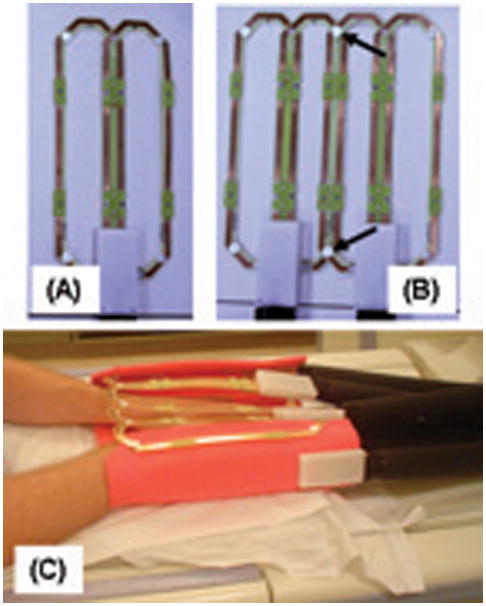
A. Single module formed from two elements with overlap selected to minimize mutual inductance. Each element shown is 6.2 cm × 25 cm.
B. Combination of two two-element modules into a four-element array. Modules are attached to each other by mechanical clasps (arrows).
C. Illustration of how a 12-element coil formed of six modules illustrated in (A) and (B) is placed for imaging the hands. The subject lies prone in the magnet with hands placed into the coil array. The leading and end modules are attached to provide circumferential placement about both hands. Additional padding (orange) provides mechanical support.
In Vivo Experiments
The ability of the CAPR sequence to resolve known, small indentations which simulate stenoses in otherwise smooth bore tubes of diameters ranging from 3 to 10 mm has previously been demonstrated (33), and given this technical performance, in vivo studies were performed. The CAPR sequence was used in conjunction with 2D SENSE and 2D homodyne reconstruction for imaging volunteers and clinical patients for whom CE-MRA was clinically indicated. The study was done using a protocol approved by the Institutional Review Board of our institution, and written consent was obtained from all volunteers. In all cases, a fast spoiled gradient echo pulse sequence was used for data acquisition with the following parameters: repetition time (TR) 5.85 msec; echo time (TE) 2.7 msec; flip angle 30°; and bandwidth ±62.5 kHz. A TR this long was necessary to accommodate the fully-sampled echo consisting of a relatively high number of readout points, 400, to provide the desired spatial resolution.
Prior to the contrast-enhanced run, a SENSE calibration was performed by using a fast gradient echo sequence with similar parameters to the above but with a flip angle of 10°, bandwidth of ±31.25 kHz, and twofold reduction of resolution in both the Y and Z directions vs. that used for the actual CE-MRA run. For the actual CAPR CE-MRA, 20 mL of Multihance (gadobenate dimeglumine, Bracco Diagnostics, Princeton NJ) was injected into an arm vein at a rate of 3 mL/sec followed by 20 mL of saline also at 3 mL/sec by power injector (Spectris, Medrad, Indianola PA). This contrast dose was selected as it corresponds to approximately 0.1 mmol/kg for the typical 90 kg subject in our CE-MRA practice. The injection rate of 3 mL/sec prolonged the extent of the bolus to the approximate image frame time. For imaging the feet the subject’s feet were strapped to a custom-built wedge to provide immobilization. The wedge was constructed of polycarbonate and acrylic plastic and had a flat surface of dimensions 19 cm × 27 cm onto which the feet were placed and which provided approximately 30 degrees of extension from a neutral foot position. The foot wedge was designed so the custom built coil array could be easily wrapped around it. Prior to the actual injection the CAPR sequence was initiated and at least one contrast-free image of the region under study was acquired. For each subject the CAPR sequence was applied repetitively until 36 image sets were acquired at the chosen frame time interval. Automated reconstructions were performed on a custom system interfaced to the MRI scanner (35). Typically all reconstructions including source images and Maximum Intensity Projection (MIP) images along the slice select direction were completed and returned to the proprietary MR imager viewer within two minutes after the end of the contrast-enhanced run for immediate clinical review. Several combinations of SENSE acceleration and multicoil arrays were tested and evaluated. Acquisition parameters including receiver coil dimensions used for all studies presented are shown in Table 3.
Table 3.
Summary of acquisition parameters for CAPR time-resolved imaging studies.
| Vascular Region | Feet | Feet | Hands | Hands | Hands |
|---|---|---|---|---|---|
| Figure | 4, 6 | 5 | 7 (a, c, e, g) | 7 (b, d, f, h) | 8 |
| Acquisition Format | Sagittal | Sagittal | Coronal | Coronal | Coronal |
| FOV (X × Y × Z, cm3) | 30 × 24 × 19.8 | 30 × 24 × 19.8 | 30 × 21.6 × 10.8 | 30 × 21.6 × 10.8 | 30 × 24 × 10.8 |
| Sampling | 400 × 320 × 220 | 400 × 320 × 220 | 400 × 288 × 108 | 400 × 288 × 108 | 400 × 320 × 108 |
| Spatial resolution (mm3) | 0.75 × 0.75 × 0.9 | 0.75 × 0.75 × 0.9 | 0.75 × 0.75 × 1.0 | 0.75 × 0.75 × 1.0 | 0.75 × 0.75 × 1.0 |
| Frame time (sec) | 6.8 | 6.8 | 4.1 | 3.4 | 4.5 |
| Temporal footprint (sec) | 25.0 | 25.0 | 14.0 | 12.5 | 16.0 |
| 2D SENSE acceleration (Total R = L/R × A/P) | 8 = 4 × 2 | 8 = 4 × 2 | 8 = 4 × 2 | 12 = 6 × 2 | 8 = 4 × 2 |
| 2D homodyne acceleration (RHD) | 1.8 | 1.8 | 1.8 | 1.8 | 1.8 |
| Net acceleration (Rnet = R × RHD) | 14.4 | 14.4 | 14.4 | 21.6 | 14.4 |
| Receiver coil element size (width × length, cm2) |
*10.5 × 27.2 14.3 × 27.2 |
8.9 × 27.7 |
*10.5 × 27.2 14.3 × 27.2 |
6.2 × 25.0 |
*10.5 × 27.2 14.3 × 27.2 |
| No. coil elements used | 8 | 12 | 8 | 12 | 8 |
For these studies the four anterior and posterior elements had the smaller width shown, and the four lateral elements had the larger width shown.
In selected studies the time series of 3D contrast-enhanced MR angiograms was additionally used to generate a time-of-arrival (TOA) map. Such a map is a presentation in a single 3D image of the arrival time post-contrast-injection at each pixel (36).
RESULTS
Figures 4 and 5 illustrate results from two volunteer studies of the feet. Both studies were acquired using the identical CAPR acquisition with Rnet = R × RHD = 8 × 1.8 = 14.4, where RHD is the acceleration due to the partial Fourier and homodyne process allowed by the undersampled vane-like pattern in Fig. 2. Results from Fig. 4 were acquired using an eight-element coil, while those in Fig. 5 were acquired using a 12-element coil. In both cases progressive filling of the vasculature is apparent over several consecutive 6.8 sec frames, with the leading edge of the advancing contrast bolus clearly depicted. A supplemental video of the study of Fig. 5 is provided in SV1.
Figure 4.
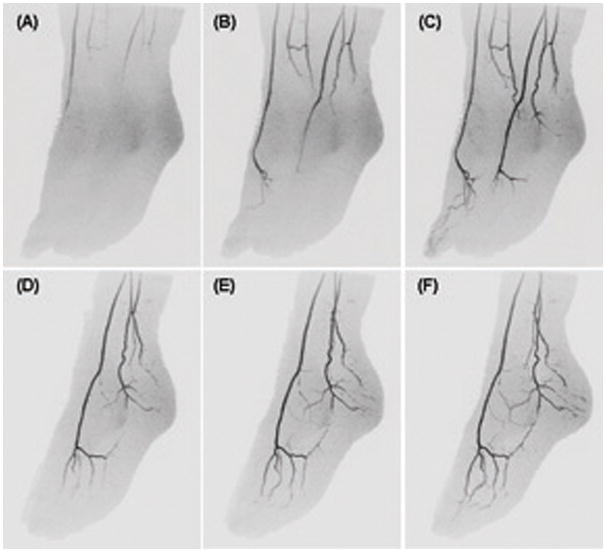
CAPR imaging of the feet of a volunteer acquired with 2D SENSE acceleration R=8 and the eight-element receiver coil. (A) – (C) MIP projection images of the full FOV at approximate 55 degree angulation away from A-P showing progression of contrast material through the arterial vasculature during consecutive 6.8 sec time frames. (D) – (F) MIP projections of the left foot for three more time frames subsequent to (C) shown at respective angulation of 65, 75, and 85 degrees away from A-P illustrating the high isotropic spatial resolution.
Figure 5.
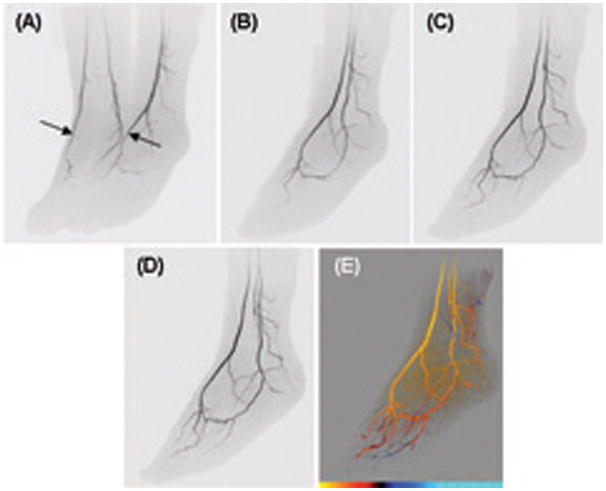
CAPR images of the feet of a volunteer acquired with 2D SENSE acceleration R=8 and a 12-element receiver coil. (A) MIP projection at approximately 45 degrees oblique from A-P. Arterial phase time frame with right and left dorsalis pedis well filled (arrows). Targeted MIPs of left foot from subsequent time frames: (B) 6.8 sec after (A), 60 deg rotation; (C) 13.6 sec after (A), 70 deg rotation; (D) 20.4 sec after (A), 80 deg rotation. (E) Time-of-arrival map of left foot at 80 degree rotation from coronal. For the color scale at the bottom of the image each hash mark denotes an individual 6.8 sec time interval and the leftmost limit corresponds to 27.2 sec post-injection. See also supplemental video SV1.
Figure 6 illustrates results in a patient with diabetes for whom bypass surgery was being considered to improve perfusion of the right great toe to improve healing of a chronic infection.
Figure 6.
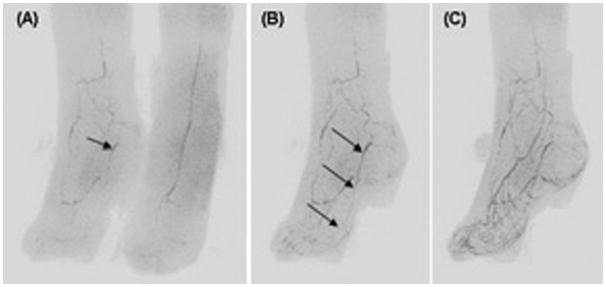
CAPR images from a bilateral foot study of a diabetic patient who was a candidate for a bypass graft procedure to improve perfusion of right great toe secondary to chronic infection. (A) Slightly oblique (17 degree) near-coronal view of both feet at early arterial time frame. Image of right foot shows occluded dorsalis pedis and occluded distal anterior and posterior tibial arteries and partial reconstitution of plantar arteries including a small patent medial plantar artery (arrow). (B) MIP sub-volume of only the right foot at 22 degree angulation, taken from the next frame, 6.8 sec after (A), shows continuity of medial plantar artery identified in (A) to right great toe (arrows). (C). MIP sub-volume of right foot at 30 degree angulation for frame 6.8 sec after (B) already has extensive venous signal, making interpretation difficult, and illustrating the desirability for high spatial and temporal resolution.
Figure 7 shows results from two studies of the hands in the same volunteer. The first was done using the same eight-element receiver coil as for the foot studies of Figs. 4 and 6, with 2D SENSE acceleration of R=8, and net acceleration Rnet=14.4. The second study, performed two days later, was done using a 12-element hand array with R=12 and Rnet=21.6. A supplemental video of this latter study is provided in SV2.
Figure 7.
CAPR images of the hands of a volunteer. Parts A, C, E, G were acquired with 2D SENSE R=8 acceleration, frame time 4.1 sec, and an eight-element coil (Coil #1 of Table 2). Parts B, D, F, H were acquired two days later with 2D SENSE R=12 acceleration, frame time 3.4 sec, and a 12-element receiver coil (Coil #3 of Table 2). A, B: full coronal MIP images after arrival of contrast material in distal digital arteries. C, D: coronal MIPs of left hand for time frame showing contrast arrival in the hand. E, F: MIP images at 30 degree oblique rotation one time frame later than C, D. G, H: MIP images at 60 degree oblique rotation one time frame later than E, F and corresponding to the same time frame as A, B illustrating the high resolution in the slice encoding (A-P) direction. See also supplemental video SV2 made of the study of parts B, D, F, H.
Figure 8 shows results from a bilateral study of the hands of a patient suspected of Raynaud’s syndrome. Images were acquired using the 2D SENSE acceleration R=8 and Rnet =14.4. A TOA map was also generated (Fig. 8E). See also supplemental videos SV3 and SV4.
Figure 8.
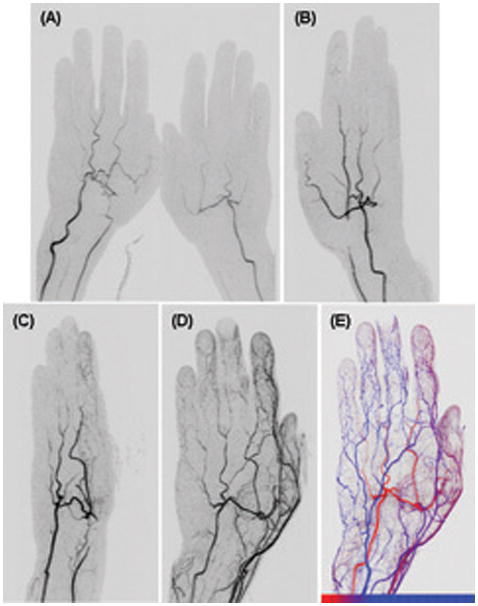
CAPR imaging of the hands of a patient with Raynaud’s phenomenon. (A) Coronal view of both hands at early filling stage. Irregular narrowing of right radial artery is well seen (arrow). Angulated image of the left hand made at subsequent time frames: (B) 40 degree rotation; 4.5 sec after (A). Occlusion of left radial artery is well seen (arrow). (C) 110 degree rotation, 9 sec after (A) illustrating the spatial resolution along the slice encoding direction, approximately left-right in this image. (D) 170 degree rotation, 18 sec after (A) illustrating poor filling of digital arteries, likely due to spasm (arrows). (E) Time-of-arrival map of the left hand shown in an approximate dorsal view. The color scale is shown at the bottom of the image where each hash mark denotes an individual 4.5 sec time interval and the leftmost limit corresponds to 22.5 sec post-injection. See also supplemental videos SV3 and SV4.
DISCUSSION
We have shown how the combination of the three methods of parallel acquisition, multi-element receiver coil arrays, and k-space sampling techniques can be used to generate 3D data sets of the hands and feet which have both high spatial and high temporal resolution. For both regions the FOV used allows simultaneous imaging of both extremities. For the hands, images are formed at update times of 3.4 – 4.5 sec with sub-mm in-plane and 1.0 mm through-plane resolution. For the feet, images are formed at an update time of 6.8 sec with sub-mm resolution in all three directions. The methods were demonstrated in volunteer and patient studies. At these levels of high spatial and temporal resolution, it was possible to readily perceive time-dependent phenomena in the arterial vasculature without noticeable venous contamination. Examples included differences in left vs. right arrival of contrast, asymmetric filling patterns, and dorsalis pedis vs. plantar artery dominance in the feet.
The first method exploited, parallel acquisition, improves the speed by allowing the requisite k-space samples to be measured in a shorter time. In this work both 2D SENSE and 2D homodyne techniques were used. The SENSE accelerations were R=8 or 12, and when combined with the acceleration typically provided by homodyne, RHD=1.8, yielded a net acceleration Rnet=14.4 to 21.6.
The second method, exploiting receiver coils, preserves the signal-to-noise ratio (SNR) which is otherwise lost by acceleration techniques due to both a reduction in the number of kY-kZ samples used for reconstruction and the noise amplification intrinsic to the reconstruction process (37). For this work an array having eight or more elements was placed circumferentially around the targeted anatomy, hands or feet. This arrangement has been shown previously (33) to provide good SNR and to have mean g-factors only slightly larger than unity, thereby controlling the noise amplification alluded to above. Results generated for R=8 were routinely deemed to have more than adequate SNR, even when only eight coil elements were used. For the one case in which R=12 SENSE acceleration was performed using 12 elements (Figs. 7b, d, f, h), the SNR was still considered more than adequate for diagnosis. In addition to the receiver coils, another factor contributing to the retention of the SNR is the signal enhancement effect intrinsic to accelerated CE-MRA by which the peak contrast-enhanced signal is present over a greater extent of k-space due to the acceleration process (38).
The third method used was the CAPR k-space sampling technique. This makes use of view sharing, elliptical centric view ordering, and more frequent updating of the k-space center. Moreover, the sorting of the acquired data is designed to provide temporally compact sampling of the k-space center and consistent sampling of k-space from frame to frame. These qualities have been shown to provide sharp depiction of the contrast bolus leading edge, accurate depiction of the velocity of the advancing contrast bolus, good lateral resolution across the contrast-enhanced vessel lumen, and small “anticipation” artifact in advance of the contrast bolus (32). The sequence is flexible, allowing tradeoffs in spatial and temporal resolution and other factors, as illustrated in the range of parameter sets in Table 3. In contrast to the CAPR method, keyhole acquisition (21, 39) uses an extended temporal footprint by which high spatial frequency information is sampled long (ca. 50 sec or more) after the central views are sampled. This can lead to degraded spatial resolution if the arterial signal has waned over the interim or artifactual venous signal if the veins are contrast-filled during the sampling of the high spatial frequency views.
We believe the patient studies presented in Figures 6 and 8 are illustrative of the potential clinical value of the method. For the study in Fig. 6, the method allowed identification of a patent, reconstituted native right medial plantar artery in a diabetic patient who had a major perfusion defect of the right great toe. Based on this CE-MRA study this artery was chosen as the target site of distal anastomosis for a bypass graft, and the patient has subsequently done well post-surgery. The CE-MRA study of Fig. 8 allowed visualization of more subtle abnormalities of the digital arteries and right radial artery in addition to the more obvious left radial artery occlusion.
This work suggests further areas of investigation. For the hands in particular the small frame time (3.4 – 4.5 sec) and temporal footprint (12.5 – 16.0 sec) might allow a reduced duration of contrast. Cursory analysis of the signal curves in the hand studies presented indicates that, although variable from subject to subject, the arterial signal is within 80% of peak for four time frames or more, i.e. a time more than adequate to allow formation of an image with the full sampling resolution. This suggests that a smaller injection duration may be allowed, permitting smaller contrast dose at the same injection rate or an increased injection rate with no dose reduction for possible higher signal. Another possible area of study is the use of the acquisition technique with an intravascular contrast agent. Such an agent might allow images with increased SNR at lower contrast dose due to the higher T1 relaxivity. Such studies have been done previously but not at the levels of acceleration used here (15, 23).
This study has limitations. Perhaps the principal one is that rather than being a prospective study of the imaging capabilities of the technique in a specific patient population with independent corroboration using another imaging procedure such as DSA, this was primarily a study of feasibility. However, we believe that the quality of results we have demonstrated in volunteers and the specific findings in the two patient studies illustrate the potential of the method and the rationale and justification for a more detailed clinical study.
In conclusion, we have shown that 3D CE-MRA image sets with spatial resolution of 1 mm or finer can be generated with frame times of about 3.5 sec for the hands and 6.8 sec for the feet. For each region the temporal footprint is approximately four times longer than the frame time. The principal technical enablers are specific methods for sampling k-space, techniques for 2D acceleration of ten-fold or higher, and multi-element coil arrays placed circumferentially around the targeted region.
Supplementary Material
Supplemental Video #1 (SV1)
Video of full FOV of study illustrated in Figure 5. Rotation time of video corresponds to approximately one 6.8 sec frame time.
Supplemental Video #2 (SV2)
Video of full FOV of R = 12 study illustrated in Figure 7B, D, F, H
Supplemental Video #4 (SV4)
Video of 3D time-of-arrival map from left hand from study of Figure 8.
Table 1b.
Summary of performance parameters for contrast-enhanced MR angiography of the feet.
| No. | Investigator (Reference) Year | Voxel Dimensions (each in mm) | Voxel Volume (mm3) | Frame Time (sec) | Notes |
|---|---|---|---|---|---|
| 1 | Kreitner (16) 2000 | 1.12 × 1.69 × 2.25 | 4.26 | 18 | |
| 2 | Kreitner (16) 2000 | 0.76 × 1.48 × 2.25 | 2.53 | 25 | |
| 3 | Sharafuddin (17) 2002 | 2.22 × 0.37 × 2.5 | 2.05 | 22.5 | 1 |
| 4 | Cronberg (18) 2003 | 0.59 × 0.59 × 2.25 | 0.78 | 32 | 1 |
| 5 | Chomel (19) 2004 | 1.67 × 1.67 × 1.67 | 4.66 | 52 | |
| 6 | Kreitner (20) 2008 | 1.0 × 1.0 × 2.2 | 2.20 | 24 | |
| 7 | Ruhl (21) 2008 | 0.8 × 0.8 × 1.6 | 1.02 | 3.9 (tens of sec) | 2, 4 |
| 8 | Kos (22) 2009 | 0.9 × 0.9 × 0.9 | 0.73 | 24 | 1, 2, 3 |
| 9 | Rohrl (23) 2009 | 1.0 × 1.0 × 0.9 | 0.90 | 36 | 1, 2 |
| 10 | Lim (24) 2010 | 1.0 × 1.6 × 1.7 | 2.72 | 6.4 (18.6) | 4 |
| 11 | Haider (this work) | 0.75 × 0.75 × 0.9 | 0.51 | 6.8 (25.0) | 4 |
Notes:
Stated voxel dimensions are after interpolation or zero filling in one or more directions. Sampling resolution is coarser than values shown.
Unilateral acquisition
Cuff compression used to delay venous return.
For these studies the temporal footprint, or acquisition time for a fully sampled image, is longer than the frame time because of view sharing, and is shown in parentheses.
Acknowledgments
Grant Support: NIH EB000212, HL070620, RR018898
We would like to acknowledge the assistance of Kathy J. Brown.
References
- 1.Prince MR, Yucel EK, Kaufman JA, Harrison DC, Geller SC. Dynamic gadolinium-enhanced 3D abdominal MR arteriography. J Magn Reson Img. 1993;3:877–881. doi: 10.1002/jmri.1880030614. [DOI] [PubMed] [Google Scholar]
- 2.Earls JP, Rofsky NM, DeCorato DR, Krinsky GA, Weinreb JC. Hepatic arterial-phase dynamic gadolinium-enhanced MR imaging: optimization with a test examination and a power injector. Radiology. 1997;202:268–273. doi: 10.1148/radiology.202.1.8988222. [DOI] [PubMed] [Google Scholar]
- 3.Foo TKF, Saranathan M, Prince MR, Chenevert TL. Automated detection of bolus arrival and initiation of data acquisition in fast, three-dimensional, gadoliuium-enhanced MR angiography. Radiology. 1997;203:275–280. doi: 10.1148/radiology.203.1.9122407. [DOI] [PubMed] [Google Scholar]
- 4.Wilman AH, Riederer SJ, King BF, Debbins JP, Rossman PJ, Ehman RL. Fluoroscopically-triggered contrast-enhanced three-dimensional MR angiography with elliptical centric view order: application to the renal arteries. Radiology. 1997;205:137–146. doi: 10.1148/radiology.205.1.9314975. [DOI] [PubMed] [Google Scholar]
- 5.Wilman AH, Riederer SJ. Improved centric phase encoding orders for three dimensional magnetization prepared MR angiography. Magn Reson Med. 1996;36:384–392. doi: 10.1002/mrm.1910360309. [DOI] [PubMed] [Google Scholar]
- 6.Prince MR, Grist TM, Debatin JF. 3D Contrast MR Angiography. Berlin: Springer; 2003. [Google Scholar]
- 7.Prince MR, Chabra SG, Watts R, et al. Contrast material travel times in patients undergoing peripheral MR angiography. Radiology. 2002;224:55–61. doi: 10.1148/radiol.2241011338. [DOI] [PubMed] [Google Scholar]
- 8.Winterer JT, Scheffler K, Paul G, et al. Optimization of contrast-enhanced MR angiography of the hands with a timing bolus and elliptically reordered 3D pulse sequence. J Comput Assist Tomogr. 2000;24:903–908. doi: 10.1097/00004728-200011000-00017. [DOI] [PubMed] [Google Scholar]
- 9.Goldfarb JW, Hochman MG, Kim DS, Edelman RR. Contrast-enhanced MR angiography and perfusion imaging of the hand. AJR. 2001;177:1177–1182. doi: 10.2214/ajr.177.5.1771177. [DOI] [PubMed] [Google Scholar]
- 10.Connell DA, Koulouris G, Thorn DA, Potter HG. Contrast-enhanced MR angiography of the hand. RadioGraphics. 2002;22:583–599. doi: 10.1148/radiographics.22.3.g02ma16583. [DOI] [PubMed] [Google Scholar]
- 11.Wentz KU, Frohlich JM, von Weymarn C, Patak MA, Jenelten R, Zollikofer CL. High-resolution magnetic resonance angiography of hands with timed arterial compression (tac-MRA) The Lancet. 2003;361:49–50. doi: 10.1016/S0140-6736(03)12112-5. [DOI] [PubMed] [Google Scholar]
- 12.Gluecker TM, Bongartz G, Ledermann HP, Bilecen D. MR angiography of the hand with subsystolic cuff-compression optimization of injection parameters. AJR. 2006;187:905–910. doi: 10.2214/AJR.05.1007. [DOI] [PubMed] [Google Scholar]
- 13.Brauck K, Maderwald S, Vogt FM, Zenge M, Barkhausen J, Herborn CU. Time-resolved contrast-enhanced magnetic resonance imaging of the hand with parallel imaging and view sharing: initial experience. Eur Radiol. 2007;17:183–192. doi: 10.1007/s00330-006-0275-5. [DOI] [PubMed] [Google Scholar]
- 14.Winterer JT, Moske-Eick O, Markl M, Frydrychowicz A, Bley TA, Langer M. Bilateral ce-MR angiography of the hands at 3.0 and 1.5 T: intraindividual comparison of quantitative and qualitative image parameters in healthy volunteers. Eur Radiol. 2008;18:658–664. doi: 10.1007/s00330-007-0800-1. [DOI] [PubMed] [Google Scholar]
- 15.Reisinger C, Gluecker T, Jacob AL, Bongartz G, Bilecen D. Dynamic magnetic resonance angiography of the arteries of the hand. A comparison between an extracellular and intravascular contrast agent. Eur Radiol. 2009;19:495–502. doi: 10.1007/s00330-008-1149-9. [DOI] [PubMed] [Google Scholar]
- 16.Kreitner K-F, Kalden P, Neufang A, et al. Diabetes and peripheral arterial occlusive disease: prospective comparison of contrast-enhanced three-dimensional MR angiography with conventional digital subtraction angiography. AJR. 2000;174:171–179. doi: 10.2214/ajr.174.1.1740171. [DOI] [PubMed] [Google Scholar]
- 17.Sharafuddin MJ, Stolpen AH, Shiliang S, et al. High-resolution multiphase contrast-enhanced three-dimensional MR angiography compared with two-dimensional time-of-flight MR angiography for the indentification of pedal vessels. J Vasc Interv Radiol. 2002;13:695–702. doi: 10.1016/s1051-0443(07)61846-6. [DOI] [PubMed] [Google Scholar]
- 18.Cronberg CN, Sjoberg S, Albrechtsson U, et al. Peripheral arterial disease: contrast-enhanced 3D MR angiography of the lower leg and foot compared with conventional angiography. Acta Radiologica. 2003;44:59–66. [PubMed] [Google Scholar]
- 19.Chomel S, Douek P, Moulin P, Vaudoux M, Marchand B. Contrast-enhanced MR angiography of the foot: anatomy and clinical application in patients with diabetes. AJR. 2004;182:1435–1442. doi: 10.2214/ajr.182.6.1821435. [DOI] [PubMed] [Google Scholar]
- 20.Kreitner K-F, Kunz PR, Herber S, Martenstein S, Dorweiler B, Dueber C. MR angiography of the pedal arteries with gadobenate dimeglumine, a contrast agent with increased relaxivity, and comparison with selective intraarterial DSA. J Magn Reson Imag. 2008;27:78–85. doi: 10.1002/jmri.21226. [DOI] [PubMed] [Google Scholar]
- 21.Ruhl KM, Katoh M, Langer S, et al. Time-resolved 3D MR angiography of the foot at 3 T in patients with peripheral arterial disease. AJR. 2008;190:W360–W364. doi: 10.2214/AJR.07.2545. [DOI] [PubMed] [Google Scholar]
- 22.Kos S, Riesinger C, Aschwanden M, Bongartz GM, Jacob AL, DB Pedal angiography in peripheral arterial occlusive disease: first-pass IV contrast-enhanced MR angiography with blood pool contrast medium versus intraarterial digital subtraction angiography. AJR. 2009;192:775–784. doi: 10.2214/AJR.08.1384. [DOI] [PubMed] [Google Scholar]
- 23.Rohrl B, Kunz RP, Oberholzer K, et al. Gadofosveset-enhanced MR angiography of the pedal arteries in patients with diabetes mellitus and comparison with selective intraarterial DSA. Eur Radiol. 2009;19:2993–3001. doi: 10.1007/s00330-009-1501-8. [DOI] [PubMed] [Google Scholar]
- 24.Lim RP, Jacob JS, Hecht EM, et al. Time-resolved lower extremity MRA with temporal interpolation and stochastic spiral trajectories: preliminary clinical experience. J Magn Reson Imag. 2010;31:663–672. doi: 10.1002/jmri.22108. [DOI] [PubMed] [Google Scholar]
- 25.Lee HM, Wang Y, Sostman HD, et al. Distal lower extermity arteries: evaluation with two-dimensional MR digital subtraction angiography. Radiology. 1998;207:505–512. doi: 10.1148/radiology.207.2.9577502. [DOI] [PubMed] [Google Scholar]
- 26.Khilnani NM, Winchester PA, Prince MR, et al. Peripheral vascular disease: combined 3D bolus chase and dynamic 2D MR angiography compared with x-ray angiography for treatment planning. Radiology. 2002;224:63–74. doi: 10.1148/radiol.2241010415. [DOI] [PubMed] [Google Scholar]
- 27.Weiger M, Pruessmann KP, Boesiger P. 2D SENSE for faster 3D MRI. Magma. 2002;14:10–19. doi: 10.1007/BF02668182. [DOI] [PubMed] [Google Scholar]
- 28.Haider C, Glockner J, Stanson A, Riederer S. High temporal spatial resolution time-resolved 3D CE-MRA of the hands and feet. 17th Mtg ISMRM; Honolulu, HI. 2009. p. 271. [Google Scholar]
- 29.Haider CR, Hu HH, Campeau NG, Huston J, III, Riederer SJ. 3D high temporal and spatial resolution contrast-enhanced MR angiography of the whole brain. Magn Reson Med. 2008;60:749–760. doi: 10.1002/mrm.21675. [DOI] [PMC free article] [PubMed] [Google Scholar]
- 30.MacFall JR, Pelc NJ, Vavrek RM. Correction of spatially dependent phase shifts for partial Fourier imaging. Magn Reson Imaging. 1988;6:143–155. doi: 10.1016/0730-725x(88)90444-4. [DOI] [PubMed] [Google Scholar]
- 31.Noll DC, Nishimura DG, Macovski A. Homodyne detection in magnetic resonance imaging. IEEE Trans Med Img. 1991;10(2):154–163. doi: 10.1109/42.79473. [DOI] [PubMed] [Google Scholar]
- 32.Mostardi PM, Haider CR, Rossman PJ, Borisch EA, Riederer SJ. Controlled experimental study depicting moving objects in view-shared time-resolved MRA. Magn Reson Med. 2009;62:85–95. doi: 10.1002/mrm.21993. [DOI] [PMC free article] [PubMed] [Google Scholar]
- 33.Haider CR, Glockner JF, Stanson AW, Riederer SJ. Peripheral vasculature: high-temporal and high-spatial-resolution three-dimensional contrast-enhanced MR angiography. Radiology. 2009;253:831–843. doi: 10.1148/radiol.2533081744. [DOI] [PMC free article] [PubMed] [Google Scholar]
- 34.Bernstein MA, Fain SB, Riederer SJ. Effect of zero-filling and windowing of MRI data on spatial resolution and acquisition strategy. J Magn Reson Imaging. 2001;14:270–280. doi: 10.1002/jmri.1183. [DOI] [PubMed] [Google Scholar]
- 35.Borisch EA, Grimm RC, Rossman PJ, Haider CR, Riederer SJ. Real-time high-throughput scalable MRI reconstruction via cluster computing. 16th Mtg, ISMRM; Toronto ON Canada. 2008. p. 1492. [Google Scholar]
- 36.Riederer SJ, Haider CR, Borisch EA. Time-of-arrival mapping at three-dimensional time-resolved contrast-enhanced MR angiography. Radiology. 2009;253:532–542. doi: 10.1148/radiol.2532082322. [DOI] [PMC free article] [PubMed] [Google Scholar]
- 37.Pruessmann KP, Weiger M, Scheidegger MB, Boesiger P. SENSE: sensitivity encoding for fast MRI. Magn Reson Med. 1999;42:952–962. [PubMed] [Google Scholar]
- 38.Riederer SJ, Hu HH, Kruger DG, Haider CR, Campeau NG, Huston J., III Intrinsic signal amplification in the application of 2D SENSE parallel imaging to 3D contrast-enhanced elliptical centric MRA and MRV. Magn Reson Med. 2007;58:855–864. doi: 10.1002/mrm.21282. [DOI] [PMC free article] [PubMed] [Google Scholar]
- 39.van Vaals JJ, Brummer ME, Dixon WT, et al. “Keyhole” method for accelerating imaging of contrast agent uptake. J Magn Reson Imaging. 1993;3:671–675. doi: 10.1002/jmri.1880030419. [DOI] [PubMed] [Google Scholar]
Associated Data
This section collects any data citations, data availability statements, or supplementary materials included in this article.
Supplementary Materials
Supplemental Video #1 (SV1)
Video of full FOV of study illustrated in Figure 5. Rotation time of video corresponds to approximately one 6.8 sec frame time.
Supplemental Video #2 (SV2)
Video of full FOV of R = 12 study illustrated in Figure 7B, D, F, H
Supplemental Video #4 (SV4)
Video of 3D time-of-arrival map from left hand from study of Figure 8.


