Abstract
Nonmuscle myosins are widely distributed and play important roles in the maintenance of cell morphology and cytokinesis. In this study, we compare the detailed kinetic and functional characterization of naturally occurring transcript variants of the motor domain of human nonmuscle myosin heavy chain (NMHC)-2C. NMHC-2C is alternatively spliced both in loop-1 and loop-2. Isoform 2C0 contains no inserts in either of the loops and represents the shortest isoform. An 8-amino acid extension in the loop-1 region is present in isoforms 2C1 and 2C1C2. Isoform 2C1C2 additionally displays a 33-amino acid extension in the loop-2 region. Transient kinetic experiments indicate increased rate constants for F-actin binding by isoform 2C1C2 in the absence and presence of nucleotide, which can be attributed to the loop-2 extension. ADP binding shows only minor differences for the three transcript variants. In contrast, larger differences are observed for the rates of ADP release both in the absence and presence of F-actin. The largest differences are observed between isoforms 2C0 and 2C1C2. In the absence and presence of F-actin, isoform 2C1C2 displays a 5–7-fold increase in ADP affinity. Moreover, our results indicate that the ADP release kinetics of all three isoforms are modulated by changes in the concentration of free Mg2+ ions. The greatest responsiveness of the NMHC-2C isoforms is observed in the physiological range from 0.2 to 1.5 mm free Mg2+ ions, affecting their duty ratio, velocity, and tension-bearing properties.
Keywords: Actin, Cytoskeleton, Molecular Motors, Myosin, Presteady-state kinetics
Introduction
Myosins form a large family of structurally diverse actin-based molecular motors driving a multitude of biological processes, such as muscle contraction, endocytosis events, and cytokinesis (1). Until now, ∼38 genes encoding human myosin heavy chains have been identified and organized into 12 classes (1). Myosin class 2 forms the largest group with several subfamilies, including skeletal, cardiac, smooth muscle, and nonmuscle myosins (1). Cytoplasmic nonmuscle myosins are among the most prevalent myosins and are expressed in a spatially and developmentally dependent manner (2–4). As multifunctional motors, nonmuscle myosins participate in processes like cell migration, cellular remodeling, and cytokinesis (5–8). Three distinct nonmuscle myosin heavy chains are reported in humans as follows: nonmuscle myosin heavy chain (NMHC)2-2A, NMHC-2B, and NMHC-2C.
At the protein level, all nonmuscle myosin heavy chains have a basic domain architecture consisting of three structural units as follows: a catalytic motor domain, a neck domain consisting of two IQ motifs that bind the regulatory as well as the essential light chain, and a rod-like tail domain that forms an α-helical coiled-coil (9, 10). The presence of the extended coiled-coil region promotes self-association into short bipolar filaments (11, 12). These filaments power interactions with actin filaments producing force, driving directed movement, and maintaining tension forces. Despite their high degree of homology in amino acid sequence, nonmuscle myosin isoforms seem to have unique as well as redundant functions in the cell (5, 7, 13, 14). Despite their broad tissue distribution, immunomorphological and immunolocalization studies show isoform-specific expression patterns, expression levels, and as a consequence cell type- and tissue-specific differences in the relative abundances of NMHC-2C isoforms (2, 15). The three isoforms can, to a certain extent, substitute for each other in vivo and in vitro (13, 14). In contrast to NMHC-2A and -2B, NMHC-2C shows low expression in early development and is more abundant in adult tissues (2, 15). In mice, ablation of NMHC-2A or -2B causes embryonic lethality, whereas ablation of NMHC-2C leads to no obvious phenotype (15–17). These observations raise questions about the extent to which the individual nonmuscle myosin isoforms display kinetic and functional differences. The kinetic properties of human NMHC-2A and -2B have been characterized in detail (18, 19), but little information is available for NMHC-2C. Therefore, this study focuses on the distinct kinetic and mechanical properties of human NMHC-2C splice variants, as expressed by their uninhibited motor domains.
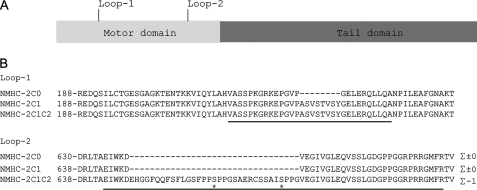
Alternative spicing of the MYH14 gene leads to the production of at least four splice variants in humans (2, 20, 21). The putative amino acid sequences between the motor domains of the transcript variants are well conserved with an identity of 96–99%. Differences in amino acid sequence are only known to occur in the functionally important surface loops, loop-1 and -2. Isoform 2C1 differs by an 8-amino acid extension of loop-1. Isoform 2C1C2 has the same extension of loop-1 and an additional 33-amino acid extension in loop-2. Isoform 2C0 represents the shortest isoform without loop extensions (Fig. 1). Previous studies have shown that loop-1, in close proximity to the nucleotide binding pocket, and loop-2, forming part of the actin binding region, have a modulating effect on the functional and kinetic properties of the myosin motor (22–26). Whereas loop-1 has been implicated in determining the rate of ADP release and the in vitro sliding velocity (27), loop-2 is thought to affect actin binding and coupling between the nucleotide- and actin-binding sites (22, 28).
FIGURE 1.
A, schematic representation of human NMHC-2C showing the localization of loop-1 and loop-2 in the catalytically active motor domain. B, sequence alignment of the alternatively spliced loop-1 and -2 regions of human NMHC-2C isoforms (GenBankTM accession numbers NP_079005 (NMHC-2C0), NP_001070654 (NMHC-2C1), and NP_001139281 (NMHC-2C1C2)). Loop-1 and loop-2 consensus sequences are noted by underlines according to Golomb et al. (2). The 8-amino acid insertion in loop-1 of isoforms NMHC-2C1 and NMHC-2C1C2 increases the length of the loop. In contrast, the presence of the expanded loop-2 region in isoform NMHC-2C1C2 reduces the net charge of the surface loop to −1 when compared with NMHC-2C and -C1 (net charge 0). The net charge was calculated based on the assumption that the loop-2 sequence is a linear array of charged and uncharged residues. A value of +1 was assigned to positively charged amino acids (lysine and arginine), and a value of −1 was assigned to negatively charged amino acids (glutamic acid and aspartic acid). The remaining amino acids were assigned zero charge. The serine residues indexed with an asterisk in the loop-2 region of NMHC-2C1C2 are potential phosphorylation sites as determined by KinasePhos (61).
The basic reaction pathway for the catalyzed by myosin-dependent ATP hydrolysis and turnover is schematically depicted in Scheme 1. interpretation of kinetic constants throughout this work. Although the pathway through the cycle is well conserved for all myosin isoforms, individual rate and equilibrium constants are highly variable and have direct impact on the enzymology and the cellular functions of the motor.
SCHEME 1.
To elucidate the effect of the alternatively spliced surface loops in fine-tuning human NMHC-2C motor activity, we used both steady-state and transient kinetic techniques. We investigated the effect of changes in the concentration of free Mg2+ ions on the ADP kinetics of actomyosin, the overall steady-state ATPase activity, and the in vitro sliding velocity. The observation that physiological changes in the concentration of free Mg2+ ions can modulate NMHC-2C motor activity suggests a regulatory role for the underlying mechanism.
EXPERIMENTAL PROCEDURES
Reagents
Standard chemicals and TRITC-phalloidin were purchased from Sigma; His antibody and Ni2+-nitrilotriacetic acid were from Qiagen; enzymes, restriction enzymes, and polymerases were purchased from Roche Applied Science, Sigma, MBI-Fermentas, and Finnzymes. Protease inhibitor mixture tablets (complete, EDTA-free) were from Roche Applied Science.
Construction of Baculovirus Transfer Vectors
An expression cassette was designed that encodes amino acids 1–799 of the motor domain of human NMHC-2C0 fused to an artificial lever arm consisting of two rigid spectrin-like repeats from Dictyostelium discoideum α-actinin. A C-terminal octahistidine tag was added to facilitate purification of the recombinant protein. The expression plasmid was synthesized by Eurofins-MWG-Operon (Ebersberg, Germany), with an optimized codon usage for the expression in the baculovirus/Sf9 system and subcloned into the expression vector pFastBac1 (Invitrogen). The plasmid was verified by double strand sequencing.
Cloning of isoform 2C1 was performed by inserting the 8-amino acid extension in loop-1 by site-directed mutagenesis (forward primer, P-ACC GTG TCT TAT GGG AAT TGG AAC GCC AAC TG, and reverse primer, P-GCT GAC GGA GGC GGG GAC ACC GGG TTC TTT TCG) using the synthesized plasmid as template. The coding sequence of the insertion in loop-2 was introduced via a two-step PCR approach (forward primer 1, P-AGC TCT GCT ATT TCT CCG CCA GGG GTC GAA GGA ATT GTA GGA CTG, and reverse primer 1, P-GAG AAC TGC TGG AAG CCC CCA TGT TCA TCC TTC CAG ATT TCG GCG; forward primer 2, P-CCC CCA GGA TCT GCA GAG AGG TGC AGC TCT GCT ATT TCT CCG CC, and reverse-primer 2, P-CGA CGG TGG GAA GGA GCC AAG GAA AGA GAA CTG CTG GAA GCC CCC). After confirmation by DNA sequencing, all expression vectors were used to generate recombinant bacmid.
Production and Preparation of Recombinant Proteins
The myosin motor domain constructs were overproduced in the baculovirus/Sf9 system. Therefore, the transfer vectors were transformed in DH10Bac Escherichia coli cells to generate recombinant bacmid. Recombinant bacmid was isolated and transfected in Sf9 insect cells using Cellfectin II (Invitrogen). Recombinant baculovirus was produced as described by the manufacturer. Sf9 cells were infected with recombinant baculovirus, collected 72 h post-infection, and stored at −80 °C.
For purification, cells were lysed (50 mm HEPES (pH 7.3), 300 mm NaCl, 3 mm MgCl2, 2 mm ATP, 10 mm β-mercaptoethanol, 4 mm imidazole, in the presence of protease inhibitors) and ultracentrifuged (138,000 × g, 35 min), and the extract was applied to a Ni2+ affinity column. The resin was washed with ATP buffer (25 mm HEPES (pH 7.3), 600 mm NaCl, 0.5 mm ATP, 0.1 mm EGTA, 3 mm MgCl2, 20 mm imidazole, 7 mm β-mercaptoethanol, 1% Triton X-100), wash buffer 1 (25 mm HEPES (pH 7.3), 300 mm NaCl, 0.1 mm EGTA, 3 mm MgCl2, 40 mm imidazole), and wash buffer 2 (25 mm HEPES (pH 7.3), 500 mm NaCl, 0.1 mm EGTA, 3 mm MgCl2, 65 mm imidazole). The protein was eluted using an imidazole gradient (100–850 mm) and dialyzed against 25 mm HEPES (pH 7.3), 400 mm NaCl, 1 mm EGTA, 1 mm EDTA, 1 mm DTT, and 3% trehalose. After gel filtration (column Superdex 26/60–200 preparation grade, Amersham Biosciences), the protein was supplemented with 10% trehalose, flash-frozen, and stored at −80 °C.
Active site titration in the absence of F-actin using mant-ATP as a substrate was employed to determine the concentration of active myosin motors. Active site titration in the absence of F-actin using mant-ATP as a substrate was employed to determine the concentration of active myosin motors. The active motor concentration was typically ∼30–40%. Concentrations reported in figure legends and throughout the text are final active site concentrations.
Rabbit skeletal muscle actin was prepared as described by Lehrer and Kerwar (29) and labeled with pyrene iodoacetamide as described previously by Criddle et al. (30). TRITC-phalloidin labeling was carried out as reported previously (31).
Kinetic Measurements
Steady-state kinetics were performed at 25 °C with the NADH-coupled assay in a buffer containing 25 mm HEPES (pH 7.4), 5 mm MgCl2, 0.5 mm DTT, 0.2 mm NADH, and an ATP regeneration system consisting of 0.05 mg/ml pyruvate kinase, 0.5 mm phosphoenolpyruvate, 0.02 mg/ml lactate dehydrogenase, 2 mm ATP. The myosin concentration was 0.3 μm. F-actin concentration was adjusted between 0 and 140 μm. NADH oxidation was followed using the change in the absorption at 340 nm (ϵ = 6220 m−1 cm−1) in a temperature controlled plate reader (Multiscan FC, Thermo Scientific) using UV-transparent microtiter plates. The ATPase activity in the absence of F-actin was subtracted from the actomyosin ATPase.
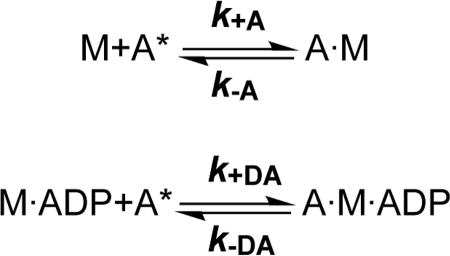
Stopped-flow techniques were employed to study the interaction of myosin with nucleotides and F-actin. The data were analyzed in terms of the model shown in Scheme 1 according to Bagshaw et al. (32). The upper line in Scheme 1 represents the actin-dissociated pathway with the events ATP binding, ATP hydrolysis, and product release. The equivalent steps for the actin-associated pathway are depicted in the lower line in Scheme 1. The predominant flux of the reaction pathway is highlighted in gray in Scheme 1. The notation for the description of the kinetic parameters distinguishes between the constants in Scheme 1 in the presence and absence of F-actin by using boldface (k+1 and K1) versus normal type (k+1 and K1); subscripts A and D refer to actin (KA) and ADP (KD), respectively. KA represents the affinity of myosin for F-actin, KD the affinity of ADP for myosin, KAD the affinity of ADP for the actomyosin complex, and KDA the affinity of actin for myosin in the presence of saturating [ADP]. M refers to myosin and Pi to inorganic phosphate. The asterisk in Scheme 1 represents different conformational states of the myosin motor domain and correlates with the intensity of the intrinsic protein fluorescence.
Transient kinetic assays were performed at 20 °C with a Hi-Tech Scientific SF-61SX2 stopped-flow system equipped with a 75-watt mercury-xenon arc lamp in MOPS buffer (25 mm MOPS (pH 7.0), 100 mm KCl). Magnesium concentrations were adjusted by supplementing MgCl2 to the MOPS buffer. The concentration of free Mg2+ ions was calculated using Maxchelator software as described previously (33).
Pyrene fluorescence was excited at 365 nm and monitored through a KV389 cutoff filter. Intrinsic tryptophan fluorescence was excited at 297 nm, and emission was selected using a WG320 cutoff filter. Mant analogues of ATP or ADP were excited either directly at 365 nm or excited via energy transfer from tryptophan (excitation at 297 nm), and the emitted light was detected after passage through a KV389 cutoff filter. Data storage and initial fitting were performed using the software Kinetic Studio 1.08 (TgK Scientific, Bradford on Avon). Unless stated otherwise, the reactant concentrations stated throughout the text are those after 1:1 mixing in the stopped-flow spectrophotometer.
Direct Functional Assays
Actin sliding motility was assayed as described previously (34) in buffer containing 25 mm imidazole (pH 7.4), 25 mm KCl, 1 mm MgCl2, 1 mm EGTA, 4 mm ATP, and an oxygen-scavenging system consisting of 0.1 mg/ml glucose oxidase, 0.02 mg/ml catalase, and 5 mg/ml glucose. Myosin motor domain constructs were specifically attached to the nitrocellulose-coated coverslips via a penta-His antibody (35). The experiment was performed at 30 °C with an Olympus IX70 microscope. The velocity of actin filament sliding was tracked with the program DiaTrack 3.01 (Semasopht, Switzerland), and data analysis was performed with Origin 8.0 (OriginLab). Goodness-of-fit criteria were evaluated using the coefficient of determination R2 and χ2 tests as implemented in Origin 8.0.
RESULTS
Design, Expression, and Purification of NMHC-2C Motor Domain Constructs
For the kinetic and mechanical studies discussed below, we designed and produced single-headed recombinant NMHC-2C constructs containing the catalytically active motor domain of the isoforms fused to an artificial lever arm. The artificial lever arm includes two rigid spectrin-like repeats from D. discoideum α-actinin and functionally replaces the native light chain binding region (34, 36). The concept of fusing the myosin motor domain to an artificial lever arm facilitates the characterization of the motor properties and was successfully demonstrated for myosins of different classes from various species in cellular, mechanical, and kinetic studies (37–39). Light chain binding domain-mediated regulation is observed only with double-headed constructs. When double-headed constructs are used, the light chain binding domain of NMHC-2C has been observed to exert an inhibitory effect on isoforms lacking the C2 insert. In the case of isoform NMHC-2C1, the inhibition mediated by the light chain binding domain needs to be overcome by MLC20 phosphorylation for both maximum actin-activated Mg-ATPase activity and maximum in vitro motility (21). Therefore, the rate constants and motile activity observed with the single-headed motor domain constructs with artificial lever arm used here reflected the activity of the fully activated enzyme.
Steady-state ATPase Activity
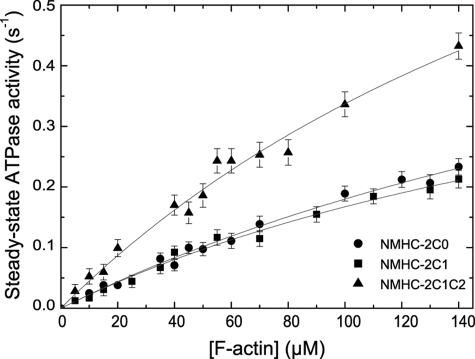
The enzymatic activity of NMHC-2C isoforms in the absence of F-actin revealed that isoforms 2C1 and 2C1C2 (both 0.08 ± 0.01 s−1) show slightly elevated levels of the basal ATPase activity (kbasal) when compared with 2C0 (0.06 ± 0.01 s−1). Fig. 2 depicts the steady-state ATPase activity of NMHC-2C isoforms as a function of [F-actin]. All isoforms showed an increase in activity upon addition of F-actin. However, the highest actin concentration experimentally accessible for this type of measurement is with 140 μm F-actin, clearly lower than Kapp. Therefore, the individual values kcat and Kapp are only estimates and must be treated with some caution. As the Kapp values obtained for single-headed constructs tend to be significantly higher than those obtained with double-headed constructs (40), the Kapp values for the native NMHC-2C isoforms can be expected to be more similar to 4.6, 10.9, and 3.8 μm measured for the activated heavy meromyosin constructs of mouse NMHC-2 isoforms C0, C1, and C1C2 (21). The apparent second-order rate constant kcat/Kapp is well defined by the initial slope of the ATPase activity versus [F-actin] plot, and the values obtained reflect the behavior of the fully activated isoforms (Fig. 2). In comparison with 2C0 and 2C1, the transcript variant 2C1C2 displays a 2-fold increased value of kcat/Kapp = 0.0050 ± 0.0005 μm−1 s−1, indicating stronger communication between the nucleotide-binding site and the actin-binding region (Table 1).
FIGURE 2.
Actin-activated steady-state ATPase activity of human nonmuscle myosin-2C isoforms. The ATPase activities were determined with the NADH-coupled assay in the presence of an ATP-regenerating system. The resulting activities were plotted against [F-actin] and fitted to the Michaelis-Menten equation. Maximal activities of >0.23, >0.21, and >0.43 s−1 were approximated at 140 μm F-actin. The displayed data are corrected for the basal ATPase activity of myosin. Experimental conditions were as follows: 25 °C, 25 mm HEPES (pH 7.4), 5 mm MgCl2, and 0.5 mm DTT.
TABLE 1.
Summary of the steady-state kinetics parameters
Uncertainties represent standard deviations of the mean values.
| Parametera | Signal | NMHC-2C0 | NMHC-2C1 | NMHC-2C1C2 |
|---|---|---|---|---|
| kbasal (s−1) | NADH assay | 0.06 ± 0.01 | 0.08 ± 0.01 | 0.08 ± 0.01 |
| kcat (s−1)b | NADH assay | >0.23 | >0.21 | >0.43 |
| Kapp (μm) | NADH assay | >140 | >140 | >140 |
| kcat/Kapp (μm−1 s−1)c | NADH assay | 0.002 ± 0.0002 | 0.002 ± 0.0003 | 0.005 ± 0.0005 |
a Experimental conditions for all measurements are as follows: 25 °C, 25 mm HEPES (pH 7.4), 5 mm MgCl2, 0.5 mm DTT.
b ATP turnover in the presence at 140 μm F-actin, the highest experimentally accessible F-actin concentration.
c The apparent second order rate constant for actin binding kcat/Kapp was obtained from the initial slope of the steady-state ATPase activity versus the [F-actin] plot and is well defined.
Actin Interaction
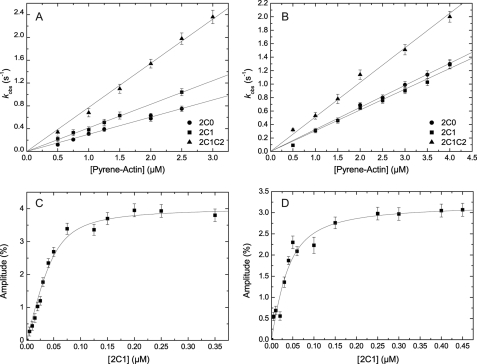
Myosin binding to pyrene-labeled F-actin can be monitored by the quench in pyrene fluorescence as depicted in Scheme 2 (41). The rate of actin binding was measured following the exponential decrease in pyrene fluorescence observed on binding of an excess of pyrene-actin to the NMHC-2C constructs. The observed rate constants were plotted against the pyrene-actin concentration, and kobs values were linearly dependent upon actin concentration over the range studied (Fig. 3A). The second-order rate constants (k+A) derived from the gradients of the plot were 0.30 ± 0.03, 0.41 ± 0.03, and 0.77 ± 0.04 μm−1 s−1 for 2C0, 2C1, and 2C1C2. A similar behavior was observed when performing the binding experiments in the presence of saturating ADP (250 μm) (Fig. 3B). Under these conditions, 2C1C2 (k+DA = 0.51 ± 0.01 μm−1 s−1) shows elevated binding properties when compared with its isoforms (k+DA = 0.33 ± 0.003 μm−1 s−1 and k+DA = 0.31 ± 0.006 μm−1 s−1 for isoforms 2C0 and 2C1).
SCHEME 2.
FIGURE 3.
Actin interaction. A, kinetics of myosin binding to pyrene-labeled F-actin. Increasing concentrations of pyrene actin were rapidly mixed with 0.15 μm NMHC-2C isoforms in a stopped-flow spectrophotometer. The second-order rate constants (k+A) were obtained from the ascending slopes. Values of 0.30 ± 0.03, 0.41 ± 0.03, and 0.77 ± 0.04 μm−1 s−1 were obtained for 2C0, 2C1, and 2C1C2. B, [pyrene-actin] dependence of the observed rate constants (kobs) for NMHC-2C·ADP binding to pyrene-actin filaments. Linear approximation gives a k+DA of 0.33 ± 0.003, 0.31 ± 0.006, and 0.51 ± 0.01 μm−1 s−1 for 2C0, 2C1, and 2C1C2, respectively. C, affinity titration of pyrene-actin for 2C1. 50 nm pyrene-labeled F-actin was incubated with 0.005 to 0.35 μm NMHC-2C1 before rapid mixing with 10 μm ATP. The amplitude of the ATP-induced dissociation increased with increasing NMHC-2C1, and quadratic fit to the data gives KA of 13±5 nm. D, affinity titration of pyrene-actin and 2C1·ADP. 30 nm pyrene-actin was preincubated with 0.005–0.3 μm myosin in the presence of 30 μm ADP, and the ternary complex was rapidly dissociated with 300 μm ATP. Quadratic approximation of the data set gives KDA of 18±13 nm.
The dissociation rate constants for the actomyosin complex in the absence (k−A) and presence (k−DA) of ADP were directly measured by chasing pyrene-actin with a large excess of unlabeled F-actin (data not shown). The signal changes observed for the dissociation reactions display double-exponential behavior. The rate constants and amplitudes determined for the slow phase correspond to ∼10 and ∼30% of the signal relative to the fast phase. We attribute the signal change associated with the slow phase to photobleaching. The dissociation rate constants k−A were derived from the fast phase and correspond to 0.0037 ± 0.0005, 0.0045 ± 0.0003, and 0.0122 ± 0.0005 s−1 for 2C0, 2C1, and 2C1C2. In the presence of saturating ADP (250–500 μm), values of 0.0050 ± 0.0004, 0.0024 ± 0.0002, and 0.0060 ± 0.0005 s−1 were determined for 2C0, 2C1, and 2C1C2.
The dissociation equilibrium constants for actin binding in the absence (KA) and presence of ADP (KDA) were calculated from the ratio of the dissociation and binding rate constants for all NMHC-2C isoforms as listed in Table 2. Additionally, the rigor affinity of the NMHC-2C isoforms for F-actin (KA) was directly measured using the method of Kurzawa and Geeves (42). Fig. 3C represents the plot of the amplitude of the ATP-induced dissociation of pyrene-labeled acto·2C1 as a function of [2C1]. A quadratic fit to the data outlines the equilibrium-binding isotherm and gives a value of 13 ± 5 nm for KA. In agreement with the calculated dissociation equilibrium constants, analysis of the experimental data for isoforms 2C0 and 2C1C2 gives values of 3.5 ± 1 nm and 17 ± 8 nm, respectively.
TABLE 2.
Summary of the rate and equilibrium constants obtained by transient kinetic analysis
Uncertainties represent standard deviations of the mean values.
| Parametera,b | Signal or calculation | NMHC-2C0 | NMHC-2C1 | NMHC-2C1C2 |
|---|---|---|---|---|
| K1k+2 (μm−1 s−1) | Tryptophan | 0.37 ± 0.01 | 0.66 ± 0.01 | 0.68 ± 0.01 |
| K1k+2 (μm−1s−1) | Mant-ATP | 0.39 ± 0.004 | 0.71 ± 0.01 | 1.23 ± 0.02 |
| k+3+k−3 (s−1) | Tryptophan | 34.69 ± 0.75 | 29.53 ± 0.57 | 25.79 ± 0.50 |
| 1/K1 (μm) | Tryptophan | 74.9 ± 4.0 | 30.0 ± 3.3 | 16.1 ± 2.0 |
| K1k+2 (μm−1 s−1) | Pyrene-actin | 1.02 ± 0.01 | 0.89 ± 0.01 | 0.64 ± 0.01 |
| k+2 (s−1) | Pyrene-actin | 517.0 ± 10.0 | 382.3 ± 6.4 | 417.0 ± 14.0 |
| 1/K1 (μm) | Pyrene-actin | 483.3 ± 31.8 | 394.1 ± 25.1 | 484.4 ± 57.8 |
| k+D (μm−1 s−1) | Mant-ADP | 0.54 ± 0.02 | 0.87 ± 0.02 | 0.73 ± 0.03 |
| k−D (s−1) | Mant-ADPc | 0.46 ± 0.05 | 1.66 ± 0.06 | 2.83 ± 0.06 |
| k−D (s−1) | Mant-ADPd | 0.42 ± 0.01 | 1.25 ± 0.02 | 2.17 ± 0.02 |
| KD (μm) | k−D /k+D | 0.85 ± 0.12 | 1.9 ± 0.11 | 3.87 ± 0.24 |
| KD (μm) | Tryptophane | 0.98 ± 0.18 | 1.98 ± 0.41 | 2.51 ± 0.63 |
| k+AD (μm−1s−1) | Mant-ADP | 2.56 ± 0.06 | 3.18 ± 0.11 | 2.91 ± 0.19 |
| k−AD (s−1) | Mant-ADPc | 0.50 ± 0.16 | 3.70 ± 0.31 | 3.94 ± 0.35 |
| k−AD (s−1) | Mant-ADPd | 0.78 ± 0.01 | 3.74 ± 0.02 | 3.66 ± 0.02 |
| Ki [Mg2+,free] (mm) | Mant-ADPd | 0.71 ± 0.15 | 1.05 ± 0.28 | 0.56 ± 0.04 |
| KAD (μm) | k−AD/k+AD | 0.19 ± 0.07 | 1.16 ± 0.14 | 1.35 ± 0.21 |
| KAD (μm) | Pyrene-actine | 0.43 ± 0.07 | 1.04 ± 0.17 | 2.03 ± 0.40 |
| Coupling | KAD/KD | ≈0.4 | ≈0.5 | ≈0.8 |
| k+A (μm−1s−1) | Pyrene-actin | 0.30 ± 0.03 | 0.41 ± 0.03 | 0.77 ± 0.04 |
| k−A (s−1) | Pyrene-actin | 0.0037 ± 0.0005 | 0.0045 ± 0.0003 | 0.0122 ± 0.0005 |
| KA (nm) | Pyrene-actine | 3.5 ± 1 | 13 ± 5 | 17 ± 8 |
| KA (nm) | k−A/k+A | ≈12 | ≈11 | ≈16 |
| k+DA (μm−1s−1) | Pyrene-actin | 0.33 ± 0.003 | 0.31 ± 0.006 | 0.51 ± 0.011 |
| k−DA (s−1) | Pyrene-actin | 0.0050 ± 0.0004 | 0.0024 ± 0.0002 | 0.0060 ± 0.0005 |
| KDA (nm) | Pyrene-actine | 18 ± 8 | 18 ± 13 | 5 ± 4 |
| KDA (nm) | k−DA/k+DA | ≈15 | ≈8 | ≈12 |
| Coupling | KDA/KA | ≈4.2 | ≈2.0 | ≈0.5 |
| Maximum duty ratio | kcat/k−ADf | ≈0.26 | ≈0.04 | ≈0.10 |
| Minimum duty ratio | kcat/k−ADf | ≈0.15 | ≈0.02 | ≈0.05 |
a Numbering of steps was according to Scheme 1.
b Experimental conditions are as follows: 20 mm MOPS (pH 7.0), 100 mm KCl, 5 mm MgCl2, 20 °C.
c From the intercept of the kobs versus [mant-ADP] plot is shown.
d From ATP chase experiment is shown.
e From amplitude data.
f Maximal and minimal duty ratios were calculated from the values determined in the presence of 2 and 0.2 mm free Mg2+, respectively.
In the presence of saturating [ADP] (250 μm), the affinity of NMHC-2C isoforms for F-actin (KDA) lies in the range between 10 and 20 nm (Table 2). A typical plot is shown in Fig. 3D for isoform 2C1. A quadratic fit to the data gives a value of 18 ± 13 nm for KDA. Taken together, the dissociation equilibrium constants KA and KDA are similar, and the ratio KDA/KA indicates weak thermodynamic coupling for all NMHC-2C isoforms.
ATP Kinetics
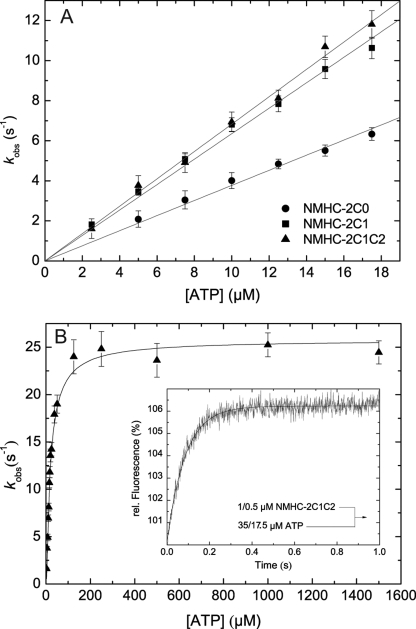
The mechanism of ATP binding to myosin was modeled according to Scheme 3 consisting of the formation of a binary collision complex followed by a rapid isomerization reaction of the enzyme (43). Presteady-state kinetics of nucleotide binding to myosin was performed under pseudo first-order conditions, and the increase in intrinsic protein fluorescence upon ATP binding was monitored. Fig. 4B depicts the dependence of the hydrolysis rate of 2C1C2 on [ATP]. The best fit to the dataset is a hyperbolic function approaching a maximum that is proposed to represent the rate of a rate-limiting conformational change that precedes ATP hydrolysis (k+3 + k−3) (44). Values between 25.79 ± 0.50 and 34.69 ± 0.75 s−1 were determined for the NMHC-2C isoforms (Table 2). Half-saturation (1/K1) decreases from 74.9 ± 4 μm for isoform 2C0, to 30.0 ± 3.3 for 2C1, and 16.1 ± 2.0 μm for 2C1C2. At low [ATP], the initial slope of the observed rate constant versus [ATP] plot is linear and defines the apparent second-order rate constant for ATP binding (K1k+2) (Fig. 4A). Substrate binding to NMHC-2C splice variants resulted in almost identical values of 0.66 ± 0.01 and 0.68 ± 0.01 μm−1 s−1 for 2C1 and 2C1C2 but slightly reduced values for 2C0 (0.37 ± 0.01 μm−1s−1). Similar values were obtained when the fluorescent ATP analogue mant-ATP was used as a substrate (Table 2).
SCHEME 3.
FIGURE 4.
Kinetics of ATP binding to NMHC-2C isoforms. A, ATP binding to nonmuscle myosin-2C isoforms was measured by monitoring the increase in tryptophan fluorescence. At low [ATP], kobs depends linearly on the nucleotide concentration defining the second-order rate constant K1k+2 to 0.37 ± 0.01, 0.66 ± 0.01, and 0.68 ± 0.01 μm−1s−1 for 2C0, 2C1, and 2C1C2, respectively. B, dependence of kobs on [ATP] fitted to a hyperbolic function for isoform 2C1C2. The approximation approached a value k+3+k−3 of 25.79 ± 0.5 s−1, whereas half-saturation is reached at 1/K1 = 16.1 ± 1.98 μm. Inset, stopped-flow record after mixing 0.5 μm 2C1C2 with 17.5 μm ATP approximated with a mono-exponential function yielding a kobs of 11.81 s−1.
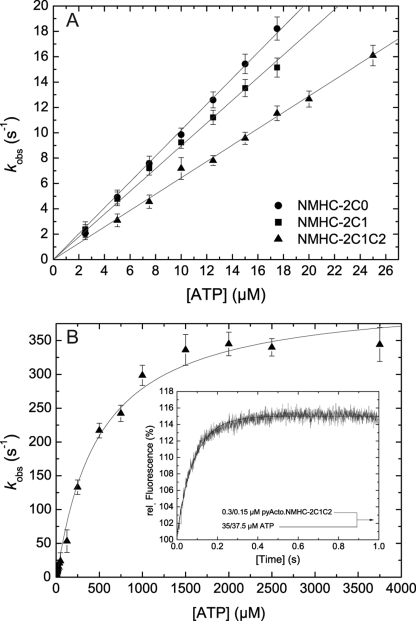
ATP binding to pyrene-labeled actomyosin was monitored from the fluorescence enhancement that is associated with the population of the weak actin-binding states and dissociation of the complex. The reaction was modeled as a two-step binding process involving the formation of a collision complex followed by an isomerization step as depicted in Scheme 4 (45). The time-dependent fluorescence increase can be described by mono-exponential functions for isoforms 2C1 and 2C1C2 (Fig. 5B, inset) and an additional lag phase for isoform 2C0. The observed rate constants depend hyperbolically on [ATP] (Fig. 5B), approaching rates of k+2 = 517.0 ± 10 s−1 (2C0), 382.32 ± 6.4 s−1 (2C1), and 417.0 ± 14 s−1 (2C1C2). Half-saturation occurs at 483.3 ± 31.8, 394.1 ± 25.1, and 484.4 ± 57.8 μm for 2C0, 2C1, and 2C1C2, respectively. At low [ATP], up to a maximum of 25 μm, the observed rate constants were linearly dependent on [ATP]. The slope of the best fit line shown in Fig. 5A defines the second-order rate constant K1k+2. Values of 1.02 ± 0.01, 0.89 ± 0.01, and 0.64 ± 0.01 μm−1s−1 were obtained for 2C0, 2C1, and 2C1C2 (Table 2).
SCHEME 4.
FIGURE 5.
Kinetics of ATP binding to actomyosin. A, ATP induced dissociation of actomyosin. The resulting observed rate constants (kobs) depend linearly on the ATP concentration. Linear regression defines the apparent second-order rate constant of ATP binding (K1k+2) to 1.02 ± 0.01, 0.89 ± 0.01, and 0.64 ± 0.01 μm−1s−1 for 2C1, 2C1, and 2C1C2, respectively. B, at high [ATP], the observed rate constants can be described by a hyperbola. In the shown example of 2C1C2, the observed rate constants converge k+2 = 417.0 ± 14 s−1 with half-saturation at 1/K1 = 484.4 ± 57.8 μm. Inset, representative time course of pyrene-actin fluorescence enhancement after mixing 0.15 μm pyrene-acto·2C1C2 and 17.5 μm ATP yielding a kobs of 11.53 s−1.
ADP Kinetics
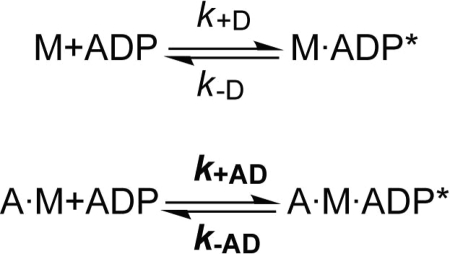
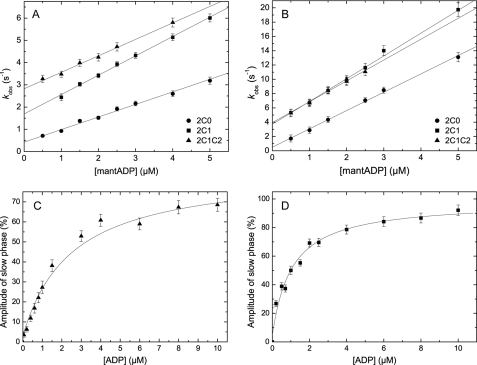
Binding of mant-ADP to NMHC-2C isoforms leads to an increase in fluorescence intensity as described in Scheme 5. The fluorescence transients upon mixing myosin (0.15 μm) under pseudo first-order conditions with mant-ADP follow a mono-exponential increase plus lag phase for all isoforms. Values for k+D corresponding to 0.54 ± 0.02, 0.87 ± 0.02, and 0.73 ± 0.03 μm−1s−1 were obtained for 2C0, 2C1, and 2C1C2 from the linear approximation of the plot of the observed rate constants (kobs) versus [mant-ADP] (Fig. 6A). The corresponding intercepts reflect the dissociation rate constant k−D, which shows a gradual acceleration from 0.46 ± 0.05 over 1.66 ± 0.06 to 2.83 ± 0.06 s−1 for isoforms 2C0, 2C1, and 2C1C2.
SCHEME 5.
FIGURE 6.
ADP interaction. A, kinetics of mant-ADP binding to myosin. Individual data sets were fit to a linear equation, yielding the second-order rate constant k+D of 0.54 ± 0.02, 0.87 ± 0.02, and 0.73 ± 0.03 μm−1 s−1 for 2C0, 2C1, and 2C1C2. The corresponding dissociation rate constants k−D provided by the y intercept are 0.46 ± 0.05, 1.66 ± 0.06, and 2.83 ± 0.06 s−1 for 2C0, 2C1, and 2C1C2. B, kinetics of mant-ADP binding to actomyosin. The second-order rate binding constant as deduced from the plot are as follows: 2.56 ± 0.06, 3.18 ± 0.11, and 2.91 ± 0.19 μm−1 s−1 for 2C0, 2C1, and 2C1C2. Extrapolation of the slopes to zero [mant-ADP] defines the individual dissociation rate constants k−AD to 0.5 ± 0.16, 3.7 ± 0.31, and 2.91 ± 0.19 s−1 for 2C0, 2C1, and 2C1C2. C, determination of the dissociation equilibrium constant KD of 2C1C2. The secondary plot shows the [ADP] dependence of the amplitude of the slow phase that is obtained after mixing 0.16 μm 2C1C2 in the presence of changing concentrations of ADP (1–10 μm) with excess ATP (500 μm). The plot of the observed amplitude of the slow phase versus [ADP] follows a hyperbolic function and defines KD to 2.51 ± 0.63 μm. D, influence of ADP on the ATP-induced dissociation of acto·2C1. 0.25 μm pyrene-acto·2C1 was preincubated with varying ADP concentrations, and the complex was rapidly dissociated with 1000 μm ATP. The dependence of the amplitude of the slow phase versus [ADP] was fitted to a hyperbola with an apparent KAD of 1.04 ± 0.17 μm.
ADP dissociation rate constants were independently confirmed by displacing mant-ADP from the motor domain constructs with excess ATP. The fluorescence transients show a mono-exponential behavior (data not shown). The observed rate constants for mant-ADP dissociation directly define the dissociation rate k−D as 0.42 ± 0.01 s−1 for isoform 2C0. Isoforms 2C1 and 2C1C2 show 3–5-fold faster rate constants corresponding to 1.25 ± 0.02 and 2.17 ± 0.02 s−1.
The ratio of k−D/k+D defines the dissociation equilibrium constant for mant-ADP binding (KD) giving values of 0.85 ± 0.12, 1.9 ± 0.11, and 3.87 ± 0.24 μm for isoforms 2C0, 2C1, and 2C1C2. These extremely low values were confirmed in an independent experiment in which the displacement of ADP (0–10 μm) from myosin (0.083–0.16 μm) by the addition of excess ATP (0.1–0.5 mm) was quantified. Time courses in the absence of ADP were approximated with a mono-exponential function. Time courses in the presence of ADP were biphasic with the amplitude of the slow phase increasing with increasing [ADP]. Fig. 6C shows the hyperbolic [ADP] dependence of the amplitude of the slow phase, defining a KD of 2.51 ± 0.63 μm for isoform 2C1C2. Isoforms 2C0 and 2C1 display slightly higher ADP affinities (KD = 0.98 ± 0.18 μm and KD = 1.98 ± 0.41 μm for 2C0 and 2C1, respectively). The decrease in KD values in the order 2C0 > 2C1 > 2C1C2 is attributed to the accelerated ADP release from 2C1 and 2C1C2 compared with 2C0, and the second-order rate constant (k+D) is virtually identical for the three splice variants.
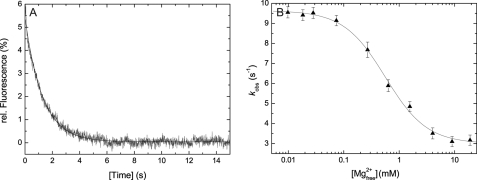
ADP binding to actomyosin was monitored by the fluorescence increase that follows binding of mant-ADP (Scheme 5). The time-dependent increase in fluorescence follows a mono-exponential function in the case of isoform 2C1C2 and bi-exponential functions for isoforms 2C0 and 2C1. In the case of a double-exponential approximation, only the fast phase was considered. The observed rate constants of the slow phase were smaller than 6% compared with the rate constants observed for the fast phase with 2C0 and 2C1 and contributed 15–30% to the total amplitude. We interpret the biphasic behavior observed with isoforms 2C0 and 2C1 as an indication for the existence of an additional ADP-bound state, which may be related to the regulation of these isoforms by MLC20 phosphorylation (21). The rate constants observed for the fast phase depend up to 5 μm linearly on [mant-ADP]. The following values were determined for the second-order rate constants for mant-ADP binding to acto·NMHC-2C isoforms k+AD: 2.56 ± 0.06 μm−1s−1 (2C0), 3.18 ± 0.11 μm−1s−1 (2C1), and 2.91 ± 0.19 μm−1s−1 (2C1C2) (Fig. 6B). Although mant-ADP binding showed almost identical rate constants for the NMHC-2C isoforms, the corresponding dissociation rate constants k−AD derived from the intercepts vary considerably. Values of 0.50 ± 0.16, 3.70 ± 0.31, and 3.94 ± 0.35 s−1 were obtained for isoforms 2C0, 2C1, and 2C1C2. Similar values were derived by displacing mant-ADP from actomyosin by excess ATP (Table 2). A representative time course of the fluorescence decrease upon mixing 0.15 μm acto·2C0 and 2.5 μm mant-ADP with 500 μm ATP is shown in Fig. 7A.
FIGURE 7.
Mg2+ dependence of ADP release from actomyosin. A, representative time course upon mixing 0.15 μm acto·2C0 and 2.5 μm mant-ADP with excess ATP (500 μm). A mono-exponential approximation gives k−AD = 0.78 ± 0.01 s−1. B, impact of free Mg2+ ion concentration on the ADP release rate from acto·2C1C2. Increasing the free Mg2+ ion concentration from 0.01 to 19.0 mm results in an almost 3-fold decrease in the rate of enzymatic activity.
Using the relationship of the equilibrium dissociation constant KAD = k−AD/k+AD, values of 0.19 ± 0.07, 1.16 ± 0.14, and 1.35 ± 0.21 μm were calculated for isoforms 2C0, 2C1, and 2C1C2, respectively. Additionally, KAD was directly determined from the competitive inhibition of the ATP-induced dissociation of actomyosin by ADP. Fig. 6D shows the result of the affinity titration of isoform 2C1. The dependence of the amplitude of the slow phase plotted as a function of [ADP] and the fit of the data to a hyperbolic function gave a KAD of 1.04 ± 0.17 μm for 2C1. As stated in Table 2, the titrated parameters of all isoforms are in good agreement with the results obtained from the analysis of the mant-ADP data. Comparison of the dissociation equilibrium constants for ADP in the presence and absence of F-actin (KAD/KD) is a measure for the myosin motors coupling efficiency. The values obtained for NMHC-2C isoforms vary between 0.4 and 0.8 and are very low. Consistently, the rate of ADP release is only weakly accelerated in the presence of F-actin (1.7–3-fold).
Mg2+ Regulation
Besides the described interaction between actomyosin and ADP, this work shows for the first time a Mg2+-sensitive regulatory mechanism for a conventional myosin. Fig. 7B shows the dependence of the observed ADP dissociation rate constant of 2C1C2 on free Mg2+ ion concentration. Increasing the free Mg2+ ion concentration from 0.01 to 19 mm leads to an ≈3-fold inhibition of the ADP dissociation rate constant k−AD. The maximum response observed for the ADP release kinetics lies in the range of physiological free Mg2+ ion concentrations (0.2–2 mm). Thus, minimal and maximal physiological values for the duty cycle of each isoform can be defined corresponding to the lower and upper limits of physiological free magnesium ion concentrations (Table 2). A Ki of 0.71 ± 0.15 mm was determined for 2C0 (Fig. 7B). Similar Ki values were obtained for isoforms 2C1 and 2C1C2. All values are summarized in Table 2.
Mant-ADP binding to actomyosin as a function of the concentration of free Mg2+ ions did not show a significant acceleration in k+AD (<18%) in the concentration range between 1 and 20 mm free Mg2+ ions, whereas the intercepts decreased with increasing Mg2+ ion concentration indicating a decrease in k−AD (data not shown). To probe whether Mg2+ is a direct regulator of the overall actin-activated steady-state turnover, we measured steady-state ATP turnover as a function of the concentration of free Mg2+ ions. No significant effect of free Mg2+ ions in the concentration range between 0.002 and 18 mm on actin-activated ATP turnover was observed (data not shown). This observation supports the hypothesis that ADP release from actomyosin is not the rate-limiting step in the overall ATPase cycle.
Mechanical Properties
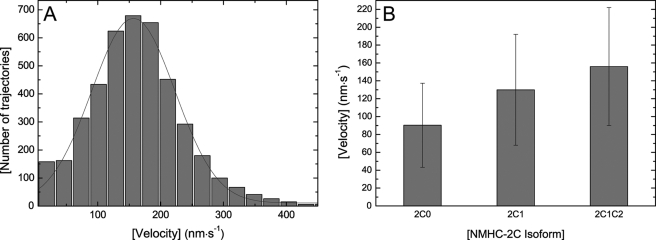
In vitro motility studies demonstrated the functional competence of the NMHC-2C motor domain constructs. Sliding velocities of ∼90, ∼130, and ∼160 nm·s−1 were determined for 2C0, 2C1, and 2C1C2 at 30 °C in the presence of 0.025 mm free Mg2+ ions (Fig. 8). To confirm that the motor function of NMHC-2C isoforms is sensitive to changes in the concentration of free Mg2+ ions, we performed additional studies using the in vitro actin filament-gliding assay. In the case of isoform 2C1C2, increasing the free Mg2+ ion concentration from 0.025 to 1.2 mm led to a gradual loss of motility. With the exception of rare and short bursts of movement displayed by point-like particles, the movement of actin filaments was markedly reduced at free Mg2+ ion concentrations greater 0.2 mm and completely stalled at 1.2 mm (data not shown).
FIGURE 8.
In vitro motility assay. A, actin gliding velocity distribution of 2C1C2. An average sliding velocity of 156 ± 66 nm·s−1 was determined. B, distribution of the in vitro gliding velocities of NMHC-2C isoforms. Experimental conditions were as follows: 25 mm imidazole (pH 7.4), 25 mm KCl, 1 mm MgCl2, 1 mm EGTA, 4 mm ATP in the presence of an oxygen scavenging system at 30 °C. Error bars indicate the sample standard deviation.
DISCUSSION
The generation and detailed characterization of NMHC-2C head domain constructs with artificial lever arm provide detailed information about the kinetic and motor properties of human nonmuscle myosin-2C and reveal specific differences between the splice isoforms 2C0, 2C1, and 2C1C2.
Impact of Loop-1
Previous studies of smooth muscle myosins have shown a correlation between an extended loop-1 and the kinetic constants of ADP release and ATP binding (46). Furthermore, it has been proposed that loop-1 controls velocity through modulation of the ADP release step (27, 47). In case of NMHC-2C isoforms, loop-1 is the key regulator of ADP kinetics. Although the binding kinetics are less influenced by an extended loop-1 region, ADP release is accelerated 3–8-fold both in the absence and presence of F-actin in isoforms 2C1 and 2C1C2. Consequently, KAD increases in ascending order 2C0 ≪ 2C1 ≈ 2C1C2 from 0.19 to 1.35 μm. The same trend was observed for KD. Moreover, the in vitro sliding velocity of isoforms 2C1 and 2C1C2 is increased compared with 2C0. Minor effects were determined for steady-state ATPase activity, ATP binding kinetics (K1k+2), and actin interaction (KA).
Impact of Loop-2
Loop-2 is assumed to play a central role during the initial phase of the formation of the actin-myosin interface, to affect F-actin affinity in the absence and presence of nucleotides, and to contribute to coupling between the actin and nucleotide binding sites (22, 23). Extensions of loop-2 without concomitant charge changes were shown to have only a minor influence on the actin-myosin interaction (22). The addition of positively charged residues to loop-2 was shown to strengthen the actin-myosin interaction, whereas the introduction of negatively charged residues weakens the interaction (22). In the case of NMHC-2C isoforms, the 33-amino acid insertion at the N-terminal end of loop-2 in isoform 2C1C2 causes small but significant changes in the actin-myosin interaction. Our results show a 2-fold increase in the actin-binding isotherms k+A and k+DA when compared with those measured for isoforms 2C0 and 2C1. Additionally, the dissociation rate constant k−A is increased in isoform 2C1C2, resulting in an ∼5-fold lower affinity for F-actin compared with isoform 2C0.
It has been shown that the actin affinity of some class 2 myosin isoforms, such as fast skeletal muscle myosin and cardiac muscle myosin, is strongly influenced by the presence of ADP and hence shows a large coupling ratio (KDA/KA = 15–60) (43, 48). Strikingly, the actin affinity of NMHC-2C isoforms does not significantly change in the presence of ADP. A similar behavior has been reported for NMHC-2A, NMHC-2B, and smooth muscle myosin (18, 19, 49). Besides the effect on actin interaction, the expanded loop-2 region in isoform 2C1C2 defines the steady-state ATP turnover by leading to increases in kcat and the apparent second-order rate constant for actin binding (kcat/Kapp). An extended loop-2 in isoform 2C1C2 does not appear to affect nucleotide binding and dissociation. In conclusion, our results show that the 33-amino acid extension of loop-2 strengthens coupling between the actin and the nucleotide binding regions.
Thermodynamic Coupling
The thermodynamic coupling of ADP and F-actin affinity (KAD/KD) and the acceleration of ADP release by F-actin (k−AD/k−D) constitute the key adaptations of myosin isoforms for their particular function. In the case of NMHC-2C isoforms, the coupling between the ADP and F-actin binding regions is weak (<5). A similar behavior has been described for smooth muscle myosin isoforms (49), nonmuscle myosins NMHC-2A (18), and NMHC-2B (19). In contrast, other members of myosin class 2 such as fast skeletal muscle myosin and cardiac muscle myosin display coupling constants in the range from 50 to 100 (48, 50). It has been proposed that a low coupling efficiency (KAD/KD) is an inherent property of myosins that function as tension sensors, whereas large coupling constants are a property of myosins that are involved in the generation of fast movement (47, 51). In the case of NMHC-2C, this explanation is in good agreement with the reported cellular functions of the protein, in particular tension-bearing processes such as cell adhesion and the maintenance of cell-cell connections.
Magnesium Sensitivity
Magnesium is the second most abundant divalent cation within mammalian cells and is implicated in more than 300 enzymatic reactions (52, 53). Latest reports indicate cyclical fluctuations of intracellular Mg2+ in cardiac myocytes (54), a cell type expressing NMHC-2B and -2C (15). Furthermore, it was shown that TRPM6 and TRPM7, divalent cation channels permeable to calcium and magnesium, are implicated in magnesium homeostasis and associate with the actomyosin cytoskeleton in a calcium- and kinase-dependent manner. Both channel proteins interact directly with and mediate the phosphorylation of NMHC-2A, -2B, and -2C, resulting in the spatial and temporal regulation of actomyosin contractility (55, 56). The direct effect of changes in the concentration of free Mg2+ ions as modulators of the kinetic and mechanical properties of selected myosins has been discussed in detail for unconventional myosins from classes 1 and 5 (33, 37, 57–59). Here, we describe for the first time the effect of changes in the concentration of free Mg2+ ions on the kinetic and mechanical properties of a conventional myosin. Fig. 9 summarizes the effect of free Mg2+ ions on isoform 2C0 in exemplary fashion for the three splice variants.
FIGURE 9.
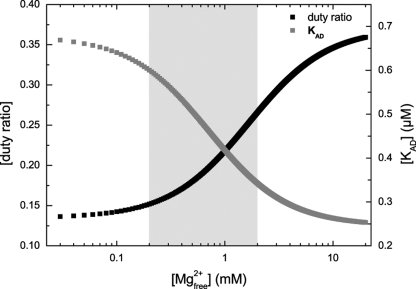
Schematic diagram, illustrating the consequences of the magnesium sensitivity on the ADP affinity of the actomyosin complex (KAD) and the duty ratio of isoform 2C0. Depicted is the dependence of KAD (gray squares) and the duty ratio (black squares) on free Mg2+ in the concentration range between 0.01 and 20 mm. The ordinate on the left represents the duty ratio, whereas the ordinate on the right refers to KAD. KAD was calculated from the ratio k−AD/k+AD under the assumption that k+AD is constant. The data for k−AD were extracted from the regression of the kobs versus Mg2+ plot as depicted in Fig. 7B. The duty ratio was calculated as follows (duty ratio = (kcat/k−AD)), based on a constant value for kcat of 0.23 s−1. Changes within the physiological range of free Mg2+ ion concentrations (0.2 to 2 mm, highlighted in gray) produce the greatest response in the duty ratio and KAD.
The observed Mg2+ ion-mediated reduction in motile velocity is in good agreement with a model that requires the coordination of the Mg2+ ion with protein and ADP to be broken before ADP can be released. Changes in the free Mg2+ ion concentrations can then act to shift the equilibrium from the free to the bound complex by simple mass action (33). Notably, the steepest slopes, corresponding to the greatest responsiveness, are observed for all three parameters in the physiological range from 0.2 to 2 mm free Mg2+ ions. The reduction in motility, which is observed at free Mg2+ ion concentrations greater than 0.2 mm, coincides with changes in the duty ratio and KAD in such a way that a physiological increase in Mg2+ ions greatly reduces the ability of the motor to produce movement, but its capacity for bearing tension is increased at the same time (Fig. 9). Changes in the concentration of free Mg2+ have no effect on the steady-state turnover, confirming that ADP release from actomyosin is not rate-limiting.
What Is the Physiological Relevance of the Magnesium Sensitivity of NMHC-2C Isoforms?
Nonmuscle myosins are thought to assemble into short, relatively thin bipolar filaments consisting of less than 28 myosin molecules (11, 12, 60). From the geometry of the filaments, we conclude that at least six myosin heads should be ideally positioned to make contact with the same actin filament, when each bipolar myosin filament is embedded in a mixed array of 6–8 parallel actin filaments. Under the low or zero load conditions under which we measured motile activity, ATPase activity, and ADP release for the NMHC-2C constructs, duty ratios greater than 0.16 are thus required to support an uninterrupted interaction between the myosin filament and each neighboring actin filament. Isoform 2C0, displaying free Mg2+ ion-dependent changes in its duty ratio in the range from 0.15 to 0.26, fulfills this criterion in part, whereas isoforms 2C1 (duty ratio ≈0.02–0.04) and 2C1C2 (duty ratio ≈0.05–0.10) do not. However, the responsiveness of all three isoforms toward changes in the concentration of free Mg2+ ions is likely to be increased under the influence of alternating strain and tension in their physiological environment.
Conclusion
This study reveals that NMHC-2C isoforms show distinct kinetic features. The kinetic and functional differences caused by the alternatively spliced surface loops loop-1 and loop-2 in NMHC-2C transcript variants are small but significant. Changes in ADP and F-actin affinities are the most prominent differences emerging from the transient kinetic dissection of the NMHC-2C isoforms, and they can be directly linked to the observed changes in motor activity.
Similar to the situation described for myosins from classes 1 and 5 (33, 37, 57–59), higher concentrations of free Mg2+ ions stabilize the tension-bearing A·M·ADP state. At high physiological concentrations of free Mg2+ ions, the capacity for tension generation of all NMHC-2C splice isoforms appears to be strongly increased, although the production of movement stalls. The observation that changes in the concentration of free Mg2+ ions modulate nonmuscle myosin-2C function provides a link to the dynamically coordinated spatiotemporal organization of actin-myosin interactions in processes like cytoskeletal tension generation and cell adhesion.
Acknowledgment
We thank Krishna Chinthalapudi for helpful discussions.
This work was supported by Deutsche Forschungsgemeinschaft Grant Ma 1081/16-1 and the Cluster of Excellence “Rebirth” (to D. J. M.).
- NMHC
- nonmuscle myosin heavy chain
- mant
- N-methylanthraniloyl
- TRITC
- tetramethylrhodamine isothiocyanate.
REFERENCES
- 1. Berg J. S., Powell B. C., Cheney R. E. (2001) Mol. Biol. Cell 12, 780–794 [DOI] [PMC free article] [PubMed] [Google Scholar]
- 2. Golomb E., Ma X., Jana S. S., Preston Y. A., Kawamoto S., Shoham N. G., Goldin E., Conti M. A., Sellers J. R., Adelstein R. S. (2004) J. Biol. Chem. 279, 2800–2808 [DOI] [PubMed] [Google Scholar]
- 3. Simerly C., Nowak G., de Lanerolle P., Schatten G. (1998) Mol. Biol. Cell 9, 2509–2525 [DOI] [PMC free article] [PubMed] [Google Scholar]
- 4. Maupin P., Phillips C. L., Adelstein R. S., Pollard T. D. (1994) J. Cell Sci. 107, 3077–3090 [DOI] [PubMed] [Google Scholar]
- 5. Jana S. S., Kawamoto S., Adelstein R. S. (2006) J. Biol. Chem. 281, 24662–24670 [DOI] [PubMed] [Google Scholar]
- 6. Guha M., Zhou M., Wang Y. L. (2005) Curr. Biol. 15, 732–736 [DOI] [PubMed] [Google Scholar]
- 7. Vicente-Manzanares M., Zareno J., Whitmore L., Choi C. K., Horwitz A. F. (2007) J. Cell Biol. 176, 573–580 [DOI] [PMC free article] [PubMed] [Google Scholar]
- 8. Even-Ram S., Doyle A. D., Conti M. A., Matsumoto K., Adelstein R. S., Yamada K. M. (2007) Nat. Cell Biol. 9, 299–309 [DOI] [PubMed] [Google Scholar]
- 9. Kengyel A., Wolf W. A., Chisholm R. L., Sellers J. R. (2010) J. Muscle Res. Cell Motil. 31, 163–170 [DOI] [PMC free article] [PubMed] [Google Scholar]
- 10. Sellers J. R. (2000) Biochim. Biophys. Acta 1496, 3–22 [DOI] [PubMed] [Google Scholar]
- 11. Niederman R., Pollard T. D. (1975) J. Cell Biol. 67, 72–92 [DOI] [PMC free article] [PubMed] [Google Scholar]
- 12. Verkhovsky A. B., Svitkina T. M., Borisy G. G. (1995) J. Cell Biol. 131, 989–1002 [DOI] [PMC free article] [PubMed] [Google Scholar]
- 13. Bao J., Jana S. S., Adelstein R. S. (2005) J. Biol. Chem. 280, 19594–19599 [DOI] [PubMed] [Google Scholar]
- 14. Bao J., Ma X., Liu C., Adelstein R. S. (2007) J. Biol. Chem. 282, 22102–22111 [DOI] [PubMed] [Google Scholar]
- 15. Ma X., Jana S. S., Conti M. A., Kawamoto S., Claycomb W. C., Adelstein R. S. (2010) Mol. Biol. Cell 21, 3952–3962 [DOI] [PMC free article] [PubMed] [Google Scholar]
- 16. Conti M. A., Even-Ram S., Liu C., Yamada K. M., Adelstein R. S. (2004) J. Biol. Chem. 279, 41263–41266 [DOI] [PubMed] [Google Scholar]
- 17. Tullio A. N., Accili D., Ferrans V. J., Yu Z. X., Takeda K., Grinberg A., Westphal H., Preston Y. A., Adelstein R. S. (1997) Proc. Natl. Acad. Sci. U.S.A. 94, 12407–12412 [DOI] [PMC free article] [PubMed] [Google Scholar]
- 18. Kovács M., Wang F., Hu A., Zhang Y., Sellers J. R. (2003) J. Biol. Chem. 278, 38132–38140 [DOI] [PubMed] [Google Scholar]
- 19. Wang F., Kovacs M., Hu A., Limouze J., Harvey E. V., Sellers J. R. (2003) J. Biol. Chem. 278, 27439–27448 [DOI] [PubMed] [Google Scholar]
- 20. Leal A., Endele S., Stengel C., Huehne K., Loetterle J., Barrantes R., Winterpacht A., Rautenstrauss B. (2003) Gene 312, 165–171 [DOI] [PubMed] [Google Scholar]
- 21. Jana S. S., Kim K. Y., Mao J., Kawamoto S., Sellers J. R., Adelstein R. S. (2009) J. Biol. Chem. 284, 11563–11571 [DOI] [PMC free article] [PubMed] [Google Scholar]
- 22. Furch M., Geeves M. A., Manstein D. J. (1998) Biochemistry 37, 6317–6326 [DOI] [PubMed] [Google Scholar]
- 23. Murphy C. T., Spudich J. A. (1999) Biochemistry 38, 3785–3792 [DOI] [PubMed] [Google Scholar]
- 24. Sweeney H. L., Rosenfeld S. S., Brown F., Faust L., Smith J., Xing J., Stein L. A., Sellers J. R. (1998) J. Biol. Chem. 273, 6262–6270 [DOI] [PubMed] [Google Scholar]
- 25. Rovner A. S., Freyzon Y., Trybus K. M. (1997) J. Muscle Res. Cell Motil. 18, 103–110 [DOI] [PubMed] [Google Scholar]
- 26. Clark R., Ansari M. A., Dash S., Geeves M. A., Coluccio L. M. (2005) J. Biol. Chem. 280, 30935–30942 [DOI] [PubMed] [Google Scholar]
- 27. Kurzawa-Goertz S. E., Perreault-Micale C. L., Trybus K. M., Szent-Györgyi A. G., Geeves M. A. (1998) Biochemistry 37, 7517–7525 [DOI] [PubMed] [Google Scholar]
- 28. Uyeda T. Q., Ruppel K. M., Spudich J. A. (1994) Nature 368, 567–569 [DOI] [PubMed] [Google Scholar]
- 29. Lehrer S. S., Kerwar G. (1972) Biochemistry 11, 1211–1217 [DOI] [PubMed] [Google Scholar]
- 30. Criddle A. H., Geeves M. A., Jeffries T. (1985) Biochem. J. 232, 343–349 [DOI] [PMC free article] [PubMed] [Google Scholar]
- 31. Kron S. J., Spudich J. A. (1986) Proc. Natl. Acad. Sci. U.S.A. 83, 6272–6276 [DOI] [PMC free article] [PubMed] [Google Scholar]
- 32. Bagshaw C. R., Eccleston J. F., Eckstein F., Goody R. S., Gutfreund H., Trentham D. R. (1974) Biochem. J. 141, 351–364 [DOI] [PMC free article] [PubMed] [Google Scholar]
- 33. Fujita-Becker S., Dürrwang U., Erent M., Clark R. J., Geeves M. A., Manstein D. J. (2005) J. Biol. Chem. 280, 6064–6071 [DOI] [PubMed] [Google Scholar]
- 34. Anson M., Geeves M. A., Kurzawa S. E., Manstein D. J. (1996) EMBO J. 15, 6069–6074 [PMC free article] [PubMed] [Google Scholar]
- 35. Ruff C., Furch M., Brenner B., Manstein D. J., Meyhöfer E. (2001) Nat. Struct. Biol. 8, 226–229 [DOI] [PubMed] [Google Scholar]
- 36. Kliche W., Fujita-Becker S., Kollmar M., Manstein D. J., Kull F. J. (2001) EMBO J. 20, 40–46 [DOI] [PMC free article] [PubMed] [Google Scholar]
- 37. Taft M. H., Hartmann F. K., Rump A., Keller H., Chizhov I., Manstein D. J., Tsiavaliaris G. (2008) J. Biol. Chem. 283, 26902–26910 [DOI] [PubMed] [Google Scholar]
- 38. Ito K., Kashiyama T., Shimada K., Yamaguchi A., Awata J., Hachikubo Y., Manstein D. J., Yamamoto K. (2003) Biochem. Biophys. Res. Commun. 312, 958–964 [DOI] [PubMed] [Google Scholar]
- 39. Tsiavaliaris G., Fujita-Becker S., Manstein D. J. (2004) Nature 427, 558–561 [DOI] [PubMed] [Google Scholar]
- 40. Wang F., Chen L., Arcucci O., Harvey E. V., Bowers B., Xu Y., Hammer J. A., 3rd, Sellers J. R. (2000) J. Biol. Chem. 275, 4329–4335 [DOI] [PubMed] [Google Scholar]
- 41. Taylor E. W. (1991) J. Biol. Chem. 266, 294–302 [PubMed] [Google Scholar]
- 42. Kurzawa S. E., Geeves M. A. (1996) J. Muscle Res. Cell Motil. 17, 669–676 [DOI] [PubMed] [Google Scholar]
- 43. Ritchie M. D., Geeves M. A., Woodward S. K., Manstein D. J. (1993) Proc. Natl. Acad. Sci. U.S.A. 90, 8619–8623 [DOI] [PMC free article] [PubMed] [Google Scholar]
- 44. Marston S. B., Taylor E. W. (1980) J. Mol. Biol. 139, 573–600 [DOI] [PubMed] [Google Scholar]
- 45. Millar N. C., Geeves M. A. (1983) FEBS Lett. 160, 141–148 [DOI] [PubMed] [Google Scholar]
- 46. Lauzon A. M., Tyska M. J., Rovner A. S., Freyzon Y., Warshaw D. M., Trybus K. M. (1998) J. Muscle Res. Cell Motil. 19, 825–837 [DOI] [PubMed] [Google Scholar]
- 47. Spudich J. A. (1994) Nature 372, 515–518 [DOI] [PubMed] [Google Scholar]
- 48. Siemankowski R. F., White H. D. (1984) J. Biol. Chem. 259, 5045–5053 [PubMed] [Google Scholar]
- 49. Cremo C. R., Geeves M. A. (1998) Biochemistry 37, 1969–1978 [DOI] [PubMed] [Google Scholar]
- 50. Batra R., Geeves M. A., Manstein D. J. (1999) Biochemistry 38, 6126–6134 [DOI] [PubMed] [Google Scholar]
- 51. Nyitrai M., Geeves M. A. (2004) Philos. Trans. R. Soc. Lond. B Biol. Sci. 359, 1867–1877 [DOI] [PMC free article] [PubMed] [Google Scholar]
- 52. Laires M. J., Monteiro C. P., Bicho M. (2004) Front. Biosci. 9, 262–276 [DOI] [PubMed] [Google Scholar]
- 53. Quamme G. A. (2010) Am. J. Physiol. Cell Physiol. 298, C407–C429 [DOI] [PubMed] [Google Scholar]
- 54. Kawahara K., Sato R., Iwabuchi S., Matsuyama D. (2008) Chronobiol. Int. 25, 868–881 [DOI] [PubMed] [Google Scholar]
- 55. Clark K., Langeslag M., van Leeuwen B., Ran L., Ryazanov A. G., Figdor C. G., Moolenaar W. H., Jalink K., van Leeuwen F. N. (2006) EMBO J. 25, 290–301 [DOI] [PMC free article] [PubMed] [Google Scholar]
- 56. Clark K., Middelbeek J., Lasonder E., Dulyaninova N. G., Morrice N. A., Ryazanov A. G., Bresnick A. R., Figdor C. G., van Leeuwen F. N. (2008) J. Mol. Biol. 378, 790–803 [DOI] [PMC free article] [PubMed] [Google Scholar]
- 57. Rosenfeld S. S., Houdusse A., Sweeney H. L. (2005) J. Biol. Chem. 280, 6072–6079 [DOI] [PubMed] [Google Scholar]
- 58. Nagy N. T., Sakamoto T., Takacs B., Gyimesi M., Hazai E., Bikadi Z., Sellers J. R., Kovacs M. (2010) FASEB J. 24, 4480–4490 [DOI] [PMC free article] [PubMed] [Google Scholar]
- 59. Dürrwang U., Fujita-Becker S., Erent M., Kull F. J., Tsiavaliaris G., Geeves M. A., Manstein D. J. (2006) J. Cell Sci. 119, 550–558 [DOI] [PubMed] [Google Scholar]
- 60. Verkhovsky A. B., Borisy G. G. (1993) J. Cell Biol. 123, 637–652 [DOI] [PMC free article] [PubMed] [Google Scholar]
- 61. Huang H. D., Lee T. Y., Tzeng S. W., Horng J. T. (2005) Nucleic Acids Res. 33, W226–W229 [DOI] [PMC free article] [PubMed] [Google Scholar]


