

Abstract
Spinal cerebellar ataxia type 12 (SCA12) has been attributed to the elevated expression of ppp2r2b. To better elucidate the pathomechanism of the neuronal disorder and to search for a pharmacological treatment, Drosophila models of SCA12 were generated by overexpression of a human ppp2r2b and its Drosophila homolog tws. Ectopic expression of ppp2r2b or tws caused various pathological features, including neurodegeneration, apoptosis, and shortened life span. More detailed analysis revealed that elevated ppp2r2b and tws induced fission of mitochondria accompanied by increases in cytosolic reactive oxygen species (ROS), cytochrome c, and caspase 3 activity. Transmission electron microscopy revealed that fragmented mitochondria with disrupted cristae were engulfed by autophagosomes in photoreceptor neurons of flies overexpressing tws. Additionally, transgenic flies were more susceptible to oxidative injury induced by paraquat. By contrast, ectopic Drosophila Sod2 expression and antioxidant treatment reduced ROS and caspase 3 activity and extended the life span of the SCA12 fly model. In summary, our study demonstrates that oxidative stress induced by mitochondrial dysfunction plays a causal role in SCA12, and reduction of ROS is a potential therapeutic intervention for this neuropathy.
Keywords: Antioxidant, Apoptosis, Drosophila, Mitochondria, Neurodegeneration, Reactive Oxygen Species (ROS)
Introduction
The autosomal dominant spinocerebellar ataxias (SCAs)2 comprise a heterogeneous group of neurodegenerative disorders. Currently, at least 30 SCAs with clear genetic origin have been identified. The major pathological hallmark of all SCAs is cerebellar dysfunction, but other symptoms associated with peripheral or central nervous dysfunction may be present in different SCAs. Therefore, it is often impossible to distinguish the subtype based on the clinical presentation (1–3).
SCA12 is a relatively rare neurodegeneration that has mainly been seen in lineages of German-American and Indian descents (4–6). Clinically, patients usually begin with tremor and later with diffuse cerebral and cerebellar atrophy. The expansion of a CAG repeat at the 5′ region of ppp2r2b, a neuron-enriched gene encoding the B regulatory subunit of PP2A, has been shown to be the cause of SCA12 (7). Extensive searches have failed to identify a corresponding polyglutamine (polyQ) tract in the encoded PPP2R2B (Bβ) protein, suggesting that SCA12 is not a polyQ-mediated neurodegeneration (4). The repeat-containing sequence, however, exhibits a promoter activity, and the number of repeats is proportional to the expression level of the reporter gene (8, 9). It was therefore proposed that increases in the expression level of ppp2r2b lead to SCA12. In a cultured cell system, transient overexpression of the Bβ2 isoform of PPP2R2B induced apoptosis in serum-free media (10). Additionally, Bβ2 bears a mitochondrial localization signal that targets the protein to the outer membrane of the organelle, and increased Bβ2 expression has also been found to result in fission of mitochondria (11, 12).
Other than its implication in SCA12, the function of ppp2r2b in mammalian development is less clear. In Drosophila, the twins/abnormal anaphase resolution (tws/aar) gene encodes a homolog of mammalian ppp2r2b (13, 14). Studies have indicated that tws is a multifunctional gene that acts in multiple tissues during development of Drosophila. For instance, larvae homozygous for mutant tws exhibit abnormal mitotic division, suggesting that tws is required for cell cycle regulation (13, 15). Mutation of tws causes pattern duplication in Drosophila imaginal discs, indicating that tws plays a critical role in determining cell fate (14). Moreover, it has been shown that tws regulates the level of Armadillo in response to Wg signaling in wing discs (16). Tws also dephosphorylates Period (PER) in controlling the circadian rhythm of Drosophila (17). Recently, it has been demonstrated that Tws is required to maintain the homeostasis of neuroblasts by restricting atypical PKC in the apical cortex of larval neuroblasts (18).
An animal model for SCA12 is currently unavailable. Because the function of ppp2r2b has been more closely studied in Drosophila, a disease fly model will be suitable for unraveling the pathogenic networks underlying SCA12. In this study, we have established a Drosophila model of SCA12 by overexpression of ppp2r2b or tws. The SCA12 fly model established here displays many pathological features that resemble those of affected individuals, including neuronal apoptosis and pre-mature death. Elevated Tws or Bβ2 also caused morphological and functional impairments of mitochondria. Importantly, we demonstrate that elevated dSod2 expression and antioxidant treatment can alleviate the above phenotypes and improve the life span of the disease fly model. Our findings thus not only shed light on the disease mechanism of SCA12 but also provide a practical medical intervention for the neuronal disorder.
EXPERIMENTAL PROCEDURES
Fly Stocks and Genetics
Transgenic flies carrying UAS-Bβ2 construct (19), UAS-tws (16), UAS-mito-GFP, a matrix-targeted GFP that labels mitochondria (20), and UAS-dSod2 have been described previously (21). The following stocks were obtained from the Bloomington Stock Center. gal4 lines: Act5C-gal4, a ubiquitous driver; Elav-gal4, a pan-neuronal driver; and En-gal4 were used to drive the transgene in respective tissues. The stocks used for clonal analysis were y,w hsFLP12 and y,w Act5c>CD2>gal4;UAS-EGFP/Cyo. The FLP/Gal4 technique was used to generate tws-expressing clones as described previously (22). tws mutant allele, twsp (14). All fly stocks and genetic crosses were maintained on standard yeast/glucose media at 25 °C unless otherwise mentioned.
Drosophila Schneider's 2 (S2) Cells
Drosophila Schneider's 2 (S2) cells (obtained from C. T. Chien) were maintained in Schneider's Drosophila medium (Invitrogen) supplemented with 10% fetal bovine serum (Invitrogen). For transfection of S2 cells Cellfectin® reagent (Invitrogen 10362) was used, following the manufacturer's instructions.
Generation of Expression Construct, dsRNA, and Transgenic Flies
Drosophila tws cDNA (LD12394) was obtained from J. L. Juang of the National Health Research Institutes of Taiwan. A 1501-bp DNA fragment was PCR-amplified using a pair of primers, 5′-CACCATGGGTCGCTGGGGACGGCAG-3′ and 5′-AAATTTATCCTGAAATATGAAGAG-3′. Full-length Bβ2 cDNA was obtained from S. Strack (10). A 1345-bp DNA fragment was PCR-amplified using a pair of primers, 5′-CACCATGAAATGCTTCTCTCGTTAC-3′ and 5′-GTTAACCTTGTCCTGGAATAT-3′. To generate Tws-GFP and Bβ2-GFP expression constructs, the amplified DNA fragments were first cloned into a pENTR/TEV/D vector using the TOPO cloning technology (Invitrogen) and then into a pAWG vector for C-terminal GFP tagging. To generate Tws-NT-GFP, a N-terminal truncated expressing construct, a 267-bp DNA fragment was PCR-amplified using a pair of primers, 5′-CACCATGGGTCGCTGGGGACGGCAG-3′ and 5′-CTGTAGTATAGGACGCACCTTAAG-3′. The amplified DNA fragment was first cloned into a pENTR/TEV/D vector and subsequently into a pAWG vector as described above. The control expression construct expressing GFP, pAG, was generated by deletion of the gateway cassette of the pAWG vector using EcoRV and PstI. The digested DNA fragment was blunt-ended with T4 DNA polymerase and re-joined with T4 DNA ligase. All the expression constructs were verified by sequencing.
To synthesize double-stranded RNA corresponding to the tws gene, a 562-bp DNA fragment containing coding sequences for the tws gene was PCR-amplified using a pair of primers, 5′-GGAGCTAACAGAGGTGATC-3′ and 5′-CACGCTGATCTCATCCTTCTTTCG-3′. To add T7 promoter sequence (5′-TAATACGACTCACTATAGGG-3′) to the amplified DNA fragment, topoisomerase-activated adapters were added PCR products as described previously (23). The T7-containing DNA was re-amplified using the T7 promoter primer. For production and purification of dsRNA, the MEGAscript RNAi kit was used following the manufacturer's instructions (Ambion). Purified dsRNA was resuspended in H2O and stored at −20 °C before use in knockdown experiments. For RNAi-mediated gene silencing, S2 cells were transfected with synthesized dsRNA as described previously (24).
To generate the tws RNA interference construct, UAS-tws-RNAi, a 577-bp DNA fragment was PCR-amplified using a pair of primers, 5′-CGCGTCTAGAGGAGCTAACAGAGGTGATC-3′ and 5′-GGAATCTAGACAGTCCACGCTG-3′ (XbaI site is underlined). The amplified DNA fragment was digested with XbaI and then cloned first into the AvrII site and subsequently into the NheI site of a pWIZ vector as described previously (25). The orientation of the DNA construct was confirmed by restriction enzyme digestion. To generate transgenic flies, a standard germ line transformation procedure using w1118 as the parental line was followed. The silencing efficiency of the transgenic flies carrying UAS-tws-RNAi was determined by RT-PCR (supplemental Fig. S1).
Acridine Orange Staining and Immunocytochemistry
For acridine orange (AO) staining of Drosophila embryos, the same protocol was followed as described elsewhere (26) with minor modifications. Briefly, Drosophila embryos collected at appropriated stages were dechorionated in 50% bleach for 2 min at room temperature. Residual bleach was removed from embryos by briefly washing with H2O. Embryos were transferred to a 20-ml glass vial containing an equal volume of 1× PBS and n-heptane supplemented with AO (Sigma A6014) at a final concentration of 5 mg/ml on a shaking platform. After 5 min of staining, embryos were washed briefly with 1× PBS and mounted with 50% glycerol. Stained embryos were viewed with a TCS SP2 confocal microscope (Leica Microsystems).
Salivary glands and brain lobes from wandering third instar larvae were dissected in 1× PBS and fixed in PBST (1× PBS plus 0.3% Tween 20) containing 3.7% formalin for 10 min at room temperature. The fixed salivary glands and brain lobes were blocked in 1× PBS with 3% bovine serum albumin (BSA) for 10 min. Anti-cytochrome c antibody (Sigma C4993) was used at a dilution of 1:1000. Anti-mouse Alexa 555-conjugated secondary antibody was used at a dilution of 1:500 (Jackson ImmunoResearch). For counterstaining of nuclei, 5 μm DAPI was used.
For labeling of mitochondria and lysosomes in S2 cells, transfected cells were cultured on a coverslip coated with poly-l-lysine (Sigma P9155) at 24 °C. The coverslip with attached S2 cells was harvested after 36–48 h of incubation. S2 cells were incubated with 200 nm MitoTracker Red (Invitrogen M22425) or 80 nm LysoTracker Red DND-99 (Invitrogen L7528) for 1 h in the dark. Hoechst 33342 at 5 μm was used for nuclear staining. Confocal microscopy was performed to reveal the mitochondria and lysosomes in transfected S2 cells. For colocalization analysis, the relative fluorescence intensity profiles for green and red channels were measured along lines traversing the cells (see Fig. 2) and analyzed with ImageJ software (National Institutes of Health) (27).
FIGURE 2.

Subcellular localization of Tws. A–D, control S2 cells expressing GFP showed normal mitochondria. Expression constructs are as follows: F–I, Bβ2-GFP; K–N, Tws-GFP; P–S, Tws-NT-GFP; G–I, Bβ2 localizes to mitochondria. M, Tws induces significant mitochondrial fission. L–N, Tws did not co-localize with MitoTracker. Q–S, Tws does not possess a mitochondrial localization signal. E, J, O, and T, confocal laser scanning histograms of GFP (green) and MitoTracker (red) intensity profile for verification of colocalization. U–X, knocking down the expression of tws using RNAi (tws-RNAi) causes mitochondrial fusion. W and X, tubular mitochondria in S2 cells transfected with dsRNA corresponding to tws (white arrows). GFP, Bβ2-GFP and Tws-GFP (green). Nucleus (Hoechst 33342), blue; mitochondrion (MitoTracker), red. Scale bar, 4 μm.
Western Blotting
30 heads of flies were homogenized in 150 μl of T-PER extraction buffer (Pierce) containing complete protease inhibitors (Roche Applied Science). Concentrations of protein were quantified using a protein assay kit (Bio-Rad). For each sample, 25 μg of protein were mixed in Laemmli buffer (2% SDS, 10% glycerol, 0.25 m Tris, 0.01% bromphenol, 5 mm EGTA, 5 mm EDTA, 25 mm DTT, pH 6.8) and denatured before resolution in a 15% SDS-polyacrylamide gel. Protein blots were blocked in Tris-buffered saline with 0.1% Tween 20 and 2% BSA. The polyclonal rabbit anti-Atg8 (a kind gift from S. Cherry) was used at a dilution of 1:500. For loading control, anti-β-actin antibodies (Abcam, ab8224) were used at dilution of 1:10,000. HRP-conjugated secondary antibody was applied at a dilution of 1:10,000 (Jackson ImmunoResearch). Signals were detected with ECL kits (Millipore) and captured using an imaging system (Fujifilm LAS-3000).
Mitochondrial Imaging and Analyses
Brain lobes from L3 larvae carrying the transgenes for mito-GFP and En-gal4 were dissected in 1× PBS. The dissected brain lobe was directly mounted in 1× PBS and visualized under confocal microscopy. The captured images were digitally enlarged, and the size of mitochondria in the axons of motor neuron was analyzed with Northern Eclipse software (Empix Imaging, Canada). The mitochondrial density was calculated as the number of mitochondria in a given scoring area. Twelve axons randomly selected from three independent flies of each specific phenotype were scored.
ATP Measurement
To measure the ATP level in adult fly heads, a similar protocol was followed (28). Briefly, 30-day-old fly heads were homogenized in reporter lysis buffer (Promega) and frozen immediately in liquid nitrogen. The frozen sample was thawed at room temperature and then re-frozen in liquid nitrogen again. The freezing-thawing cycle was repeated six times, and endogenous ATPase was inactivated by boiling in a hot water bath for 15 min. Samples were centrifuged at 17,900 × g for 5 min to remove debris, and the supernatant was diluted 5–100-fold with reporter lysis buffer (Promega). An ATP bioluminescence assay kit (Roche Applied Science) was used to determine ATP levels. Luminofluorescence was measured using a SpectraMax L microplate reader (Molecular Devices). Concentration of protein from the same sample was also determined using a Lowry protein assay kit (Bio-Rad), and the ATP level was normalized to the protein content.
Mitochondrial Membrane Potential (MMP) Assay
Mitochondria were purified by differential centrifugation from homogenized fly heads in a cold isolation buffer (250 mm sucrose, 2 mm EGTA, and 5 mm Tris-HCl, pH 7.4). Briefly, insoluble debris was removed by centrifugation first at 150 × g for 3 min, and the mitochondria were harvested by spinning the supernatant at 9000 × g for 10 min at 4 °C. Isolated mitochondria were resuspended in Tris-EDTA buffer (50 mm Tris-HCl, pH 7.4, and 0.1 mm EDTA). To determine the mitochondrial membrane potential, 5,5′,6,6′-tetrachloro-1,1′,3,3′-tetraethylbenzimidazolylcarbocyanine iodide (JC-1; Invitrogen M34152), a lipophilic cationic dye that emits red fluorescence at high mitochondrial membrane potentials and green fluorescence at low mitochondrial membrane potentials, was used. Isolated mitochondria were incubated with 2 μm JC-1 for 10 min in the dark at room temperature. Fluorescence was measured using a Gemini XPS microplate reader (Molecular Devices). Mitochondrial membrane potential was expressed as the ratio of emission at 590 nm to the intensity of green fluorescence at 529 nm.
ROS Detection
For detection of ROS in salivary glands, a similar protocol was followed (29). Briefly, third instar larvae were dissected in 1× PBS at room temperature. Tissues were stained in 1× PBS containing freshly prepared dihydroethidium (Invitrogen D11347) at a final concentration of 10 μm for 10 min at 25 °C in the dark. Samples were washed with Schneider's Drosophila medium (Invitrogen) and then with 1× PBS briefly and mounted directly in 1× PBS for visualization using a confocal microscope (Leica TCS SP2).
To detect the relative level of ROS in the heads of control or transgenic flies fed or not fed with antioxidants (Fig. 7A), heads of 10-day-old flies (three per assay) were homogenized in cold lysis buffer (50 mm HEPES, pH 7.4, 5 mm CHAPS, and 5 mm DTT). Dihydroethidium was added to the head homogenate to a final concentration of 10 μm. The reaction mixture was incubated at 25 °C for 10 min in the dark. The fluorescence intensity (relative fluorescence units) was measured at 485 nm excitation/590 nm emission on an Flx800 fluorescence microplate reader (Bio-Tek Instruments).
FIGURE 7.

Reduction of ROS is beneficial in the SCA12 fly model. A–C, administration of antioxidants or expression of dSOD2 reduced ROS levels, concentration of hydrogen peroxide, and caspase 3 activity in heads of transgenic flies overexpressing Tws. The relative ROS level and concentration of hydrogen peroxide were normalized to that of the control Elav-gal4 driver animals. Data were expressed as the mean ± S.D. values and quantified using one-way analysis of variance followed by Student-Newman-Kewls post hoc test; * indicates p < 0.01. D, antioxidants significantly extended the life span of control and tws-expressing flies.
To measure the concentration of hydrogen peroxide (Fig. 7B), 2,7-dichlorofluorescein diacetate (Molecular Probes) was used. Briefly, heads of 1–5-day-old flies were homogenized in 150 μl of T-PER extraction buffer (Pierce). 10 μl of head homogenate was added to 140 μl of PBS containing 50 μm 2,7-dichlorofluorescein diacetate. The reaction mixture was incubated at room temperature for 60 min and the fluorescence was monitored at 485 nm excitation/530 nm emission on a Gemini XPS microplate reader (Molecular Devices). The fluorescence intensity was normalized with the concentration of protein. The assay was repeated three times.
Caspase 3 Activity
Heads of 10- (Fig. 7C) or 30-day-old (Fig. 5I) adult flies (three per assay) were homogenized in cold lysis buffer (50 mm HEPES, pH 7.4, 5 mm CHAPS, and 5 mm DTT). Insoluble debris was cleared by centrifugation at 14,000 × g for 10 min at 4 °C. The caspase 3 fluorometric assay kit (Sigma CASP3F) was used to measure caspase 3 activity following the manufacturer's instructions. Caspase 3 can hydrolyze acetyl-Asp-Glu-Val-Asp-7-amino-4-methylcoumarin to release the fluorescent moiety 7-amino-4-methylcoumarin, which was quantified using an Flx800 fluorescence microplate reader (Bio-Tek Instruments) in comparison with 7-amino-4-methylcoumarin reference standard solutions.
FIGURE 5.

Ectopic Tws disrupted mitochondrial function. A, D, and G, expressed clones in salivary gland and neuroblast were marked by GFP (green with dotted line). B, ROS was labeled with dihydroethidium (DHE, red). C, merged view of A and B. E and H, cytochrome c (red). F, merged view of D and E. I, merged view of G and H. J–L, ATP levels, MMP, and caspase 3 activity in the heads of 30-day-old flies with Elav-gal4 (black bar) and Elav>tws (open bar) were compared. Data are expressed as mean ± S.D. values and analyzed by Student's t test; * indicates p < 0.01.
Transmission Electron Microscopy and Histology
The mouth parts of adult flies were removed, and heads were cut in half before fixing in 1× PBS containing 3.7% formalin and 2.5% glutaraldehyde at 4 °C overnight. Samples were transferred to 1% osmium tetroxide for post-fixation for 2 h at room temperature. After a brief rinse in 1× PBS, samples were stained with uranyl acetate overnight to enhance contrast. Stained heads were washed briefly with 1× PBS and dehydrated in an ethanol series before embedding in Spurr's epoxy resin at 70 °C overnight. Sample blocks were trimmed under a dissecting microscope (Leica), and a series of sections (70 nm) containing brain tissues were cut using a microtome (Leica EM UC6) with a glass knife made on a knife maker (LKB Bromma 7800). Formvar-coated copper grids were used to collect the sequential sections, and the tissues were examined using a transmission electron microscope (JEOL JSM-1200EX II).
Heads from adult flies at different ages were dehydrated in an ethanol series after being fixed in 1× PBS containing 4% formalin for 4 h at room temperature. Samples were briefly aligned and embedded in paraffin overnight. Frontal sections of the adult heads were taken using a microtome (Leica RM2135) with a disposable knife. A series of sections (5 μm) spanning the brain were collected on a glass slide and subject to H&E histology staining according to standard protocols. Stained sections were visualized with a microscope (Leica DMR A2), and images were recorded using a digital camera (Photometrics, CoolSnap 5.0) steered by the Northern Eclipse 6.0 software (EMPIX Imaging Inc.). Numbers of vacuoles (larger than 1 μm in diameter) presented in the regions of the central body, and the lobular plate and the medullar cortex were manually scored. At least 10 hemibrains for each data point were obtained. Student's t test was performed for statistical analysis. Results were considered significant at p < 0.05.
Survivorship Assay
Newly eclosed flies were collected, and groups of 10 adult flies were cultured with standard media in a vial at 25 or 29 °C. Viable flies were scored and transferred to a fresh food vial at 3-day intervals. For each genotype more than 150 flies were used for the assay. The log-rank test was used for evaluating the life span of flies (30). p values less than 0.05 were considered to be statistically significant.
Mobility Assay
A graded climbing assay was applied to access the locomotor activity of flies treated with paraquat (31). The climbing apparatus consisted of a glass tube (30 cm in length and 1.5 cm in diameter) with an attached plastic funnel at one end. The glass tube was divided into a series of five 2-cm scoring areas (scored 1–5) and a buffer zone. For each trial, 10 male flies were tapped down to the bottom of the climbing apparatus and allowed to climb up into the scoring areas for 10 s. All trials were repeated 10 times, and a total of 150 flies was assayed for each time point. The number of flies in each scoring area was counted, and the climbing index was calculated as follows: climbing index = Σ (nm)/10, where n is the number of flies in a given scoring area, and m is the score for the given score area (1–5). At least three independent experiments were performed, and the results were analyzed using Student's t test.
Drug Treatment
For paraquat treatment, a stock solution containing 5% sucrose and 20 mm paraquat (Sigma 856177) was made up in water. A round gel-blotting paper (2 cm in diameter, Schleicher & Schuell, GB 005) was placed at the bottom of an empty vial, and 340 μl of paraquat solution was added to the blotting paper. For the control experiment, 340 μl of 5% sucrose without paraquat was added to the blotting paper. Newly eclosed transgenic and Elav-gal4 flies raised in normal media were starved for 4 h before transferring into the vial. The flies were incubated at 29 °C, and the number of dead flies was scored after 60 h of incubation.
Resveratrol (Sigma R5010) and α-tocopherol (vitamin E, Sigma T3634) were added to yeast/glucose media at final concentrations of 200 μm and 1.5 mm, respectively. For antioxidant treatment, flies were raised in antioxidant-containing media, and untreated flies were raised in yeast/glucose media without antioxidant supplements at 25 °C. To compare the effect of antioxidant, the survivorship assay was conducted at 29 °C. Ten-day-old flies fed or not with antioxidants were used to test the effect of antioxidant on ROS levels and caspase 3 activity (Fig. 7, A and C).
RESULTS
Drosophila Model for SCA12
Increased expression of the ppp2r2b gene has been proposed to be the etiology of SCA12. To generate a Drosophila model for SCA12, ppp2r2b or its Drosophila homolog tws was overexpressed using the UAS/Gal4 system (32). Under the control of the constitutive Act5C-gal4 driver, we found that ubiquitous overexpression of ppp2r2b or tws caused a remarkable degree of apoptosis in Drosophila embryos, as revealed by AO staining (Fig. 1, A–C). Interestingly, most AO-positive cells were found in the ventral nerve cord of embryos, suggesting that neurons are more sensitive to the elevated Bβ2 or Tws levels and that neurodegeneration might be a consequence of apoptosis. We suspected that the lack of apoptosis in the non-neuronal tissues of flies overexpressing tws might be due to insufficient expression of the transgene. To test this, we increased the tws expression level by raising the temperature and found that the numbers of dying cells in both neuronal and non-neuronal tissues were significantly increased (Fig. 1, D–F). This result suggests that the apoptotic propensity of ppp2r2b/Bβ2 or tws is dose-dependent. To better evaluate the neuronal apoptosis phenotype in the fly model, we overexpressed the transgene specifically in neuronal tissues using the pan-neuronal Elav-gal4 driver (supplemental Fig. S1). Targeted expression of ppp2r2b or tws dramatically raised the rate of neuronal death in the ventral nerve cord (Fig. 1, G–J). Neuronal overexpression of tws also reduced the eclosion rate of transgenic flies to 40% (data not shown). The life span of the transgenic flies, although only slightly shorter than control Elav-gal4 driven flies at 25 °C (data not shown), was reduced more profoundly when the longevity assay was performed at 29 °C (Fig. 1K). This result again demonstrated that the detrimental affect of tws is dose-dependent.
FIGURE 1.

Ectopic Tws caused neuropathies. Transgenic construct was constitutively overexpressed with the Act5C-gal4 or Elav-gal4 driver, and apoptotic cells were revealed by AO staining. Transgenic constructs were expressed at 25 °C (A–C and G–I) or 29 °C (D–F). A, control Act5C-gal4 driver flies exhibited normal programmed cell death patterns. B and C, expression of Bβ2 or tws induced cell death, particularly in the ventral cord of embryos. D, cell death was increased slightly in the control Act5C-gal4 driver at 29 °C. E and F, increased AO-positive cells were presented in Act5C>Bβ2 or Act5C>tws embryos. G, normal programmed cell death in the ventral cord of Elav-gal4 flies (ventral view). H and I, neuronal overexpression of Bβ2 or Tws affects viability of neuronal cells in the ventral cord of embryos (ventral view). J, number of dead cells in Elav-gal4 control (black bar), Elav>Bβ2 (gray bar), and Elav>tws (open bar) embryos. Data were expressed as mean ± S.D. values (n = 15) and were analyzed by one-way analysis of variance with supplementary Student-Newman-Kewls (SNK) test. * indicates p < 0.001. K, Tws severely reduces the life span of transgenic flies overexpressing tws at 29 °C. The life span of transgenic flies expressing Bβ2 was also significantly shorter than the control Elav-gal4 (Log-rank test, p = 0.00255). L–O, frontal brain sections of flies were revealed by H&E staining. L and N, neurodegeneration was detected slightly in 1-day-old control Elav-gal4 and Elav>tws flies raised at 29 °C. M, mild vacuolar degeneration was observed in the neuropil (arrow) of 7-day-old Elav-gal4 flies. O, larger and more vacuoles were present in the cortex (arrowhead) and the neuropil (arrow) of aged tws transgenic flies. P, neurodegeneration was assessed by quantification of vacuoles in the brain of flies raised at 29 °C. Number of vacuoles in Elav-gal4 control (black bar) and Elav>tws (open bar) is shown. d, day. Data were expressed as mean ± S.D. values and were analyzed by Student's t test; * indicates p < 0.01. Scale bar, 20 μm.
Neurodegeneration in Drosophila is commonly accompanied by the formation of vacuoles in the brain. To better correlate the extent of neuronal apoptosis and pre-maturity death with neurodegeneration, we examined the brains of our transgenic flies using histological approaches. In Drosophila brain, the basophilic cell bodies of neurons and glia, which occupy the outer cortex, are stained dark purple by H&E, although the eosinophilic processes that are located in the inner neuropil region are pink or light purple after staining. We found no anatomic abnormality in the nervous system of newly eclosed young control and tws transgenic flies (Fig. 1, L and N). The gross morphology of the brain, the organization of major projection systems, and the cortical and neuropil volume appeared normal. In contrast to the young tws transgenics, older transgenic flies showed obvious vacuolization in both cortex and neuropil (Fig. 1O). The number and size of vacuoles increased with age, suggesting that the neurodegeneration is progressive (Fig. 1, N and O). Although few vacuoles were observed occasionally in the brain of older control flies, they were smaller in extent and size than tws transgenics (Fig. 1, M versus O). These results, together with the observations noted earlier, show that the disease fly model recapitulates many characteristic features of SCA12, including neuronal apoptosis, high mortality rate, and short life span, and it is therefore a suitable model for elucidating the underlying pathogenesis of the neuronal disorder.
Tws Modulates Mitochondrial Fusion/Fission Machinery
A previous study showed that the Bβ2 isoform of ppp2r2b can localize to mitochondria and cause fission of the organelle in cultured PC12 cells (11). To test whether the Drosophila Bβ2 homolog, Tws, exhibits the same subcellular localization, cultured Drosophila Schneider2 (S2) cells were transfected with recombinant expression constructs for Bβ2 and Tws fused with C-terminal GFP (Bβ2-GFP and Tws-GFP, respectively). In transfected S2 cells expressing control Bβ2-GFP construct, we clearly observed the localization of Bβ2 to both cytoplasm and mitochondria (Fig. 2, F–I). However, MitoTracker labeling of transfected S2 cells showed that Tws-GFP was localized exclusively in the cytoplasm (Fig. 2, K–N). Mitochondrial proteins, including Bβ2, usually bear an N-terminal localization signal. To determine the subcellular localization of Tws, an expression construct containing the divergent N terminus of Tws (1–89 amino acids) fused with C-terminal GFP (Tws-NT-GFP) was generated. Transient expression of Tws-NT-GFP showed GFP in the cytoplasm, demonstrating that Tws does not possess a mitochondrial targeting sequence. To further confirm the subcellular distribution of Tws protein, the relative fluorescent intensities of GFP (green) and MitoTracker (red) were digitally recorded across the expressing cells (Fig. 2, D, I, N, and S, white lines) to generate histograms of fluorescent intensities (Fig. 2, E, J, O, and T). The fluorescent intensity profile showed an overlap in Bβ2-GFP (green) and MitoTracker (red), indicating the translocation of Bβ2 to mitochondria. By contrast, the fluorescent intensity profiles from GFP-, Tws-GFP-, or Tws-NT-GFP-expressing cells showed that Tws does not colocalize with mitochondria (Fig. 2, E, O and T).
Despite the difference in the subcellular localization, transient overexpression of either Bβ2 or Tws reduced the size of mitochondria in S2 cells (Fig. 2, H and M). The stained mitochondria in the transfected S2 cells expressing either Bβ2 or Tws were very small and exhibited a punctate appearance, markedly different from those in the control GFP- and Tws-NT-GFP-expressing cells (Fig. 2, C and R versus H and M). To confirm this point, we down-regulated endogenous tws with RNAi. Indeed, elongated mitochondria were evident in S2 cells transfected with synthesized double-stranded RNA corresponding to the tws gene (Fig. 2, W and X, white arrows). Our results were consistent with a previous study in which Bβ2 induced fission of mitochondria, and down-regulation of Bβ2 caused fusion of the organelles in PC12 cells (11). These findings also corroborated the notion that function of Tws and Bβ2 in promoting mitochondrial fragmentation is conserved.
Tws Is Involved in the Morphogenesis and Biogenesis of Mitochondria
The neuronal processes of larval ventral ganglia have been shown to be ideal for visualization of mitochondria (33). In addition, tws and ppp2r2b are expressed predominantly in neuronal tissues (7, 13, 15). To better correlate the above mitochondrial phenotype with neuronal pathology of SCA12, we labeled mitochondria with matrix-targeted GFP (mito-GFP) in larval brains. Using the En-gal4 driver, mito-GFP was specifically expressed in the ventral ganglion but not in the optical lobes of third instar larva (supplemental Fig. S2). Image analysis software was used to quantify the number and size of labeled mitochondria in the long axons of the motor neurons. As in tws-expressing S2 cells, the mitochondrion size was significantly reduced in the axons of motor neurons when tws was overexpressed (Fig. 3, A versus B). Moreover, in flies overexpressing tws, the mitochondrial reticulum disintegrated into multiple punctiform organelles that appeared as tiny green spots under a confocal microscope (Fig. 3B). Conversely, we utilized dsRNA-mediated gene silencing to specifically knock down the expression of tws (tws-RNAi). In this case, the mitochondria were consistently larger and longer in En>tws-RNAi flies than in control En-gal4-driven flies, suggesting that down-regulation of tws promoted mitochondrial fusion (Fig. 3, A, C and D). The density of mitochondria was also increased when tws was up-regulated. All these findings demonstrate that Tws promotes fragmentation of mitochondria. Interestingly, both density and total size of mitochondria were found to be increased in En>tws-RNAi flies (Fig. 3, E and F). Together with the facts that the average size of individual mitochondrion in En>tws-RNAi is larger than that of control En-gal4 larvae, this results suggests that tws may also play a repressive role, apart from its function in modulating mitochondrial fission, in regulating the biogenesis of mitochondria.
FIGURE 3.

Tws affects the morphogenesis of mitochondria in CNS. A, mitochondria in the axons of ventral ganglia were labeled with mito-GFP driven by En-gal4. B, fragmentation of mitochondria in En>tws flies. C, fusion of mitochondria in En>tws-RNAi flies. Scale bar, 20 μm. D–F, Tws regulates the size, density, and biogenesis of mitochondria. Statistical analyses were performed using one-way analysis of variance with supplementary Student-Newman-Kewls test and are expressed as mean ± S.D.; * indicates p < 0.001. G–I, ultrastructure of mitochondria in the transverse sections of adult retina was accessed by transmission electron microscopy. Normal mitochondria in Elav-gal4. H, ectopic Tws caused scission of mitochondria (red arrowhead). Many disintegrated mitochondria with less condensed cristae were present (black arrowheads), and some were circled by autophagosome-like organelles (arrows). I and J, tubular mitochondria with swollen cristae were present in Elav>tws-RNAi or tws mutant (twsp flies (white arrowheads). R = rhabdomere. Scale bar, 200 nm.
To assess the aberrant mitochondrial phenotype in more detail, transmission electron microscopy was conducted. Mitochondria in different cell types might exhibit morphological differences, so mitochondria in the cell body of photoreceptors were selectively scored to prevent experimental bias. As in tws-expressing S2 cells and axons, the mitochondria of photoreceptor neurons were considerable smaller when tws was overexpressed (Fig. 3, G versus H). Scission of mitochondria was also observed in the photoreceptor cells (Fig. 3H, red arrowhead). This further supported our hypothesis that tws induces fragmentation of mitochondria. Moreover, we found that the internal cristae of the broken organelle were less condensed and disorganized (Fig. 3H, black arrowheads). Some disrupted mitochondria were also seen to be engulfed by autophagosome-like vacuoles (Fig. 3H, black arrows). By contrast, larger tubular mitochondria were increasingly seen in the photoreceptors of tws-silenced flies (Fig. 3I). However, unlike the mitochondria of the control Elav-gal4 flies, which displayed a normal morphology with dense matrix, the intercristal network within the elongated mitochondria appeared swollen and disorganized in tws-knockdown flies (Fig. 3I, white arrowheads). Similarly, dilated mitochondria with less condensed intercristal structure were also been detected in the photoreceptors of tws mutants (Fig. 3J, white arrowheads). Taken together, these data suggest that tws can modulate the fusion/fission machinery of mitochondria, and a balance of Tws activity is essential for maintaining the integrity of mitochondria and its intercristal structure.
Elevated Tws Causes Mitophagy
Damaged mitochondria are mainly cleared by autophagic sequestration and delivery to lysosomes for hydrolytic degradation. This type of autophagy is denoted as mitophagy. As shown above, mitochondria were engulfed by autophagosome in tws expressing photoreceptors (Fig. 3H). It is expected that ectopic tws may induce an autophagy response. Using LysoTracker, a membrane-permeant dye that labels lysosomes, to monitor the autophagic response, we observed that lysosome numbers were significantly increased in S2 cells expressing Bβ2 (Fig. 4, A–H). The average number of lysosomes in a control S2 cell expressing GFP was 7, whereas ∼15 LysoTracker-positive foci were detected in a Bβ2-expressing cell (Fig. 4, E–H). Tws also elicited the formation of lysosomes to the same degree as Bβ2 (Fig. 4, I–L).
FIGURE 4.

Tws induces autophagic response. Expression constructs are as follows: A–D, GFP; E–H, Bβ2-GFP; I–L, Tws-GFP. Note that ectopic expression of Bβ2 or Tws induced the formation of lysosomes. The outline of transfected S2 cells are marked (green with dotted line). Nucleus (Hoechst 33342), blue; lysosome (LysoTracker), red. Scale bar, 4 μm. M, numbers of lysosomes in S2 cells transfected with GFP (black bar), Bβ2 (gray bar), and Tws (open bar) were compared. Data were expressed as mean ± S.D. values and analyzed by one-way analysis of variance with supplementary Student-Newman-Kewls test. * indicates p < 0.001. N, representative immunoblot showed that Atg-I (∼16 kDa) was presented in the heads of flies. However, a smaller form of Atg8-II (∼14 kDa) was induced only in flies expressing Bβ2 or Tws. Loading control, β-actin. O, quantitative Western blotting analysis of the relative expression levels of Atg8-I. The expression levels were normalized to the β-actin control. Data were expressed as mean ± S.D. values and analyzed by Student's t test; * indicates p < 0.01 (n = 4).
To further confirm that Bβ2/Tws elicit autophagy response in flies, we demonstrated that the production of Atg8-I and Atg8-II, a lapidated Atg8 that translocated onto autophagosomes during the induction of autophagy, was increased significantly in the heads of transgenic flies overexpressing either tws or Bβ2 (Fig. 4, N and O). Our results were consistent with a previous study in which the expression of light chain 3-tagged GFP (LC3-GFP), an autophagic reporter, was increased in Bβ2-expressing SK-N-SH cells (34). These results, together with the observation that mitochondria were encircled by membrane-bound autophagosomes (Fig. 3H), allowed us to conclude that Tws and Bβ2 induce mitophagy.
Tws Impairs Mitochondrial Functions
Because mitochondria control many cellular processes, including ATP synthesis, ROS production, calcium homeostasis, and apoptosis, the defective mitochondria in flies overexpressing tws imply that the physiological function of mitochondria might be compromised. Using the ROS-sensing dye dihydroethidium, we found that ROS were significantly increased in salivary gland cells of third instar larva overexpressing tws (Fig. 5, A–C). Cellular ATP was also reduced by ∼50% in the heads of adult flies expressing tws driven by Elav-gal4 (Fig. 5J). Because generation of ATP is mainly driven by the MMP, the decline in cellular energy levels implied that MMP was not maintained upon tws expression. Indeed, using a voltage-sensitive probe, JC-1, we found that elevated tws expression significantly reduced MMP in the heads of transgenic flies (Fig. 5K). Moreover, immunocytochemistry revealed that Cyt c appeared as fluorescent puncta in normal control cells (Fig. 5E). However, these fluorescent foci were largely absent, and Cyt c showed a diffuse immunostaining pattern throughout the cytoplasma of tws-expressing cells (Fig. 5, D–F). Similarly, diffused Cyt c staining pattern was also observed in the neuroblasts of the tws-expressing larvae (Fig. 5, G–I). These data demonstrated that ectopic tws not only causes fragmentation of mitochondria but also increases outer membrane permeability. Despite the great debate over the role of Cyt c in promoting apoptosis of Drosophila (35, 36), we found that caspase 3 activity was significantly higher in the heads of transgenic flies overexpressing tws than control Elav-gal4-driven cells (Fig. 5L). Taken together, these observations indicate that fragmentation of mitochondria does impair the physiological function of the organelle, and ectopic tws-mediated apoptosis is very likely to be a result of the mitochondrial dysfunction as well as oxidative stresses.
Tws Transgenic Flies Were More Sensitive to Paraquat
Because the ROS levels were higher in tws-expressing cells (Fig. 5, A–C), we expected that tws transgenic flies may be more susceptible to oxidative injury. To test this, 20 mm paraquat, a widely used free radical generator, was administered to control Elav-gal4 and tws transgenic flies in a survivorship assay. The survival rate of transgenic and control flies did not show significant differences when the assay was performed at 25 °C (data not shown). To better differentiate the effect of paraquat, we then increased the expression level of tws by raising the temperature. Although the survival rate of control Elav-gal4 flies was reduced to 93.2% after 60 h of incubation in the presence of paraquat at 29 °C, only 85% of transgenic flies overexpressing Bβ2 survived under the same conditions (Fig. 6A). Similar observation has also been made with the tws-expressing flies, in which 83.5% of transgenic flies survived when challenged with paraquat (Fig. 6A). Additionally, both Bβ2- and tws-expressing flies performed more poorly in a mobility assay when challenged with paraquat, whereas control flies were less susceptible to the drug (Fig. 6B). Based on these results, we concluded that the tws-expressing flies were more sensitive to oxidative injury, and higher ROS levels were very likely to be a causative factor of SCA12.
FIGURE 6.
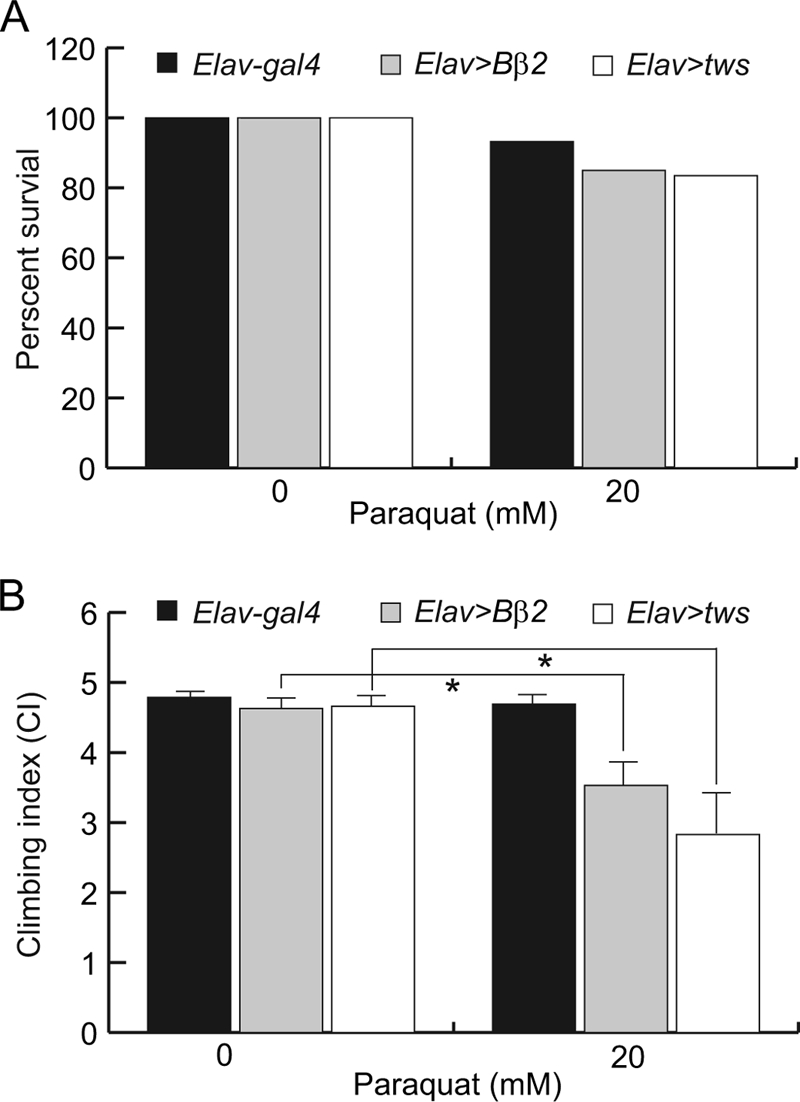
Transgenic flies overexpressing Bβ2 or tws are more sensitive to oxidative injury. Newly eclosed Elav-gal4 (black bar), Elav>Bβ2 (gray bar), and Elav>tws (open bar) flies were exposed to drug-free or to 20 mm paraquat at 29 °C. A, survivorship was scored after 60 h. Compared with no drug treatment, administration of 20 mm paraquat reduced the survival of control Elav-gal4 by 6.8% and the survival of Bβ2 and tws transgenic flies was reduced by 16.5 and 15%, respectively. B, mobility assay was performed after 48 h. The mobility of control Elav-gal4 flies was not severely impaired in the presence of paraquat, but the climbing index was significantly lowered when Bβ2 or tws transgenic flies were challenged with paraquat. Data were expressed as mean ± S.D. values and analyzed by Student's t test; * indicates p < 0.01.
Superoxide Dismutase and Antioxidants Reduce ROS and Caspase 3 Activity and Extend Life Span of SCA12 Transgenic Flies
The fact that tws induced mitochondrial abnormality and thereby increased Cyt c release, ROS production, and apoptosis prompted the notion that decreasing oxidative stress by superoxide dismutase or antioxidant treatment maybe beneficial. We first tested whether overexpression of dSod2, a manganese superoxide dismutase, was capable of reversing the deleterious effect of ectopic tws. The levels of ROS and hydrogen peroxide in transgenic flies coexpressing tws and dSod2 were significantly lower than those in tws-expressing flies (Fig. 7, A and B). Interestingly, unlike α-tocopherol and resveratrol, which decreased cellular ROS significantly in control Elav-gal4-driven flies, ectopic expression of dSOD2 was unable to reduce ROS levels (Fig. 7A). It is possible that dSOD2 is a mitochondrial protein and that it may therefore not contribute profoundly to reducing the entire cellular ROS in control Elav-gal4 flies. However, because mitochondria seem to be the primary target of Tws, overexpression of dSod2 may directly counteract the effect of Tws in the organelle. Despite these differences, treatment with antioxidants and overexpression of dSod2 effectively decreased caspase 3 activity in the heads of tws-expressing flies (Fig. 7C).
To further demonstrate that the ectopic tws-induced phenotype is amenable to pharmacological intervention, we determined the life span of control Elav-gal4 and Tws transgenic flies with or without two potent antioxidants, resveratrol and α-tocopherol. Consistent with previous studies (37), we found that resveratrol and α-tocopherol extended the life span of control Elav-gal4 flies (Fig. 7D). Moreover, both chemicals dramatically extended the life span of tws-expressing flies (Fig. 7D). Interestingly, resveratrol, although more potent in reducing caspase 3 activity in the heads of 10-day-old tws transgenic flies than α-tocopherol, was unable to provide a long lasting protective effect in a survivorship assay (Fig. 7, C and D). Additionally, we found dSod2 exhibited the same protective effect as α-tocopherol in extending the life span of both the control cohort and tws transgenic flies (Fig. 7D). Thus, our findings suggested that reducing ROS is a potential therapeutic strategy for SCA12.
DISCUSSION
PP2A is a major cellular serine/threonine phosphatase that is implicated in many processes, including cell cycle regulation, transcription, signal transduction, and apoptosis (38, 39). PP2A includes a scaffold A subunit, a catalytic C subunit, and a variety of regulatory B subunits that control subcellular localization and substrate specificity of the trimeric enzyme (39). Unlike the constitutively expressed A and C subunits, the expression of B subunit is tissue-specific and developmentally regulated. It is expected that different regulatory B subunits will compete with each other in the formation of the functional trimeric phosphatase, depending on their binding affinity and the amount available in a certain cell. Thus, the phenotype observed by manipulating a given B regulatory subunit should be regarded as resulting from an interplay of existing B subunits. For instance, ectopic expression of Tws induced apoptosis, indicating that PP2A may modulate cell death through recruiting specific death regulatory subunits. Based on the above scenario, it is equally possible that other B regulatory subunits of PP2A required for cell survival were out-competed by Tws for the formation of functional holoenzyme when Tws was overexpressed. In other words, the ectopic apoptotic phenotype observed in the tws-overexpressing embryos could have resulted from loss-of-function of the survival regulatory subunits rather than any gain-of-function of tws. Among all B regulatory subunits of PP2A, the B56 regulatory subunit encoded by widerborst (wdb) gene has been reported to be required for cell survival in Drosophila (40). Although this study did not test directly whether deficits in wdb contributed to ectopic tws-induced apoptosis, we found that co-overexpression of tws and the catalytic C subunit of PP2A encoded by microtubule star gene (mts) synergistically increased the rough eye phenotype, whereas down-regulation of tws completely blocked retinal apoptosis in mts-expressing flies (supplemental Fig. S3). This finding indicates that PP2A-induced apoptosis is probably mediated through at least Tws. Interestingly, retinal overexpression of a dominant negative mts (mtsDN) did not cause visible apoptosis in fly ommatidia. Moreover, coexpression of tws and mtsDN resulted in depigmentation in fly eyes, although knocking down the expression of tws suppressed the phenotype (supplemental Fig. S3). To our surprise, cellular PP2A activity was lower in the heads of tws-expressing flies (supplemental Fig. S3), suggesting that dephosphorylation of specific downstream targets of Tws plays a more important role in promoting apoptosis. Nonetheless, these results corroborate the notion that gain of tws function promotes apoptosis.
In this study, we show that ubiquitous overexpression of the Drosophila Bβ regulatory subunit of PP2A encoded by tws gene can promote apoptosis, particularly in the central nervous system (Fig. 1, A–C), suggesting that neuronal tissue is more vulnerable to ectopic Tws expression. Moreover, targeted expression of tws using a pan-neuronal driver increased cell death in the ventral nerve cord of embryos, and it reduced the life span of adult flies in a dose-dependent manner (Fig. 1, G–K). These results together with the facts that the promoter activity of ppp2r2b is correlated with the length of the CAG repeat (8) and expansion of the trinucleotide repeat to pathological lengths dramatically increased gene expression (9) support the notion that overexpression of ppp2r2b can cause SCA12.
ppp2r2b is alternatively spliced into two major isoforms, namely Bβ1 and Bβ2, which encode divergent N termini that confer different subcellular localization of the protein. Bβ1 is an exclusively cytoplasmic protein, whereas Bβ2 is normally localized to both cytosol and mitochondria (10). Previous studies found that overexpression of Bβ2 promotes apoptosis in growth factor-deprived neuronal PC12 cells (10, 11). Additionally, Bβ2 was found to be translocated to mitochondria in response to stress stimuli, which resulted in fragmentation of the organelle and apoptosis (12). These studies implied that ectopic Bβ2-induced apoptosis is mediated through mitochondrial fragmentation. Here, we found that overexpression of tws also caused severe mitochondrial fission and apoptosis in Drosophila (Figs. 1, H–K, and 2, F–O). Additionally, apart from the fact that Bβ2 and Tws share 67% amino acid sequence similarity, neuronal overexpression of Bβ2 can rescue the survival of a homozygous tws mutants (supplemental Fig. S4). These results suggest that functions of tws and ppp2r2b are likely to be conserved in mammals and invertebrates. Nevertheless, we have noted several discrepancies regarding the function of both genes. For instance, unlike the elevated PPP2R2B-induced apoptosis that occurred only when the transfected cell was under stress (10), the overexpression of tws alone was sufficient to induce cell death in Drosophila (Fig. 1, C, F, I, and J). Moreover, it has been reported that Bβ2-induced apoptosis requires recruitment of PP2A to the outer mitochondrial membrane (12). However, our study shows that Tws neither co-localizes with mitochondria nor possesses a mitochondrial localization signal (Fig. 2, K–T), indicating that mitochondrial localization of Tws is not absolutely required for fragmentation of mitochondria and cell death in Drosophila.
Mitochondria are dynamic organelles that continuously undergo fission and fusion in living cells. In this study, we showed that Tws activity indeed modulated the mitochondrial dynamics in Drosophila. The sizes of mitochondria decreased although the numbers of mitochondria significantly increased (Fig. 3, B, D, and E). By contrast, RNA interference-mediated knockdown of tws increased the size of mitochondria in axons of the larval brain (Fig. 3, C and D). Interestingly, tws is also likely to play a suppression role in regulating the biogenesis of mitochondria because size and number of mitochondria were both increased in the axons of tws-RNAi larva (Fig. 3, C–F). The expression level of tws was also shown to affect the morphology of mitochondria, with smaller, broken mitochondria found in the brain of tws-expressing flies (Fig. 3H). Additionally, damaged mitochondria were found to be sequestered in autophagosomes (Fig. 4H), and lysosome formation as well as the expression of Atg8 were consistently increased in tws- and Bβ2-expressing cells (Fig. 4, E–O). Consistent with our observation, autophagosomal marker was reported to be increased in ppp2r2b-expressing cells (34). Because autophagy is initiated usually in response to damaged and superfluous organelles, we suspect that the presence of autophagosomes might be a consequence of mitochondrial impairments induced by ectopic tws. PP2A activity has been shown to correlate with the induction of autophagy in yeast and mammals (41, 42). Because activity of PP2A is significantly lower in tws-expressing flies (supplemental Fig. S3), we argue that tws may not play a direct role in inducing autophagic response.
As discussed above, ectopic Tws-induced apoptosis is very likely to be a result of increased activity of PP2A toward specific death effectors. Previous studies have shown that PP2A promoted apoptosis by dephosphorylation of both proapoptotic and antiapoptotic Bcl2 family proteins (43–45). Moreover, increased Bcl2 expression can suppress apoptosis of Bβ2-expressing neurons (12). All these suggest that PP2A-induced apoptosis is mediated through Bβ. However, at present there is no direct evidence to support any direct interaction between Bβ/Tws and Bcl2. Particularly, epistasis analysis demonstrated that Bcl2 acts downstream of Drp1 and Fis1, two important proteins regulating mitochondrial fission, to promote apoptosis in Bβ2-expressing neurons (12). Thus, it is possible that the mitochondrial fission/fusion machinery, rather than Bcl2, is a direct target of Bβ/Tws. In a preliminary study to investigate this, we found that components of mitochondrial fission/fusion machinery, including pink1, opa1, and marf, interact with tws genetically.3 It is very likely that tws modulates mitochondrial fission through regulation of the abovementioned genes. Currently, the epistatic relationship between these genes and tws is being investigated.
Despite the fact that direct downstream targets of Tws that modulate the mitochondrial fission/fusion machinery have yet to be identified, we believe that severe mitochondrial damage is the primary cause of cell death and neurodegeneration in tws-expressing flies. Aberrant mitochondrial fission has been shown to be correlated with cell death progression, by increasing the permeabilization of the mitochondrial membranes and the release of Cyt c (46, 47). As demonstrated above, ectopic tws induced fragmentation of mitochondria and increased cytosolic Cyt c levels as well as caspase 3 activity (Figs. 3, B and H, and 5, E and I). In addition, ROS levels increased significantly when Tws was ectopically expressed (Figs. 5B and 7A). Because mitochondria are one of the major sources of cellular ROS, the increase in ROS levels is very likely to result from the disintegration of these organelles induced by ectopic Tws. In this study, we demonstrated that ROS contribute greatly to the pathogenesis of SCA12. For instance, as in ppp2r2b-expressing SK-N-SH cells, which are more sensitive to oxidative damage (34), viability and motor function of our transgenic SCA12 fly model were more sensitive to the effects of paraquat (Fig. 6, A and B). More importantly, we demonstrated that dSod2 and antioxidants effectively reduced the ROS level and caspase 3 activity and extended the life span of SCA12 model flies (Fig. 7, A–D). Taken together, these data suggest that ectopic tws-induced neuronal apoptosis is, at least in part, mediated by oxidative damage and that reducing the ROS level by enhancing dSod2 expression or antioxidant treatment is a practical medical intervention for SCA12.
Supplementary Material
Acknowledgments
We thank H. Sun, T. Uemura, S. Cherry, L. S. Shashidhara, C. T. Chien, S. Strack, H. D. Wang, J. L. Juang, Fly Core of Taiwan, and the Bloomington Stock Center for fly stocks, S2 cells, cDNA, antibodies, and reagents. We also thank the Molecular Image Core of National Taiwan Normal University and the Electron Microscope Center of National Taiwan University for confocal and transmission electron microscopy imaging. We thank anonymous reviewers and the editor for their comments.
This work was supported by the National Science Council Grants NSC 95-2311-B-003-006-MY2 and NSC 96-2311-B-003-005 of Taiwan and National Taiwan Normal University Grant 96TOP001.

The on-line version of this article (available at http://www.jbc.org) contains supplemental Figs. S1–S4.
M.-T. Su, unpublished data.
- SCA
- spinocerebellar ataxia
- ROS
- reactive oxygen species
- AO
- acridine orange
- MMP
- mitochondrial membrane potential
- Cyt c
- cytochrome c.
REFERENCES
- 1. Dueñas A. M., Goold R., Giunti P. (2006) Brain 129, 1357–1370 [DOI] [PubMed] [Google Scholar]
- 2. Manto M., Marmolino D. (2009) Curr. Opin. Neurol. 22, 419–429 [DOI] [PubMed] [Google Scholar]
- 3. Trujillo-Martín M. M., Serrano-Aguilar P., Monton-Alvarez F., Carrillo-Fumero R. (2009) Mov. Disord. 24, 1111–1124 [DOI] [PubMed] [Google Scholar]
- 4. Holmes S. E., Hearn E. O., Ross C. A., Margolis R. L. (2001) Brain Res. Bull. 56, 397–403 [DOI] [PubMed] [Google Scholar]
- 5. Holmes S. E., O'Hearn E., Margolis R. L. (2003) Cytogenet. Genome Res. 100, 189–197 [DOI] [PubMed] [Google Scholar]
- 6. Sinha K. K., Worth P. F., Jha D. K., Sinha S., Stinton V. J., Davis M. B., Wood N. W., Sweeney M. G., Bhatia K. P. (2004) J. Neurol. Neurosurg. Psychiatry 75, 448–452 [DOI] [PMC free article] [PubMed] [Google Scholar]
- 7. Holmes S. E., O'Hearn E. E., McInnis M. G., Gorelick-Feldman D. A., Kleiderlein J. J., Callahan C., Kwak N. G., Ingersoll-Ashworth R. G., Sherr M., Sumner A. J., Sharp A. H., Ananth U., Seltzer W. K., Boss M. A., Vieria-Saecker A. M., Epplen J. T., Riess O., Ross C. A., Margolis R. L. (1999) Nat. Genet. 23, 391–392 [DOI] [PubMed] [Google Scholar]
- 8. Chen C. M., Hou Y. T., Liu J. Y., Wu Y. R., Lin C. H., Fung H. C., Hsu W. C., Hsu Y., Lee S. H., Hsieh-Li H. M., Su M. T., Chen S. T., Lane H. Y., Lee-Chen G. J. (2009) Am. J. Med. Genet. 150B, 124–129 [DOI] [PubMed] [Google Scholar]
- 9. Lin C. H., Chen C. M., Hou Y. T., Wu Y. R., Hsieh-Li H. M., Su M. T., Lee-Chen G. J. (2010) Hum. Genet. 128, 205–212 [DOI] [PubMed] [Google Scholar]
- 10. Dagda R. K., Zaucha J. A., Wadzinski B. E., Strack S. (2003) J. Biol. Chem. 278, 24976–24985 [DOI] [PubMed] [Google Scholar]
- 11. Dagda R. K., Barwacz C. A., Cribbs J. T., Strack S. (2005) J. Biol. Chem. 280, 27375–27382 [DOI] [PMC free article] [PubMed] [Google Scholar]
- 12. Dagda R. K., Merrill R. A., Cribbs J. T., Chen Y., Hell J. W., Usachev Y. M., Strack S. (2008) J. Biol. Chem. 283, 36241–36248 [DOI] [PMC free article] [PubMed] [Google Scholar]
- 13. Gomes R., Karess R. E., Ohkura H., Glover D. M., Sunkel C. E. (1993) J. Cell Sci. 104, 583–593 [DOI] [PubMed] [Google Scholar]
- 14. Uemura T., Shiomi K., Togashi S., Takeichi M. (1993) Genes Dev. 7, 429–440 [DOI] [PubMed] [Google Scholar]
- 15. Mayer-Jaekel R. E., Ohkura H., Gomes R., Sunkel C. E., Baumgartner S., Hemmings B. A., Glover D. M. (1993) Cell 72, 621–633 [DOI] [PubMed] [Google Scholar]
- 16. Bajpai R., Makhijani K., Rao P. R., Shashidhara L. S. (2004) Development 131, 1007–1016 [DOI] [PubMed] [Google Scholar]
- 17. Sathyanarayanan S., Zheng X., Xiao R., Sehgal A. (2004) Cell 116, 603–615 [DOI] [PubMed] [Google Scholar]
- 18. Chabu C., Doe C. Q. (2009) Dev. Biol. 330, 399–405 [DOI] [PMC free article] [PubMed] [Google Scholar]
- 19. Yeh P. A., Chien J. Y., Chou C. C., Huang Y. F., Tang C. Y., Wang H. Y., Su M. T. (2010) Biochem. Biophys. Res. Commun. 391, 510–516 [DOI] [PubMed] [Google Scholar]
- 20. Cox R. T., Spradling A. C. (2003) Development 130, 1579–1590 [DOI] [PubMed] [Google Scholar]
- 21. Missirlis F., Hu J., Kirby K., Hilliker A. J., Rouault T. A., Phillips J. P. (2003) J. Biol. Chem. 278, 47365–47369 [DOI] [PubMed] [Google Scholar]
- 22. Pignoni F., Zipursky S. L. (1997) Development 124, 271–278 [DOI] [PubMed] [Google Scholar]
- 23. Yarovinsky T. O. (2000) BioTechniques 28, 1160, 1162–1165 [DOI] [PubMed] [Google Scholar]
- 24. Clemens J. C., Worby C. A., Simonson-Leff N., Muda M., Maehama T., Hemmings B. A., Dixon J. E. (2000) Proc. Natl. Acad. Sci. U.S.A. 97, 6499–6503 [DOI] [PMC free article] [PubMed] [Google Scholar]
- 25. Lee Y. S., Carthew R. W. (2003) Methods 30, 322–329 [DOI] [PubMed] [Google Scholar]
- 26. Abrams J. M., White K., Fessler L. I., Steller H. (1993) Development 117, 29–43 [DOI] [PubMed] [Google Scholar]
- 27. Bolte S., Cordelières F. P. (2006) J. Microsc. 224, 213–232 [DOI] [PubMed] [Google Scholar]
- 28. Senoo-Matsuda N., Igaki T., Miura M. (2005) EMBO J. 24, 2700–2713 [DOI] [PMC free article] [PubMed] [Google Scholar]
- 29. Owusu-Ansah E., Yavari A., Banerjee U. (2008) Protocol Exchange, DOI: 10.1038/nprot.2008.1023 [DOI] [Google Scholar]
- 30. Peto R., Peto J. (1972) J. R. Stat. Soc. A 135, 185–207 [Google Scholar]
- 31. Todd A. M., Staveley B. E. (2004) Drosophila Information Service 87, 101–107 [Google Scholar]
- 32. Brand A. H., Perrimon N. (1993) Development 118, 401–415 [DOI] [PubMed] [Google Scholar]
- 33. Louie K., Russo G. J., Salkoff D. B., Wellington A., Zinsmaier K. E. (2008) Comp. Biochem. Physiol. 151, 159–172 [DOI] [PMC free article] [PubMed] [Google Scholar]
- 34. Cheng W. T., Guo Z. X., Lin C. A., Lin M. Y., Tung L. C., Fang K. (2009) BMC Cell Biol. 10, 91 [DOI] [PMC free article] [PubMed] [Google Scholar]
- 35. Wang C., Youle R. J. (2009) Annu. Rev. Genet. 43, 95–118 [DOI] [PMC free article] [PubMed] [Google Scholar]
- 36. Wasilewski M., Scorrano L. (2009) Trends Endocrinol. Metab. 20, 287–294 [DOI] [PubMed] [Google Scholar]
- 37. Bauer J. H., Goupil S., Garber G. B., Helfand S. L. (2004) Proc. Natl. Acad. Sci. U.S.A. 101, 12980–12985 [DOI] [PMC free article] [PubMed] [Google Scholar]
- 38. Eichhorn P. J., Creyghton M. P., Bernards R. (2009) Biochim. Biophys. Acta 1795, 1–15 [DOI] [PubMed] [Google Scholar]
- 39. Van Hoof C., Goris J. (2003) Biochim. Biophys. Acta 1640, 97–104 [DOI] [PubMed] [Google Scholar]
- 40. Li X., Scuderi A., Letsou A., Virshup D. M. (2002) Mol. Cell. Biol. 22, 3674–3684 [DOI] [PMC free article] [PubMed] [Google Scholar]
- 41. Beck T., Hall M. N. (1999) Nature 402, 689–692 [DOI] [PubMed] [Google Scholar]
- 42. Holen I., Gordon P. B., Seglen P. O. (1992) Biochem. J. 284, 633–636 [DOI] [PMC free article] [PubMed] [Google Scholar]
- 43. Chiang C. W., Kanies C., Kim K. W., Fang W. B., Parkhurst C., Xie M., Henry T., Yang E. (2003) Mol. Cell. Biol. 23, 6350–6362 [DOI] [PMC free article] [PubMed] [Google Scholar]
- 44. Ray R. M., Bhattacharya S., Johnson L. R. (2005) J. Biol. Chem. 280, 31091–31100 [DOI] [PubMed] [Google Scholar]
- 45. Ruvolo P. P., Clark W., Mumby M., Gao F., May W. S. (2002) J. Biol. Chem. 277, 22847–22852 [DOI] [PubMed] [Google Scholar]
- 46. Frank S., Gaume B., Bergmann-Leitner E. S., Leitner W. W., Robert E. G., Catez F., Smith C. L., Youle R. J. (2001) Dev. Cell 1, 515–525 [DOI] [PubMed] [Google Scholar]
- 47. Yu T., Fox R. J., Burwell L. S., Yoon Y. (2005) J. Cell Sci. 118, 4141–4151 [DOI] [PubMed] [Google Scholar]
Associated Data
This section collects any data citations, data availability statements, or supplementary materials included in this article.