

Abstract
Background
The hippocampus is likely involved in mood disorders but in vivo evidence for the role of anatomically distinct hippocampal subregions is lacking. Multiple sclerosis (MS), an inflammatory disease of the CNS, is linked to a high prevalence of depression as well as hippocampal atrophy and may thus provide important insight into the pathological correlates of medical depression. Here, we examine the role of subregional hippocampal volume for depression in relapsing-remitting (RR) MS.
Methods
Anatomically defined hippocampal subregional volumes (Cornu Ammonis 1 (CA1), CA2–CA3 and the Dentate Gyrus (CA23DG), Subiculum, Entorhinal Cortex) were measured using a high resolution T2-weighted magnetic resonance imaging (MRI) sequence in 29 RRMS patients and 20 matched healthy controls. Diurnal salivary cortisol was assessed at awakening, 4pm and 9pm on two consecutive days. Subjects also completed the Beck Depression Inventory (BDI-II).
Results
MS patients showed smaller hippocampal volumes compared to controls, particularly in the CA1 and Subiculum subregions. In addition, MS patients with depressive symptoms (BDI-II > 13) also showed smaller CA23DG volumes and higher cortisol levels. Within the MS group, CA23DG volume was correlated with depressive symptoms and cortisol levels. There were no associations with number of previous steroid treatments, global atrophy, or disease duration.
Conclusions
This report provides in vivo evidence for selective association of smaller CA23DG subregional volumes in the hippocampus with cortisol hypersecretion and depressive symptoms in MS.
Keywords: relapsing-remitting multiple sclerosis, depression, cortisol, neurodegeneration, hippocampus, cornu ammonis
Introduction
Depression is one of the most common symptoms in patients with multiple sclerosis (MS) with a point prevalence of major depressive disorder (MDD) of 13–30% and a lifetime risk of 25–50% (Siegert and Abernethy 2005). Depression in MS has a significant impact on cognitive function (Feinstein 2006), quality of life (Jonsson et al 1996), work performance (Vickrey et al 1995), and treatment compliance (Mohr et al 1997) and is one of the strongest predictors of suicide (Feinstein 1997). Despite the high clinical relevance, depression is underdiagnosed and undertreated in MS and its pathogenetic mechanisms remain unclear (Goldman 2005). Depression in MS is not related to the severity of neurological impairment (Moller et al 1994), can occur at any stage of the disease (Sullivan et al 1995b) and thus does not seem to be simply a psychological reaction to the burden of a serious neurological disorder. Some (Bakshi et al 2000; Feinstein et al 2004; Zorzon et al 2001) but not all (Zorzon et al 2002) studies using magnetic resonance imaging (MRI) have shown associations of depression in MS with lesion load in several brain areas including the frontal, parietal, and temporal lobe, but these efforts failed to reveal a consistent pattern. More consistent associations have been reported with regional atrophy, in particular in the temporal lobe (Feinstein et al 2004; Zorzon et al 2001; Zorzon et al 2002), but such studies lacked the spatial specificity to pinpoint any particular anatomical structure.
The hypothesis of a neuroendocrine-limbic etiology of depression in MS has received comparatively little attention, despite the fact that the most consistently reproduced biological findings in psychiatric patients with major depressive disorder (MDD) include hyperactivity of the hypothalamo-pituitary-adrenal (HPA) axis (Pariante and Lightman 2008) and smaller volumes of the hippocampus (Koolschijn et al 2009). The hippocampus is a complex structure in the medial temporal lobe with anatomically and functionally distinct subregions (cornu ammonis (CA), dentate gyrus (DG), subiculum, entorhinal cortex). Post mortem and in vivo MRI studies have shown hippocampal damage in MS (Benedict et al 2009; Geurts et al 2007; Geurts et al 2006; Papadopoulos et al 2009; Sicotte et al 2008) as well as its animal model, experimental autoimmune encephalomyelitis (EAE) (Ziehn et al 2010). Interestingly, there is accumulating evidence that the HPA axis activity is increased in up to 50% of MS patients, particularly in the progressive stage of the disease (Heesen et al 2007). One study recently demonstrated that subtle increases in HPA axis activity are already detectable in relapsing-remitting MS (RRMS) (Ysrraelit et al 2008). We have previously hypothesized that hyperactivity of the HPA axis in MS may be associated with neurodegneration in susceptible brain areas such as the hippocampus and thereby contribute to neuropsychological and psychiatric symptoms of the disease (Gold et al 2005). Furthermore, our previous study (Sicotte et al 2008) suggested a selective vulnerability of hippocampal subregions in MS. Findings from animal and in vitro studies indicate that the CA1 region may be most susceptible to mechanisms such as excitotoxicity (Gee et al 2006; Wang et al 2005) and thereby generally be affected in MS. In contrast, the CA3 and DG regions are particularly vulnerable to effects of elevated endogenous glucocorticoids (Conrad 2008) and may therefore be preferentially affected in the subgroup of MS patients with HPA axis hyperactivity.
In the present study, we explore whether selective atrophy in subregions of the hippocampus may be associated with the high frequency of depressive symptoms in MS. Additionally, we test whether specific subregional atrophy may be linked to alterations in diurnal cortisol secretion.
Materials and Methods
Subjects
Subjects were recruited from the UCLA Multiple Sclerosis clinic and from the community. The research protocol was approved by the UCLA Human Subjects Protection Committee and informed consent was obtained. Patients met diagnostic criteria for clinically definite RRMS according to McDonald criteria (McDonald et al 2001). Patients were excluded if they had a relapse and/or received steroids within the previous 3 months. Patients underwent standard neurological exam to obtain clinical information and disability rating (Expanded Disability Status Scale, EDSS) (Kurtzke 1983). The EDSS has a range from 0 (normal neurological examination) to 10 (death due to MS). EDSS scores of 1.0 through 4.5 refer to people with MS who are ambulatory. EDSS scores of 5.0 through 9.5 are defined by increasing ambulation impairment.
Subjects with a history of drug or alcohol abuse within the last 3 years were excluded. Control subjects were free of any neurological or medical conditions, were on no medications, and had normal neurological examinations. All subjects completed the self-report versions of the BDI-II questionnaire for assessment of depressive symptoms (Beck et al 1996) and the Beck Anxiety Inventory (BAI) for assessment of Anxiety (Beck and Steer 1990). The 21-item BDI-II and BAI self-report questionnaire assesses depressive and anxiety symptoms in the past week rating their intensity on a scale from 0 to 3 (total score range 0–63). A total of 49 subjects (29 RRMS and 20 healthy controls) were enrolled in the study.
Magnetic Resonance Imaging
Imaging was performed on a Siemens 3.0 T Tim Trio unit. A T1-weighted three-dimensional volume scan (MPRAGE, TR 2200/TE 3.4/TI 900/1 mm3/FOV 25.6/1 NEX/176 axial slices) was acquired to determine brain volume measures. In addition, a fluid attenuated inversion recovery (FLAIR) scan was acquired to quantify white matter lesion volumes (TR 11760/TE 88/TI 2500/3 mm thick, 0 mm spacing/FOV 25.6/50 slices). A high-resolution coronal EPI structural sequence was obtained for the hippocampal structural segmentation procedures (TR 8290/TE 64/3 mm thick, 0 mm spacing/FOV 20 cm/matrix 512×512/2 NEX/19 slices) with in-plane resolution of 400 µm × 400 µm.
Segmentation procedure
Digital image data was transferred to a Macintosh workstation for analysis. The high-resolution T2-weighted coronal scan was displayed and landmarks were identified beginning in the most anterior slice as described previously (Sicotte et al 2008). Absolute volume measurements (in mm3) were determined for each of the four regions within the medial temporal lobe including: Cornu Ammonis 1 (CA1), CA2–CA3 and the Dentate Gyrus considered as a single region (CA23DG), Subiculum (Sub), Entorhinal Cortex (ERC). The in vivo procedure lacks sufficient resolution to distinguish between the CA2–3 and DG, which are thus considered as a single region.
The reliability and accuracy of the segmentation procedure is high. For reliability assessment, six hippocampi from six different individuals were segmented three times each by an experienced, blinded investigator. Coefficients of variance (COV, calculated as ((standard deviation / mean)*100)) of volumes for all subregions were low (CA1=2.3, CA23DG=2.2, Sub=5.4, ERC=6.8). Kappa coefficients of voxel-wise agreement were consistently higher than 0.80 (CA1=0.89, CA23DG=0.92, Sub=0.85, ERC=0.87), indicating excellent reliability.
Measures from all four regions were combined to yield a total hippocampal volume for each hemisphere. Volumes of left and right hippocampi were added to yield a total hippocampal volume. Image data were processed while blinded to group assignment. A single investigator with experience in this technique performed all of the segmentations.
Global atrophy and lesion quantification
Brain volume were determined for each subject from the T1-volumetric MRI using a fully automated technique, Structural Image Evaluation, using Normalization, of Atrophy for cross-sectional studies (SIENAX) (Smith et al 2002). The volume-correction factor was used for the normalization procedure described later. Brain parenchymal fraction (BPF) was also determined using SIENAX as a measure of global atrophy. White matter lesions were manually traced on the FLAIR scan and quantified using FSL tools by a trained operator who was blind to all clinical details (Smith et al 2004). Values for white matter lesions using FLAIR images are given in cubic centimeters (cm3).
Normalization procedure
To control for variations in head size that influence hippocampal size, absolute hippocampal volumes were multiplied by the volume-correction factor determined by SIENAX, yielding corrected hippocampal volumes.
Cortisol
Salivary cortisol samples were obtained using Salivette collection devices (Sarstedt AG, Nümbrecht, Germany) at awakening, 4 p.m. and 9 p.m. on two consecutive days. Participants were instructed on the correct use of the Salivettes and to refrain from drinking, eating, smoking, brushing their teeth and using mouthwash in the 30 min prior to salivary collection. Samples were spun down, aliquoted, and stored at −20C until assayed. Cortisol levels were determined in duplicate by commercially available competitive binding assay kits (R&D Systems, San Diego) according to manufacturer’s instructions. Plates were read on a Multiskan ELISA plate reader at 450nm with correction readings at 570nm. This assay is validated for analysis of human saliva samples. All samples from any given subject were run on the same plate and samples from patients and controls were run in parallel. The detection limit of this assay is 0.07 ng/mL. Cortisol levels were log-transformed. Circadian slope was computed using linear regression of log-transformed values for each day. Cortisol levels showed the typical decline over the course of the day so that a slope closer to zero indicates a flatter circadian profile. Cortisol slope was significantly correlated between day 1 and day 2 (r=.51, p<.001) and was therefore averaged. Two control subjects failed to return the saliva samples and salivettes from two additional control subjects were returned with insufficient sample amount for determining cortisol levels. Cortisol samples were thus available from 29 MS patients and 16 controls.
Statistical analysis
Brain and cortisol measures were compared between MS patients and control subjects using independent samples t tests as well as univariate ANOVA controlling for global atrophy (BPF). Three group comparisons (Control vs. MS non-depressed vs. MS depressed) were conducted using univariate ANOVA with Bonferroni-adjusted post-hoc tests. Four group comparisons (Controls vs. untreated nondepressed MS patients vs. MS patients with well-controlled depression vs. MS patients with untreated depression) were tested using univariate ANOVA with Dunnett’s post-hoc tests comparing each MS patient group to healthy controls.
Associations between brain, endocrine and BDI scores were examined using Spearman’s rank correlation. A stepwise linear regression model was used to predict regional hippocampal atrophy, using cortisol slope, global atrophy, gray matter atrophy, disease duration, and age as predictors.
Values of p<.05 were considered statistically significant. All statistical analyses were conducted using Predictive Analytics Software (PASW) Statistics 17.0 for Macintosh.
Results
RRMS patients and healthy controls were well matched for age and gender (see Table 1). As expected, patients had significantly lower brain parenchymal fraction (BPF) indicating global atrophy on MRI. In addition, patients also had significantly higher levels of depressive symptoms and anxiety.
Table 1.
Demographic and clinical characteristics of patients with relapsing-remitting multiple sclerosis (RRMS) and healthy control subjects.
| Healthy controls | RRMS | p | |
|---|---|---|---|
| n | 20 | 29 | |
| Age | 35.1±1.9 | 37.5±1.6 | .33 |
| Male/Female | 2 / 18 | 4 / 25 | .69 |
| Brain atrophy (BPF) | 0.84±0.004 | 0.82±0.005 | .006 |
| Lesion volume [cm3] | N/A | 7.1±2.0 | |
| EDSS | N/A | 2.5±0.2 | |
| Disease duration | N/A | 6.7±1.0 | |
| DMT (None, IFNβ, GA, Nat) | N/A | 7 / 13 / 8 / 1 | |
| BDI-II | 1.6±0.5 | 9.5±1.6 | <.001 |
| BAI | 2.1±0.6 | 8.3±1.4 | .001 |
| SSRI treatment | 0 | 6 |
BPF=Brain Parenchymal Fraction; EDSS=Expanded Disability Status Scale, DMT=disease-modifying therapy; IFNβ=Interferon-β GA=Glatiramer Acetate; Nat=Natalizumab; BDI=Beck Depression Inventory, BAI=Beck Anxiety Inventory; SSRI=Selective serotonin reuptake inhibitor
MS patients showed significantly lower volumes (corrected for head size) in the CA1 subregion (p<.001) and – to a lesser extent – the Subiculum (p=.002, Figure 2A), resulting in significantly smaller total hippocampal volumes (p=.01, Figure 2B). In contrast, no significant differences were observed in CA23DG or the ERC (Figure 2A). Group differences were identical after statistically controlling for global atrophy (CA1 p<.001; CA23DG p=.27; Subiculum p=.001; ERC p=.12; total hippocampus p=.01).
Figure 2. Regional hippocampal atrophy in RRMS.

Compared to healthy controls (n=20), MS patients (n=29) had significantly smaller volumes in Cornu Ammonis 1 (CA1) as well as Subiculum (Sub) but not CA2–CA3 and the Dentate Gyrus (CA23DG) or Entorhinal Cortex (ERC) (A). Consequently, MS patients showed significantly smaller total hippocampal volumes (B). MS patients also showed subtle elevations in evening cortisol levels (C) resulting in flatter cortisol slopes, which however fell short of statistical significance (D).
MS patients also showed subtle alterations in cortisol profiles with unchanged morning levels but slightly elevated evening levels (Figure 2C), resulting in a flatter cortisol slope (Figure 2D), although this fell short of statistical significance (p=.08).
Since MS patients had higher levels of depressive symptoms, and exhibited smaller hippocampal volumes as well as subtle alterations in the HPA axis, we further explored the possibility that hippocampal volume and cortisol slopes are related to severity of depressive symptoms. Based on published cut-off scores for the BDI-II (Beck et al 1996), MS patients were classified as non-depressed (BDI-II score 0–13, n=21) or as having depressive symptoms indicative of mild to moderate depression (BDI-II score 14 or higher, n=8). No healthy control subject had BDI-II scores above the cut-off. As expected, BDI grouping showed highly significant differences in depressive symptoms and anxiety but no differences in age or gender distribution between the depressed and non-depressed MS patients. Importantly, there were also no differences in global atrophy, lesion load, or number of steroid treatments received previously (see Table 2).
Table 2.
Demographic and clinical characteristics of patients with relapsing-remitting multiple sclerosis (RRMS) below and above the clinical cut-off for likely depression.
| MS (BDI-II 0–13) |
MS (BDI-II>13) |
p | |
|---|---|---|---|
| n | 21 | 8 | |
| Age | 38.1±1.6 | 35.9±4.2 | .53 |
| Male/Female | 3 / 18 | 2 / 6 | .59 |
| Brain atrophy (BPF) | 0.82±0.006 | 0.82±0.01 | .81 |
| Lesion volume [cm3] | 7.0±2.1 | 7.4±4.9 | .93 |
| Steroid treatments | 1.4±0.3 | 1.9±0.9 | .51 |
| BDI-II | 4.9±0.9 | 21.6±2.2 | <.001 |
| BAI | 5.0±0.9 | 17.3±2.6 | <.001 |
| SSRI treatment | 5 | 1 |
BPF=Brain Parenchymal Fraction; BDI=Beck Depression Inventory; BAI=Beck Anxiety Inventory; SSRI=Selective serotonin reuptake inhibitor
Both depressed and non-depressed MS groups showed smaller volumes in CA1 and Subiculum compared to healthy controls (Figure 3A). Importantly, MS patients above the BDI-II cut-off also showed smaller volumes in the CA23DG region. Neither of the groups differed from healthy controls in ERC volumes. Driven by the significantly smaller CA23DG volumes in depressed patients, only MS patients above the BDI-II cut-off showed significantly smaller total hippocampus volumes compared to controls (Figure 3B). Group differences yielded a very similar pattern when analyzing subregions of the left and right hippocampus separately (see Supplementary Table 1).
Figure 3. Selective regional hippocampal atrophy and HPA axis activity in MS patients with higher levels of depressive symptoms.

MS patients were classified as non-depressed (BDI-II 0–13, n=21) or mild-to-moderately depressed (BDI-II>13, n=8) according to published cut-offs. Both MS groups showed smaller volumes in Cornu Ammonis 1 (CA1) as well as Subiculum (Sub) compared to healthy controls (n=20). However, only MS patients with elevated depressive symptoms also showed atrophy in CA2–CA3 and the Dentate Gyrus (CA23DG) (A). As a result, only MS patients with depressive symptoms exhibited smaller total hippocampal volumes (B). In addition, only MS with depressive symptoms had elevated evening cortisol levels (C) and thus significantly flatter cortisol slopes (D).
In addition, MS patients above the BDI-II cut-off also showed marked flattening of cortisol profiles. This was characterized by elevated evening levels but unchanged cortisol levels in the morning (Figure 3C), resulting in significantly flatter slopes (Figure 3D) compared to non-depressed MS patients. In contrast, cortisol profiles and slope were not different between non-depressed MS patients and controls (Figure 3C and D). This indicates that diurnal cortisol flattening due to elevated evening cortisol (i.e. failure to decrease cortisol responses throughout the day) is associated with depression in MS, and not MS patients as a whole.
In addition to group comparisons, we next examined if there were direct correlations between depressive symptoms, subregional hippocampal volumes, and cortisol levels within the MS group. Spearman rank correlations revealed a significant inverse correlation between BDI-II scores and volume of the CA23DG region (r=−.38, p=.04, Figure 4A) but no other region of the hippocampus. Cortisol slope was significantly associated with CA23DG volumes (r=−.46, p=.01, Figure 4B) but no other region of the hippocampus. A stepwise linear regression model (R=.39, Adjusted R2=.12, p=.04) revealed that cortisol slope (β=−.39, p=.04) was the only significant predictor of CA23DG volume while global atrophy (β=.17, p=.36), total gray matter volume (β=.15, p=.42), age (β=.07, p=.72), disease duration (β=−.13, p=.50), and previous steroid treatments (β=−.04, p=.85) were not predictive. When disability (EDSS) was also entered, it added significantly to the explained variance (R=.56, Adjusted R2=.26, p=.008), however, cortisol slope remained the strongest predictor (cortisol β=−.43, p=.014; EDSS β=−.40, p=.02).
Figure 4. Selective and specific associations between depressive symptoms, subregional hippocampal volumes and cortisol levels in RRMS.
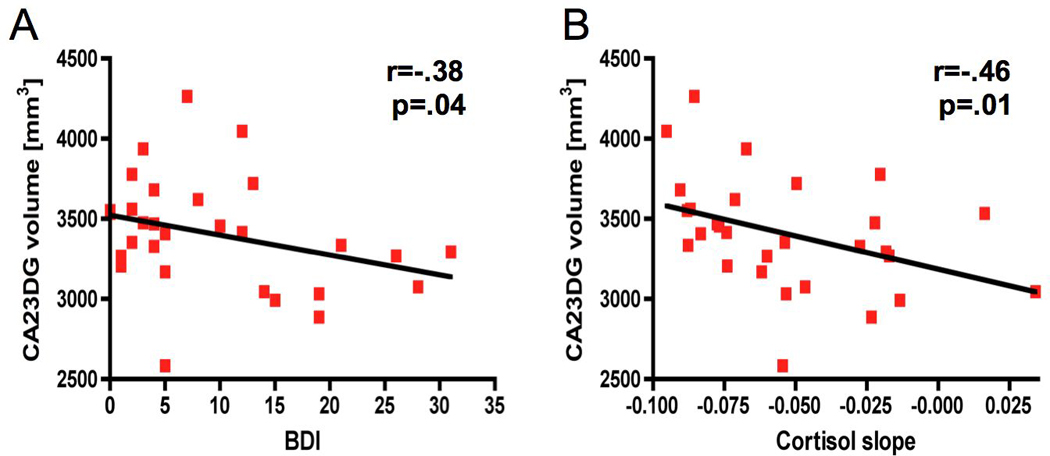
Within the MS group (n=29), there was a significant inverse correlation between BDI-II depression scores and volumes in CA23DG (A). In addition, smaller volumes in the CA23DG region were associated with flatter cortisol slope (B).
Interestingly, while cortisol slope equally correlated with the left (r=−.41, p=.027) and the right (r=−.40, p=.03) CA23DG, correlations between CA23DG and depressive symptoms as measured by the BDI-II showed somewhat lateralized associations (left CA23DG-BDI r=−.34, p=.07; right CA23DG-BDI r=−.26, p=.16). This is in line with some previous studies in MDD suggesting a stronger association of the left hippocampus with depression (Bremner et al 2000; Mervaala et al 2000).
Lastly, we examined the role of antidepressant treatment on hippocampal volumes and cortisol levels. A total of six patients received selective serotonin reuptake inhibitors (SSRIs). Only one subject had BDI levels above the cut-off despite anti-depressive medication while the other five had BDI scores below the cut-off, indicative of effective anti-depressive therapy. We compared hippocampal volumes and cortisol slopes between four groups: Normal controls (n=20), non-depressed MS patients (based on the BDI cut-off) who did not take SSRIs (n=16), MS patients who were taking SSRIs and had BDI scores below the cut-off (indicative of well-controlled depression, n=5) and MS patients with unmedicated depression (n=7). Analyses revealed that only MS patients with unmedicated depression had significantly smaller volumes in CA23DG (supplementary Figure 1A), and total hippocampus (supplementary Figure 1B) as well as flatter cortisol slopes (supplementary Figure 1C) compared to healthy controls. In contrast, MS patients with ‘well-controlled depression’ showed values similar to non-depressed MS patients and healthy controls.
Discussion
To our knowledge, this study provides the first in vivo evidence in humans that anatomically distinct hippocampal subregions play a differential role in relation to depressive symptoms: The CA23DG subfield specifically was affected only in MS patients with depressive symptoms. In addition, flatter cortisol profiles – due to elevated evening values but normal morning levels - were also only detectable in MS patients with depressive symptoms. Lastly, there was an inverse correlation between the CA23DG subfield volumes, BDI scores and cortisol levels, but not with other subregions or disease-related variables such as the global atrophy, EDSS, or disease duration. In contrast to the specificity of the CA23DG subfield relationship with depressive symptoms, CA1 and (to a lesser degree) the Subiculum were generally affected in MS compared to healthy controls, confirming our previous findings (Sicotte et al 2008).
This suggests that some forms of depression in MS may be caused by similar mechanisms hypothesized for major depressive disorder in psychiatric patients. In line with this hypothesis, previous studies using surface mappings have suggested some regional clusters of hippocampal atrophy in MDD, although these methods are not suitable to delineate anatomically defined substructures (Ballmaier et al 2008; Posener et al 2003) and potential underlying biological mechanisms such as HPA axis activity were not studied.
Evidence from basic science studies corroborates a differential vulnerability of hippocampal subregions: CA1 is highly susceptible to a variety of insults including ischemia and glutamate-mediated excitotoxicity (Gee et al 2006; Wang et al 2005), which has been implicated in MS-related CNS damage (Gonsette 2008). Conversely, the CA23 fields are most susceptible to damage by prolonged cortisol treatment in primates (Sapolsky et al 1990). In rodents, high levels of endogenous glucocorticoids have effects localized to the CA3 region of the hippocampus (Conrad 2008) and chronic stress has been shown to cause retraction of dendrites in the CA3 and decrease neurogenesis in the DG (McEwen 1999). Some in vitro studies suggest that glucocorticoids in the physiological range exacerbate neuron loss in the CA3 caused by excitotoxicity (Dinkel et al 2003). Notably, in the present study, there were no associations of hippocampal volumes with previous exposure to high dose steroid treatment, suggesting that endogenous rather than exogenous glucocorticoids are associated with regional CA23DG atrophy and depressive symptoms in MS.
From our cross-sectional study it is impossible to determine a cause-effect relationship between cortisol levels, CA23DG volume and depressive symptoms in these MS patients. It is however interesting to note that a causal role of HPA axis hyperactivity has been proposed for mediating smaller hippocampal volumes in major depressive disorder (MDD) (Pariante and Lightman 2008). Based on experimental data in rodents and primates, smaller hippocampal volumes in MDD had long been thought to be mediated by neuronal apoptosis (Sapolsky 2000) or by decreasing neurogenesis (Henn and Vollmayr 2004). However, post mortem studies failed to show significant neuronal apoptosis in the hippocampus of patients with MDD and the effect on neurogenesis are likely too small to account for the considerable decreases in hippocampal volume (Czeh and Lucassen 2007). Thus, it has recently been proposed that hippocampal atrophy in depression is mediated by potentially reversible mechanisms (e.g., reduced extracellular fluid content, cellular shrinkage, and dendritic retraction) rather than neuronal apoptosis (Czeh and Lucassen 2007). Interestingly, dendritic remodeling is also likely to most strongly affect the CA3 and DG since incoming fibers from the entorhinal cortex to the dentate gyrus are ramified several hundred-fold between the dentate gyrus and CA3 pyramidal neurons, making this an area of particularly dense synaptic connections (McEwen 2003). It is intriguing that our data suggest normal CA23DG, total hippocampus and cortisol levels in MS patients who were taking SSRIs and had low depressive symptoms. Although this should be interpreted with caution, it is consistent with the notion that effective therapy could potentially reverse hippocampal volume loss. Similar cross-sectional observations have been reported for total hippocampal volume in psychiatric patients with MDD (Sheline et al 2003). Alternatively, certain subtypes of depression that are not associated with hippocampal volume loss and HPA axis hyperactivity may be more responsive to pharmacological therapy. Finally, the association may be coincidental, as from our data we cannot rule out that these subjects received SSRIs without ever exhibiting elevated depressive symptoms. This is impossible to determine in a cross-sectional study and should thus be investigated longitudinally.
Based on these findings we hypothesize that even subtle hyperactivity of the HPA axis may produce smaller volumes in the CA23DG and thereby lead to depressive symptomatology in MS. If this is the case, the question remains what activates the HPA axis in some patients but not others. It is becoming increasingly clear that inflammation may contribute to depressive symptomatology (Dantzer et al 2008). Since CNS inflammation is a hallmark of MS, this is a likely candidate. It should be noted that the interrelations between neurohormonal activation and immune system responses are highly complex and the cause-effect relationship between these bi-directionally linked systems in MS depression remains to be elucidated (Gold and Irwin 2009). An alternative, non-mutually exclusive, mechanism could include damage to brain areas involved in HPA axis feedback regulation such as the hypothalamus, which has been shown to be affected in a subgroup of MS patients using MRI (Zellini et al 2009) as well as in a post mortem study (Huitinga et al 2001).
Some limitations of this study have to be considered. First, from this cross-sectional study no conclusions can be drawn regarding a causal relationship between HPA axis activity, regional hippocampal volume and depressive symptoms. Thus, further studies using longitudinal MRI evaluations as well as animal models are warranted to determine a cause-effect relationship between cortisol levels and CA23DG volume. Second, our patients did not have a clinical diagnosis of MDD. Using a cut-off similar to ours on the BDI has previously been shown to successfully identify about 70% of MS patients with MDD but may still miss about 30% of these patients (Sullivan et al 1995a). Therefore, our non-depressed group may include patients who would meet criteria of MDD. However, should this be the case, our results likely under- rather than overestimate the association of depression, cortisol and hippocampal subregional volumes in MS. Notably, the current conceptualization of MDD is dimensional and continuous rather than categorical (Prisciandaro and Roberts 2009) and our data (Figure 4) also suggest a continuous association between depressive symptoms, smaller CA23DG volumes, and cortisol levels and in MS. Further investigation of these associations in MS patients with a clinical diagnosis of MDD in comparison to psychiatric patients with MDD but no neurological comorbidity could yield important insight into the disease-specificity of these mechanisms. Based on our data, we would hypothesize that psychiatric patients with MDD (but no comorbid MS) should exhibit normal CA1 but decreased CA23DG volumes.
In summary, our results suggest that smaller volumes in the CA23DG subfield of the hippocampus are linked to depressive symptoms in MS, and associated with subtle hyperactivity in diurnal cortisol secretion.
Supplementary Material
Figure 1. High-resolution MR scanning of the hippocampus.
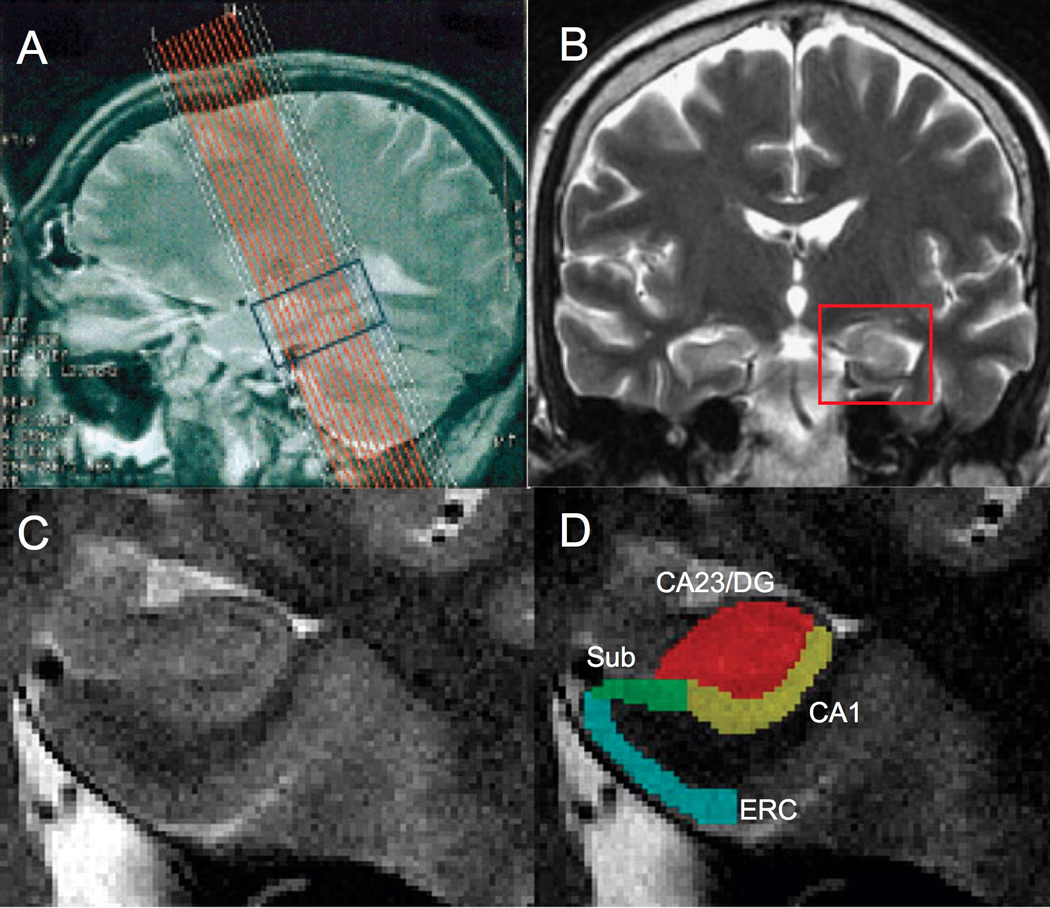
The sagittal T2-weighted scout image illustrates the superimposed slice prescription for 16 coronal structural images covering the hippocampal formation (A). High-resolution T2-weighted coronal image (B) indicating region shown in (C). Magnified images of the hippocampus (C) were segmented using color-coded masks of hippocampal subregions (D). MR scan resolution is not adequate to differentiate the dentate gyrus and CA2 and CA3 fields separately so they are considered as a single subregion (CA23DG). Red = Dentate gyrus and CA2&3 (CA23DG); yellow = CA1; green = Subiculum (Sub), blue = Entorhinal cortex (ERC).
Acknowledgments
This study was supported by the National Multiple Sclerosis Society (NMSS, RG3914), the National Institutes of Health (K01 AG028404), the Cousins Center for Psychoneuroimmunology at UCLA, and generous support from Claire and William Vaughn. Stefan M Gold was in part supported by a postdoctoral fellowship from the NMSS (FG-1702-A1). The authors would like to acknowledge Dr Richard Olmstead for statistical assistance.
Abbreviations
- BAI
Beck Anxiety Inventory
- BDI
Beck Depression Inventory
- CA
cornu ammonis
- DG
dentate gyrus
- ERC
entorhinal cortex
- HPA axis
hypothalamo-pituitary-adrenal axis
- MDD
major depressive disorder
- MS
multiple sclerosis
- MRI
magnetic resonance imaging
- RR
relapsing-remitting
- Sub
Subiculum
Footnotes
Financial disclosure
None of the authors has any conflicting financial interests to declare.
References
- Bakshi R, Czarnecki D, Shaikh ZA, Priore RL, Janardhan V, Kaliszky Z, Kinkel PR. Brain MRI lesions and atrophy are related to depression in multiple sclerosis. Neuroreport. 2000;11:1153–1158. doi: 10.1097/00001756-200004270-00003. [DOI] [PubMed] [Google Scholar]
- Ballmaier M, Narr KL, Toga AW, Elderkin-Thompson V, Thompson PM, Hamilton L, et al. Hippocampal morphology and distinguishing late-onset from early-onset elderly depression. Am J Psychiatry. 2008;165:229–237. doi: 10.1176/appi.ajp.2007.07030506. [DOI] [PMC free article] [PubMed] [Google Scholar]
- Beck AT, Brown G, Steer RA. Beck Depression Inventory II manual. San Antonio, TX: The Psychological Corporation; 1996. [Google Scholar]
- Beck AT, Steer RA. Beck Anxiety Inventory. San Antonio, TX: The Psychological Corporation; 1990. [Google Scholar]
- Benedict RH, Ramasamy D, Munschauer F, Weinstock-Guttman B, Zivadinov R. Memory impairment in multiple sclerosis: correlation with deep grey matter and mesial temporal atrophy. J Neurol Neurosurg Psychiatry. 2009;80:201–206. doi: 10.1136/jnnp.2008.148403. [DOI] [PubMed] [Google Scholar]
- Bremner JD, Narayan M, Anderson ER, Staib LH, Miller HL, Charney DS. Hippocampal volume reduction in major depression. Am J Psychiatry. 2000;157:115–118. doi: 10.1176/ajp.157.1.115. [DOI] [PubMed] [Google Scholar]
- Conrad CD. Chronic stress-induced hippocampal vulnerability: the glucocorticoid vulnerability hypothesis. Rev Neurosci. 2008;19:395–411. doi: 10.1515/revneuro.2008.19.6.395. [DOI] [PMC free article] [PubMed] [Google Scholar]
- Czeh B, Lucassen PJ. What causes the hippocampal volume decrease in depression? Are neurogenesis, glial changes and apoptosis implicated? Eur Arch Psychiatry Clin Neurosci. 2007;257:250–260. doi: 10.1007/s00406-007-0728-0. [DOI] [PubMed] [Google Scholar]
- Dantzer R, O'Connor JC, Freund GG, Johnson RW, Kelley KW. From inflammation to sickness and depression: when the immune system subjugates the brain. Nat Rev Neurosci. 2008;9:46–56. doi: 10.1038/nrn2297. [DOI] [PMC free article] [PubMed] [Google Scholar]
- Dinkel K, MacPherson A, Sapolsky RM. Novel glucocorticoid effects on acute inflammation in the CNS. J Neurochem. 2003;84:705–716. doi: 10.1046/j.1471-4159.2003.01604.x. [DOI] [PubMed] [Google Scholar]
- Feinstein A. Multiple sclerosis, depression, and suicide. Bmj. 1997;315:691–692. doi: 10.1136/bmj.315.7110.691. [DOI] [PMC free article] [PubMed] [Google Scholar]
- Feinstein A. Mood disorders in multiple sclerosis and the effects on cognition. J Neurol Sci. 2006;245:63–66. doi: 10.1016/j.jns.2005.08.020. [DOI] [PubMed] [Google Scholar]
- Feinstein A, Roy P, Lobaugh N, Feinstein K, O'Connor P, Black S. Structural brain abnormalities in multiple sclerosis patients with major depression. Neurology. 2004;62:586–590. doi: 10.1212/01.wnl.0000110316.12086.0c. [DOI] [PubMed] [Google Scholar]
- Gee CE, Benquet P, Raineteau O, Rietschin L, Kirbach SW, Gerber U. NMDA receptors and the differential ischemic vulnerability of hippocampal neurons. Eur J Neurosci. 2006;23:2595–2603. doi: 10.1111/j.1460-9568.2006.04786.x. [DOI] [PubMed] [Google Scholar]
- Geurts JJ, Bo L, Roosendaal SD, Hazes T, Daniels R, Barkhof F, et al. Extensive hippocampal demyelination in multiple sclerosis. J Neuropathol Exp Neurol. 2007;66:819–827. doi: 10.1097/nen.0b013e3181461f54. [DOI] [PubMed] [Google Scholar]
- Geurts JJ, Reuling IE, Vrenken H, Uitdehaag BM, Polman CH, Castelijns JA, et al. MR spectroscopic evidence for thalamic and hippocampal, but not cortical, damage in multiple sclerosis. Magn Reson Med. 2006;55:478–483. doi: 10.1002/mrm.20792. [DOI] [PubMed] [Google Scholar]
- Gold SM, Irwin MR. Depression and immunity: inflammation and depressive symptoms in multiple sclerosis. Immunol Allergy Clin North Am. 2009;29:309–320. doi: 10.1016/j.iac.2009.02.008. [DOI] [PMC free article] [PubMed] [Google Scholar]
- Gold SM, Mohr DC, Huitinga I, Flachenecker P, Sternberg EM, Heesen C. The role of stress-response systems for the pathogenesis and progression of MS. Trends Immunol. 2005;26:644–652. doi: 10.1016/j.it.2005.09.010. [DOI] [PubMed] [Google Scholar]
- Goldman The Goldman Consensus statement on depression in multiple sclerosis. Mult Scler. 2005;11:328–337. doi: 10.1191/1352458505ms1162oa. [DOI] [PubMed] [Google Scholar]
- Gonsette RE. Oxidative stress and excitotoxicity: a therapeutic issue in multiple sclerosis? Mult Scler. 2008;14:22–34. doi: 10.1177/1352458507080111. [DOI] [PubMed] [Google Scholar]
- Heesen C, Gold SM, Huitinga I, Reul JM. Stress and hypothalamic-pituitary-adrenal axis function in experimental autoimmune encephalomyelitis and multiple sclerosis - a review. Psychoneuroendocrinology. 2007;32:604–618. doi: 10.1016/j.psyneuen.2007.05.002. [DOI] [PubMed] [Google Scholar]
- Henn FA, Vollmayr B. Neurogenesis and depression: etiology or epiphenomenon? Biol Psychiatry. 2004;56:146–150. doi: 10.1016/j.biopsych.2004.04.011. [DOI] [PubMed] [Google Scholar]
- Huitinga I, De Groot CJ, Van der Valk P, Kamphorst W, Tilders FJ, Swaab DF. Hypothalamic lesions in multiple sclerosis. J Neuropathol Exp Neurol. 2001;60:1208–1218. doi: 10.1093/jnen/60.12.1208. [DOI] [PubMed] [Google Scholar]
- Jonsson A, Dock J, Ravnborg MH. Quality of life as a measure of rehabilitation outcome in patients with multiple sclerosis. Acta Neurol Scand. 1996;93:229–235. doi: 10.1111/j.1600-0404.1996.tb00512.x. [DOI] [PubMed] [Google Scholar]
- Koolschijn PC, van Haren NE, Lensvelt-Mulders GJ, Hulshoff Pol HE, Kahn RS. Brain volume abnormalities in major depressive disorder: A meta-analysis of magnetic resonance imaging studies. Hum Brain Mapp. 2009 doi: 10.1002/hbm.20801. [DOI] [PMC free article] [PubMed] [Google Scholar]
- Kurtzke JF. Rating neurologic impairment in multiple sclerosis: An expanded disability status scale (EDSS) Neurology. 1983;33:1444–1452. doi: 10.1212/wnl.33.11.1444. [DOI] [PubMed] [Google Scholar]
- McDonald WI, Compston A, Edan G, Goodkin D, Hartung HP, Lublin FD, et al. Recommended diagnostic criteria for multiple sclerosis: guidelines from the International Panel on the diagnosis of multiple sclerosis. Ann Neurol. 2001;50:121–127. doi: 10.1002/ana.1032. [DOI] [PubMed] [Google Scholar]
- McEwen BS. Stress and hippocampal plasticity. Annu Rev Neurosci. 1999;22:105–122. doi: 10.1146/annurev.neuro.22.1.105. [DOI] [PubMed] [Google Scholar]
- McEwen BS. Interacting mediators of allostasis and allostatic load: towards an understanding of resilience in aging. Metabolism. 2003;52:10–16. doi: 10.1016/s0026-0495(03)00295-6. [DOI] [PubMed] [Google Scholar]
- Mervaala E, Fohr J, Kononen M, Valkonen-Korhonen M, Vainio P, Partanen K, et al. Quantitative MRI of the hippocampus and amygdala in severe depression. Psychol Med. 2000;30:117–125. doi: 10.1017/s0033291799001567. [DOI] [PubMed] [Google Scholar]
- Mohr DC, Goodkin DE, Likosky W, Gatto N, Baumann KA, Rudick RA. Treatment of depression improves adherence to interferon beta-1b therapy for multiple sclerosis. Arch Neurol. 1997;54:531–533. doi: 10.1001/archneur.1997.00550170015009. [DOI] [PubMed] [Google Scholar]
- Moller A, Wiedemann G, Rohde U, Backmund H, Sonntag A. Correlates of cognitive impairment and depressive mood disorder in multiple sclerosis. Acta Psychiatr Scand. 1994;89:117–121. doi: 10.1111/j.1600-0447.1994.tb01497.x. [DOI] [PubMed] [Google Scholar]
- Papadopoulos D, Dukes S, Patel R, Nicholas R, Vora A, Reynolds R. Substantial archaeocortical atrophy and neuronal loss in multiple sclerosis. Brain Pathol. 2009;19:238–253. doi: 10.1111/j.1750-3639.2008.00177.x. [DOI] [PMC free article] [PubMed] [Google Scholar]
- Pariante CM, Lightman SL. The HPA axis in major depression: classical theories and new developments. Trends Neurosci. 2008;31:464–468. doi: 10.1016/j.tins.2008.06.006. [DOI] [PubMed] [Google Scholar]
- Posener JA, Wang L, Price JL, Gado MH, Province MA, Miller MI, et al. High-dimensional mapping of the hippocampus in depression. Am J Psychiatry. 2003;160:83–89. doi: 10.1176/appi.ajp.160.1.83. [DOI] [PubMed] [Google Scholar]
- Prisciandaro JJ, Roberts JE. A comparison of the predictive abilities of dimensional and categorical models of unipolar depression in the National Comorbidity Survey. Psychol Med. 2009;39:1087–1096. doi: 10.1017/S0033291708004522. [DOI] [PubMed] [Google Scholar]
- Sapolsky RM. Glucocorticoids and hippocampal atrophy in neuropsychiatric disorders. Arch Gen Psychiatry. 2000;57:925–935. doi: 10.1001/archpsyc.57.10.925. [DOI] [PubMed] [Google Scholar]
- Sapolsky RM, Uno H, Rebert CS, Finch CE. Hippocampal damage associated with prolonged glucocorticoid exposure in primates. J Neurosci. 1990;10:2897–2902. doi: 10.1523/JNEUROSCI.10-09-02897.1990. [DOI] [PMC free article] [PubMed] [Google Scholar]
- Sheline YI, Gado MH, Kraemer HC. Untreated depression and hippocampal volume loss. Am J Psychiatry. 2003;160:1516–1518. doi: 10.1176/appi.ajp.160.8.1516. [DOI] [PubMed] [Google Scholar]
- Sicotte NL, Kern KC, Giesser BS, Arshanapalli A, Schultz A, Montag M, et al. Regional hippocampal atrophy in multiple sclerosis. Brain. 2008;131:1134–1141. doi: 10.1093/brain/awn030. [DOI] [PubMed] [Google Scholar]
- Siegert RJ, Abernethy DA. Depression in multiple sclerosis: a review. J Neurol Neurosurg Psychiatry. 2005;76:469–475. doi: 10.1136/jnnp.2004.054635. [DOI] [PMC free article] [PubMed] [Google Scholar]
- Smith SM, Jenkinson M, Woolrich MW, Beckmann CF, Behrens TE, Johansen-Berg H, et al. Advances in functional and structural MR image analysis and implementation as FSL. Neuroimage. 2004;23 Suppl 1:S208–S219. doi: 10.1016/j.neuroimage.2004.07.051. [DOI] [PubMed] [Google Scholar]
- Smith SM, Zhang Y, Jenkinson M, Chen J, Matthews PM, Federico A, De Stefano N. Accurate, robust, and automated longitudinal and cross-sectional brain change analysis. Neuroimage. 2002;17:479–489. doi: 10.1006/nimg.2002.1040. [DOI] [PubMed] [Google Scholar]
- Sullivan MJ, Weinshenker B, Mikail S, Bishop SR. Screening for major depression in the early stages of multiple sclerosis. Can J Neurol Sci. 1995a;22:228–231. doi: 10.1017/s0317167100039895. [DOI] [PubMed] [Google Scholar]
- Sullivan MJ, Weinshenker B, Mikail S, Edgley K. Depression before and after diagnosis of multiple sclerosis. Mult Scler. 1995b;1:104–108. doi: 10.1177/135245859500100208. [DOI] [PubMed] [Google Scholar]
- Vickrey BG, Hays RD, Harooni R, Myers LW, Ellison GW. A health-related quality of life measure for multiple sclerosis. Qual Life Res. 1995;4:187–206. doi: 10.1007/BF02260859. [DOI] [PubMed] [Google Scholar]
- Wang Q, Yu S, Simonyi A, Sun GY, Sun AY. Kainic acid-mediated excitotoxicity as a model for neurodegeneration. Mol Neurobiol. 2005;31:3–16. doi: 10.1385/MN:31:1-3:003. [DOI] [PubMed] [Google Scholar]
- Ysrraelit MC, Gaitan MI, Lopez AS, Correale J. Impaired hypothalamic-pituitary-adrenal axis activity in patients with multiple sclerosis. Neurology. 2008;71:1948–1954. doi: 10.1212/01.wnl.0000336918.32695.6b. [DOI] [PubMed] [Google Scholar]
- Zellini F, Niepel G, Tench CR, Constantinescu CS. Hypothalamic involvement assessed by T1 relaxation time in patients with relapsing-remitting multiple sclerosis. Mult Scler. 2009;15:1442–1449. doi: 10.1177/1352458509350306. [DOI] [PubMed] [Google Scholar]
- Ziehn MO, Avedisian AA, Tiwari-Woodruff S, Voskuhl RR. Hippocampal CA1 atrophy and synaptic loss during experimental autoimmune encephalomyelitis, EAE. Lab Invest. 2010 doi: 10.1038/labinvest.2010.6. Epub ahead of print. [DOI] [PMC free article] [PubMed] [Google Scholar]
- Zorzon M, de Masi R, Nasuelli D, Ukmar M, Mucelli RP, Cazzato G, et al. Depression and anxiety in multiple sclerosis. A clinical and MRI study in 95 subjects. J Neurol. 2001;248:416–421. doi: 10.1007/s004150170184. [DOI] [PubMed] [Google Scholar]
- Zorzon M, Zivadinov R, Nasuelli D, Ukmar M, Bratina A, Tommasi MA, et al. Depressive symptoms and MRI changes in multiple sclerosis. Eur J Neurol. 2002;9:491–496. doi: 10.1046/j.1468-1331.2002.00442.x. [DOI] [PubMed] [Google Scholar]
Associated Data
This section collects any data citations, data availability statements, or supplementary materials included in this article.