

Abstract
Torezolid phosphate (TR-701) is the phosphate monoester prodrug of the oxazolidinone TR-700 which demonstrates potent in vitro activity against Gram-positive bacteria, including methicillin-susceptible Staphylococcus aureus (MSSA) and methicillin-resistant S. aureus (MRSA). The pharmacodynamics of TR-701 or TR-700 (TR-701/700) against S. aureus is incompletely defined. Single-dose pharmacokinetic studies were conducted in mice for TR-701/700. Forty-eight-hour dose range and 24-hour dose fractionation studies were conducted in a neutropenic mouse thigh model of S. aureus infection using MRSA ATCC 33591 to identify the dose and schedule of administration of TR-701/700 that was linked with optimized antimicrobial effect. Additional dose range studies compared the efficacies of TR-701/700 and linezolid for one MSSA strain and one community-associated MRSA strain. In dose range studies, TR-701/700 was equally bactericidal against MSSA and MRSA. Mean doses of 37.6 and 66.9 mg/kg of body weight/day of TR-701/700 resulted in stasis and 1 log CFU/g decreases in bacterial densities, respectively, at 24 h, and mean doses of 35.3, 46.6, and 71.1 mg/kg/day resulted in stasis and 1 and 2 log CFU/g reductions, respectively, at 48 h. Linezolid administered at doses as high as 150 mg/kg/day did not achieve stasis at either time point. Dose fractionation studies demonstrated that the area under the concentration-time curve over 24 h in the steady state divided by the MIC (AUC/MIC ratio) was the pharmacodynamic index for TR-701/700 that was linked with efficacy. TR-701/700 was highly active against MSSA and MRSA, in vivo, and was substantially more efficacious than linezolid, although linezolid's top exposure has half the human exposure. Dose fractionation studies showed that AUC/MIC was the pharmacodynamic index linked with efficacy, indicating that once-daily dosing in humans is feasible.
INTRODUCTION
The prevalence of methicillin-resistant Staphylococcus aureus (MRSA) in the hospital has exploded over the last several years (6, 7). Furthermore, in 2004, community-associated MRSA represented 59% of all acute, purulent skin and soft tissue infections seen in 11 emergency rooms across the United States (11). Often, hospital-acquired MRSA strains are resistant to multiple antibiotics, including all beta-lactam antibiotics, trimethoprim-sulfamethoxazole, tetracycline, clindamycin, and the quinolones and aminoglycosides (3). Although community-associated MRSA strains tend to be more susceptible to non-beta-lactam antibiotics, 94% are resistant to erythromycin and 40% are resistant to fluoroquinolones (7). In some geographic locations, up to 79% of isolates are resistant to clindamycin (7). Vancomycin is considered the “drug of choice” for the treatment of MRSA. However, this drug is only slowly bactericidal. Also, strains of S. aureus with decreased susceptibilities to vancomycin have been reported (3).
Torezolid phosphate (TR-701, DA-7218) is a phosphate monoester prodrug of TR-700 (DA-7157), a new oxazolidinone antibiotic that has potent in vitro activity against Gram-positive bacteria, including methicillin-susceptible and methicillin-resistant S. aureus (MRSA). Oxazolidinones currently remain active against S. aureus strains that are resistant to other classes of antibiotics.
The in vivo pharmacodynamic profile of TR-701 or TR-700 (TR-701/700) against S. aureus is incompletely defined. In this study we conducted pharmacokinetic, dose range, and dose fractionation studies for TR-701/700 in a neutropenic mouse thigh model of MSSA and MRSA infections to define the pharmacodynamics of TR-701/700 against these important pathogens. Since linezolid is the only commercially available oxazolidinone in the United States, we also compared the in vivo activity of TR-701/700 with this antibiotic.
(Part of this work was presented at the joint 48th Interscience Conference on Antimicrobial Agents and Chemotherapy and the 46th Infectious Diseases Society of American Annual Meeting, Washington, DC [9a].)
MATERIALS AND METHODS
Bacterial strains.
S. aureus ATCC 29213 (an MSSA strain) and MRSA ATCC 33591 were obtained from the American Type Culture Collection (Manassas, VA). One community-associated MRSA isolate (strain 6-8548A) was kindly provided by Ronald Jones (JMI Laboratories, Liberty, IA). All isolates were stored at −80°C in 10% glycerol. For each experiment, a bacterial strain was cultured overnight on blood agar plates to confirm the purity and viability of the microbe. Then, a few colonies were taken from the overnight agar culture and grown in cation-adjusted Mueller-Hinton II broth (CA-MHB; BBL, Sparks, MD) to late-log-phase growth. The bacterial suspensions were diluted to the desired concentrations and used immediately. The bacterial densities in the suspensions were confirmed by quantitative cultures.
Antibiotics.
TR-701 (molecular weight [MW], 494.28) and TR-700 (MW, 370.17) were supplied by Trius Therapeutics (San Diego, CA). The structure of the phosphate monoester prodrug, TR-701, and its active molecule, TR-700, are shown in Fig. 1. For each experiment, TR-701 (lot 287/07-TR3) was dissolved in sterile water. TR-700 (lot 1040-69-2) was dissolved in dimethyl sulfoxide (DMSO) and then further diluted with medium to the desired concentrations. These drug solutions were used immediately. Linezolid (solution for injection; lot 06C20Z25) was purchased from the clinical pharmacy of CuraScriptsSD, Inc. (Lake Mary, FL). It was provided as a 2-mg/ml solution.
Fig. 1.
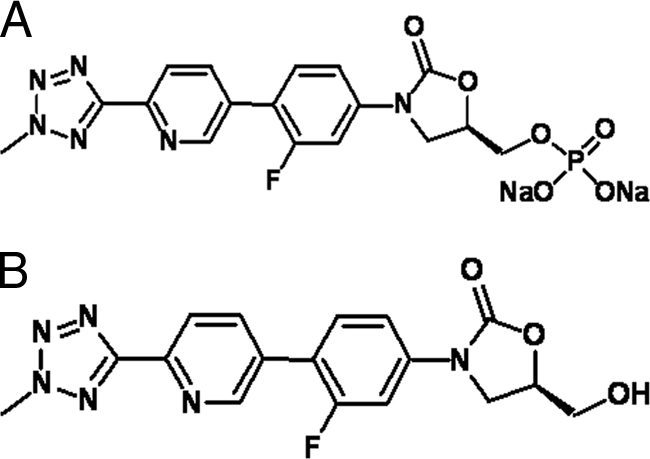
Structures of the phosphate monoester prodrug TR-701 (A) and the active molecule TR-700 (B).
Susceptibility studies.
The MICs of TR-701, TR-700 (the active antibiotic moiety of TR-701), and linezolid were determined for the MSSA and MRSA strains in CA-MHB using the broth macrodilution method specified by the CLSI (4). Subsequently, broth microdilution susceptibility studies were conducted to determine the effect of 80% complement-inactivated mouse and human sera on the activity of TR-700 and linezolid. The susceptibility studies were conducted at least twice for each bacterial strain.
Mice.
Female, outbred Swiss Webster mice (Taconic Farms, Taconic, NY), each weighing 22 to 25 g, were used. Transient neutropenia was induced by treating each mouse with 150 mg of cyclophosphamide (Sigma-Aldrich Inc., St. Louis, MO) per kg of body weight, via the intraperitoneal (IP) route, 4 days prior to bacterial inoculation and with 100 mg/kg of cyclophosphamide given IP 1 day prior to bacterial challenge. This regimen resulted in neutropenia in mice (neutrophil count of <100 cells/ml) for at least 5 days from the time the second dose of cyclophosphamide was administered (data not shown). All experimental methods using mice were approved by our Institutional Animal Care and Use Committee.
Single-dose pharmacokinetic studies for TR-701 and TR-700.
It should be noted that all doses of TR-701 are provided as dose equivalents (mg) of TR-700, even when referred to as TR-701. Neutropenic mice were infected in each posterior thigh muscle with 105 CFU of MRSA ATCC 33591. Two hours later, mice were given TR-701 in doses that would contain 10, 20, 40, or 80 mg/kg of the active component of TR-701, TR-700. This drug was administered as a single dose via the IP route. At 0.5, 1, 2, 3, 4, 6, 8, and 10 h after drug administration, 2 or 3 mice per group were sacrificed. The blood was collected and placed on ice in vials containing EDTA. The plasma was collected. Then 1 N HCl was added to the plasma to stabilize the TR-701 within the sample before the plasma was frozen at −80°C. The concentration of drug in plasma was measured by liquid chromatography-tandem mass spectroscopy (LC-MS-MS). All pharmacokinetic data were population modeled with the computer program the Non-Parametric Adaptive Grid (NPAG) (8) using a four-compartment model with first-order input (Fig. 2). Cohorts of animals at a specific dose and at a specific time point had their concentration data averaged for both TR-701 and TR-700. The variances were employed in an inverse-observed-variance weighting scheme to give the best approximation to the homoscedastic assumption. Simulations were conducted to determine the cumulative plasma area under the concentration-time curves (AUCs) generated in each of the dosing groups from the time of drug administration to 24 h using the ADAPT II package of software programs of D'Argenio and Schumitzky (5). The cumulative plasma AUC, peak concentration in serum (Cmax), and time above the MIC (T>MIC) were calculated for each dose examined.
Fig. 2.

Structural model for identification of pharmacokinetic parameters for TR701 and TR700. Ka is the first-order absorption rate constant. Khydrolysis is the first-order hydrolysis rate constant for TR701 to TR700. VTR701 and VTR700 are the apparent volumes of distribution of the central compartment (divided by F [bioavailability]). CLTR701 and CLTR700 (both divided by F) are the clearances of TR701 and TR700, respectively. K34 and K43 are first-order intercompartmental rate constants.
Single-dose pharmacokinetic studies of linezolid.
Linezolid at 10, 40, 100, and 150 mg/kg were administered IP as single doses to mice 2 h after they were infected in each posterior thigh with bacteria. Plasma was collected from sacrificed mice at 0.5,1, 2, 3, 4, 5, 6, 8, and 10 h after drug administration and were assayed for linezolid concentrations using a validated LC-MS-MS method.
All pharmacokinetic data were population modeled with the NPAG computer program (8). Multiple models were examined, including both Michaelis-Menten and parallel first-order plus Michaelis-Menten models and discriminated on the basis of log likelihood and the Akaike information criterion (1).
Cohorts of animals at a specific dose and at a specific time point had their concentration data averaged for linezolid. The variances were employed in an inverse-observed-variance weighting scheme to give the best approximation to the homoscedastic assumption. Simulations were conducted to determine the cumulative plasma area under the concentration-time curves (AUCs) generated in each of the dosing groups from the time of drug administration to 24 h using the ADAPT II package of software programs of D'Argenio and Schumitzky (5).
LC-MS-MS assays. (i) TR701/700.
Mouse plasma samples previously acidified with 1 M HCl (0.0250 ml per 0.100-ml plasma sample) were deproteinated with acetonitrile (0.500 ml). Two hundred fifty microliters of each supernatant were transferred into a conical centrifuge tube and taken to dryness under nitrogen at approximately 40°C. The samples were reconstituted with 0.500 ml of 70:30 water-methanol for TR701 analysis. The remaining solution was reconstituted with an additional 5.00 ml of 70:30 water-methanol for TR700 analysis. All samples were analyzed by high-pressure liquid chromatography-tandem mass spectrometry (HPLC-MS-MS) for TR700 and TR701 concentrations. The LC-MS-MS system was comprised of a Shimadzu Prominence HPLC system and an Applied Biosystems/MDS Sciex API5000 LC-MS-MS.
Chromatographic separation was performed using a Thermo Scientific Hypersil Gold C18 column (5 μm; 50- by 3.0-mm column) with a gradient using mobile phases of 20 mM ammonium formate (pH 8.0) and methanol at a flow rate of 0.5 ml/min.
TR700 and TR701 concentrations were obtained separately using LC-MS-MS monitoring the MS-MS transitions m/z 371 → m/z 343 for TR700 and m/z 451 → m/z 405 for TR701. Analysis run time was 6.5 min. The assay was linear over a range of 5.00 to 100 ng/ml (r2 > 0.993) for TR701 and a range of 0.100 to 20.0 μg/ml (r2 > 0.994) for TR700. The interday coefficient of variations (CVs) for the quality control (QC) samples, containing both TR700 and TR701, analyzed in two replicate samples at three concentrations on each analysis day ranged from to 4.59 to 7.42% for TR700 and 8.20 to 13.9% for TR701. Accuracies (percent recovery of the parameter [%REC]) for these same quality control samples ranged between 100% to 105% for TR700 and between 95.4 to 101% for TR701.
(ii) Linezolid.
Mouse serum samples, calibration standards, and QC samples (0.050 ml) were deproteinated with acetonitrile (0.150 ml). The samples were centrifuged, and an aliquot of the supernatant (0.050 ml) was transferred into an appropriately labeled autosampler vial containing 1.00 ml of 10 mM ammonium formate (pH 3.5). The samples were analyzed for linezolid concentrations by HPLC-MS-MS. The HPLC-MS-MS system was comprised of a Shimadzu Prominence HPLC system and an Applied Biosystems/MDS Sciex API5000 LC-MS-MS.
Chromatographic separation was performed using a Thermo Scientific Hypersil Gold C18 column (5 μm; 150- by 4.6-mm column) and an isocratic mobile phase consisting of 66% 10 mM ammonium acetate (pH 3.5) and 34% acetonitrile at a flow rate of 0.75 ml/min. Linezolid concentrations were obtained using LC-MS-MS monitoring the MS-MS transition m/z 338 → m/z 296. Analysis run time was 5.0 min. The assay was linear over a range of 0.010 to 20.0 μg/ml (r2 > 0.996). The interday CVs for the quality control samples analyzed in four replicate samples at three concentrations (0.100, 0.500, and 5.00 μg/ml) ranged from 6.87 to 9.30%, with all CVs and variances in accuracy ranging from 103 to 110%.
Dose range experiment for TR-701.
MRSA ATCC 33591, in mid-log-phase growth, was inoculated into the posterior thigh muscles of neutropenic mice at 105 CFU/thigh. The bacterial inoculum was confirmed by quantitative culture. Two mice were immediately sacrificed, and homogenates of the posterior thigh muscles were washed and then quantitatively cultured to determine the bacterial density in thigh muscles at baseline. Two hours later, tissue samples collected from three additional mice were similarly evaluated to confirm that the bacteria in the thigh muscles were in log-phase growth prior to initiation of therapy. The remaining infected mice were divided into nine groups, each consisting of 10 mice. The first group served as the untreated control arm. Seven of the nine groups were treated with 10 to 240 mg/kg/day of TR-701/700, respectively. The drugs were administered as divided doses twice daily (every 12 h [q12h]) for 2 days. These doses generated free-drug (non-protein-bound) 24-h AUCs in plasma of 6.41 to 153.61 mg·h/liter of TR-700, based on a plasma protein binding rate of 80%, as provided by the sponsor. For comparison, linezolid at 120 mg/kg/day was given for 2 days to the ninth group as two divided doses (60 mg/kg) every 12 h. The pharmacokinetic studies demonstrated that this dose of linezolid generated a free 24-h AUC (fAUC24) in mice of approximately 71.4 mg·h/liter, based on a serum protein binding rate of 30% in mouse plasma. This fAUC24 in mice approximated half the fAUC24 reported in humans who were treated with 600 mg of linezolid every 12 h (137 mg·h/liter) (9). At 24 and 48 h after initiation of treatment, 5 mice from each group were euthanized. Homogenates of the infected thigh tissues were washed twice with sterile saline to prevent drug carryover and were then quantitatively cultured onto blood agar plates. After 24 h of incubation at 35°C, the colonies were enumerated. An inhibitory sigmoid Emax dose-effect relationship was mathematically derived from the data generated at the 24- and 48-h treatment time points using Hill's equation:
where E is microbial effect, Econ is the microbial density in the control arm, Emax is the microbial density in the arm with maximal microbial kill, C is the drug exposure, EC50 is the exposure for which there is 50% of maximal kill, and H is the Hill constant. The exposures associated with stasis and 1 and 2 log CFU/g reductions in bacterial concentrations in infected thigh muscles were calculated. Comparisons were made with the single dose of linezolid that was studied.
Dose fractionation studies for TR-701/700.
Doses of TR-701/700 located on the steep portion of the inhibitory sigmoid Emax dose-response curve were identified from the dose range studies. In the dose fractionation studies, total 24-hour dosages of TR-701 of 0 to 100 mg/kg/day (24-h fAUCs of 0 to 65 mg·h/liter) were given to mice inoculated 2 h earlier with MRSA ATCC 33591 as either a single dose administered at 0 h, two equally divided doses given at 0 and 12 h, or four equally divided doses given at 0, 6, 12, and 18 h. The drug was administered in sterile water. A separate group of infected controls was given 0.2 ml of sterile water immediately after the mice were inoculated with bacteria (−2 h) and at the time of treatment initiation (0 h). Twenty-four hours after treatment was begun, the treated and nontreated mice were sacrificed for quantitative cultures of both posterior thigh muscles. Tissue homogenates were washed twice with saline to prevent drug carryover before the quantitative cultures were performed. Results for each total dose (given as 1, 2, or 4 divided doses) were examined by analysis of variance (ANOVA). The relationship between free AUC/MIC, T>MIC, and Cmax/MIC drug exposures and reductions in bacterial counts in infected thigh tissue were assessed by inhibitory sigmoid Emax analysis.
Expanded comparative dose range experiments for TR-701/700 and linezolid.
MSSA ATCC 29213 and a community-associated MRSA strain (strain 6-8548A) were investigated in the comparative dose range experiments. Neutropenic mice were inoculated in each posterior thigh muscle with 105 CFU of the MSSA or MRSA isolate. Two mice were sacrificed immediately and 2 h later for quantitative cultures of infected thigh muscles to confirm that the bacteria were in log-phase growth at the time that treatment was initiated. The remaining mice were divided into groups of 10. Dosages of 0 to 150 mg/kg/day of TR-701 or linezolid were administered for 2 days via the IP route. TR-701 was administered once daily, and linezolid was given once daily. These dosages generated fAUC24 in mice of 6.52 (10-mg/kg dose) to 97.8 mg·h/liter (150-mg/kg dose) for TR-701/700 and 5.95 to 89.3 mg·h/liter for linezolid. At 24 and 48 h of treatment, three mice per group were sacrificed, and the posterior thigh muscles were collected for quantitative cultures. Muscle homogenates were washed twice with sterile saline to prevent drug carryover before they were quantitatively cultured to determine the effect of each drug exposure on the killing of the MRSA isolates. An inhibitory sigmoid Emax dose-effect relationship was mathematically derived using the Hill equation shown above, and the exposures associated with stasis and 1 and 2 log CFU/g reductions in bacterial counts in infected thigh muscles were calculated. These expanded dose range experiments were conducted once for the MSSA and MRSA strains.
RESULTS
MICs of TR-700 and linezolid for the MSSA and MRSA strains and the effect of mouse and human sera on MIC values.
The MIC of TR-700 in CA-MHB was 0.5 mg/liter for the one MSSA strain and the 2 MRSA strains that were evaluated. The MIC of TR-700 for all of the strains increased to 1 mg/liter in 80% complement-inactivated mouse serum and to 2 mg/liter in 80% complement-inactivated human serum. The MIC of TR-701 for the three S. aureus strains was >256 mg/liter, demonstrating the lack of activity of this prodrug. The MIC for linezolid in CA-MHB was 2 mg/liter for the MSSA and MRSA strains tested. The MIC for linezolid increased to 4 mg/liter when susceptibility studies were conducted using 80% complement-inactivated mouse and human sera.
Pharmacokinetics of TR-700/TR-701 and linezolid.
The concentrations from plasma samples, collected over 10 h, for TR-700 and TR-701 and for linezolid were modeled using a population pharmacokinetic analysis approach employing the software program BigNPAG. The mean parameter values for the prodrug (TR-701) and the active component (TR-700) are shown in Table 1. The fit of the models to the data after the MAP-Bayesian step for TR-701/700 was good (r2 of 0.992 for TR-701 and r2 of 0.997 for TR-700). The observed-predicted plots for the concentrations of TR-701 and TR-700 in plasma are presented in Fig. 3. The terminal half-life for TR-700 in plasma was 5.24 h.
Table 1.
Mean parameter values for TR-700/701 (see Fig. 2)
| Antibiotic and parametera (units) | Mean | SD |
|---|---|---|
| TR701/700 | ||
| Ka (h−1) | 66.4 | 29.6 |
| Khydrolysis (h−1) | 1.48 | 1.10 |
| CL701/F (liter/h) | 0.0102 | 0.0219 |
| V701/F (liter) | 0.384 | 0.383 |
| CL700/F (liter/h) | 0.0101 | 0.0111 |
| V700/F (h−1) | 0.0164 | 0.0106 |
| K34 (h−1) | 12.7 | 7.13 |
| K43 (h−1) | 12.8 | 6.50 |
| Linezolid | ||
| Ka (h−1) | 7.73 | 9.07 |
| VL/F (liter) | 0.017 | 0.0049 |
| Kcp (h−1) | 5.95 | 7.12 |
| Kpc (h−1) | 13.57 | 0.0294 |
| CL/F (liter) | 2.42 | 0.009 |
For TR-701/700, V701 and V700, volume of the central compartment for TR-701 and TR-700, respectively; Ka, first-order absorption rate constant; Khydrolysis, first-order rate constant for hydrolysis of prodrug TR-701 to active TR-700; CL701 and CL700, drug clearance for TR-701 and TR-700, respectively; K34 and K43, first-order intercompartmental transfer rate constants for TR-700. For linezolid, Ka, first-order absorption rate constant; VL/F, volume of the central compartment; Kcp and Kpc, first-order intercompartmental transfer rate constants; CL/F, linezolid clearance.
Fig. 3.

Predicted-observed plots after the MAP-Bayesian step in NPAG for TR-701 (A) and TR-700 (B).
For linezolid, the best model was a two-compartment linear model. Michaelis-Menten and parallel first-order and Michaelis-Menten models were also evaluated (8). Mean parameter values and dispersions are displayed in Table 1. The predicted-observed relationship gave an r2 of 0.974; observed = 0.950 × predicted + 0.531; bias was −0.163 (mg/liter). The precision was 2.758 (mg/ml)2. The 120-mg/kg dose provided a free-drug area under the concentration-time curve from 0 to 24 h (AUC0–24) of 71.4 mg·h/liter. The latter regimen approximates half the fAUC24 reported in humans who were treated with 600 mg of linezolid every 12 h (137 mg·h/liter) (9, 10). The terminal plasma linezolid half-life in mice was 0.6 to 0.75 h.
Twenty-four and 48-h dose range study for TR-701/700 against MRSA ATCC 33591 in neutropenic mice.
The dose-response effects of TR-701/700 in a neutropenic mouse thigh infection model are shown in Fig. 4. At the start of therapy (hour zero), the bacterial densities in mouse thigh muscles were 5.66 ± 0.20 log CFU/g. At 24 h, the bacterial densities in mice in the control arm increased to 8.91 ± 0.06 log CFU/g of tissue, and at 48 h, the bacterial load in the control group was 8.78 ± 0.12 log CFU/g. Doses of ≥80 mg/kg/day of the active component of TR-701 (TR-700) resulted in a 1.5 log CFU/g decrease in bacterial load at the infection site between the 24- and 48-h time points. The 50% effective doses (ED50s) at the 24- and 48-hour time points were 25.2 and 31.7 mg/kg/day, respectively. These dosages generated 24-h fAUC/MIC exposures of approximately 32.3 and 40.6 mg·h/liter, respectively.
Fig. 4.

Dose range studies for TR-701 and for one dosage of linezolid against an MRSA strain. The dose range studies were performed for 24 and 48 hours. Dosages of TR-701 are expressed as milligrams of the active component, TR-700, per kg of body weight. TR-701 and linezolid were administered to mice twice daily. Error bars represent 1 standard deviation.
After 24 h of therapy, stasis effect and a 1 log CFU/g reduction in the bacterial concentration in thigh muscles were achieved with dosages of 38.5 and 82.6 mg/kg/day of TR-701/700, respectively. These dosages corresponded to fAUC/MIC ratio values for TR-700 of 49.3 and 105.9, respectively, based on a plasma protein binding rate of 80% for TR-700 (as provided by the sponsor). After 48 h of therapy, stasis effect was achieved with a dose of 33.6 mg/kg/day of TR-701/700, and a 1 log10 CFU/g reduction in bacterial load from the stasis value was observed with a dose of 44.4 mg/kg/day of this drug. These dosages corresponded to fAUC/MIC ratio values for TR-700 values of 43.1 and 56.9, respectively. In contrast, a dose of 120 mg/kg/day of linezolid did not achieve stasis (fAUC/MIC ratio of 35.7 based on a protein binding rate of 30% in mouse plasma) (12). Indeed, the bacterial burden in the linezolid-treated arm was more than 2 log CFU/g higher than the stasis value (Fig. 4). No improvement in microbiological effect was seen with linezolid therapy between the 24- and 48-h treatment time points. A fAUC/MIC ratio of 307.6 mg·h/liter of TR-701/700 was estimated to provide a 4.53 log CFU/g reduction in MRSA density in infected mouse thigh muscle at 24 h and a 5.92 log CFU/g reduction in bacterial load at this site at 48 h.
Dose fractionation studies for TR-701/700.
At the start of therapy, mice had 5.88 ± 0.06 log CFU/g of MRSA strain ATCC 33591 in infected thigh muscle. After 24 h, the microbe grew to 8.76 ± 0.17 log CFU/g in the control group. The values of the pharmacodynamic indices generated with the TR-701/700 regimens that were examined in the dose fractionation study are shown in Table 2. The free 24-h AUC/MIC (fAUC/MIC) ratios and free T>MIC (fT>MIC) values were calculated from the time that treatment was initiated (0 h) to the time that the animals were sacrificed (24 h). This explains the lower fAUC/MIC ratios and higher fT>MIC values generated with the more fractionated regimens. The differences in fAUC/MIC ratios were included in the regression analyses. The relationship between the TR-700 exposure, as measured by the pharmacodynamic indices fAUC/MIC ratio, fCmax/MIC ratio, fT>MIC, and microbiological effect are shown in Fig. 5 and Table 3. The fAUC/MIC ratio was the pharmacodynamic index that best correlated with treatment effect (r2 = 0.984) compared to the fCmax/MIC ratio (r2 = 0.757) and the fT>MIC (r2 = 0.624) (Fig. 5), as it explained considerably more of the variance. Analysis of the antimicrobial effects of the fractionation of each regimen at the 24-h time point by ANOVA also demonstrated that the AUC/MIC ratio was the pharmacodynamic index that best predicted treatment efficacy for TR-700 (Table 4), as has been demonstrated for linezolid (2, 10).
Table 2.
Calculated pharmacodynamic variables for 4 total daily dosages of TR-701 administered as one, two, or four equally divided doses over 24 h
| Total dosage (mg/kg/24 h) | Regimena | fCmax/MIC ratiob | fAUC/MIC ratioc | fT>MIC (%)d |
|---|---|---|---|---|
| 10 | 10 mg/kg q24h | 2.62 | 13.19 | 21 |
| 5 mg/kg q12h | 1.29 | 12.82 | 20 | |
| 2.5 mg/kg q6h | 0.64 | 12.26 | 0 | |
| 20 | 20 mg/kg q24h | 5.16 | 26.03 | 31 |
| 10 mg/kg q12h | 2.62 | 25.63 | 43 | |
| 5 mg/kg q6h | 1.29 | 24.51 | 50 | |
| 36 | 36 mg/kg q24h | 9.29 | 46.88 | 39 |
| 18 mg/kg q12h | 4.65 | 46.14 | 60 | |
| 9 mg/kg q6h | 2.32 | 44.12 | 87 | |
| 72 | 72 mg/kg q24h | 18.59 | 93.76 | 49 |
| 36 mg/kg q12h | 9.29 | 92.28 | 79 | |
| 18 mg/kg q6h | 4.65 | 88.24 | 100 |
The first dose was administered 2 h after infection. All doses of TR-701 are provided as dose equivalents (mg/kg/day) of TR-700. Doses were given every 24 h (q24h), every 12 h (q12h), or every 6 h (q6h).
fCmax/MIC ratio, maximum concentration of free drug in serum divided by the MIC. The MICs for the MRSA strain were 0.5 mg/liter in CA-MHB and 1 mg/liter in 80% mouse serum.
fAUC/MIC ratio, area under the concentration-time curve over 24 h for the free, unbound fraction of a drug divided by the MIC.
fT>MIC, calculated cumulative percentage of a 24-h period that the concentration of the free drug exceeded the MIC under steady-state pharmacokinetic conditions (expressed as a percentage of the dosing interval).
Fig. 5.

Dose fractionation study evaluating the relationship between the fCmax/MIC ratio (A), fAUC/MIC ratio (B), and fT>MIC for TR-701 for MRSA ATCC 33591 with bacterial density (log CFU/g) in mouse thigh muscle. The pharmacodynamic values generated for the regimens examined are shown in Table 2. Dosages of TR-701 are expressed as milligrams of the active component, TR-700, per kg of body weight. Error bars represent 1 standard deviation. Q 24 hours, every 24 hours.
Table 3.
Comparative effect of TR701/700 and linezolid based on mg/kg/day doses and fAUC/MIC exposures
| Organism, dose or parameter, antibiotic, and treatment time | ED50 dosea | Stasis effect | 1 log CFU/g reductionb | 2 log CFU/g reductionb |
|---|---|---|---|---|
| Community-acquired MRSAc | ||||
| Dose (mg/kg/day)a | ||||
| TR-701 | ||||
| 24 h | 28.3 | 36.2 | 58.0 | N/A |
| 48 h | 34.5 | 39.8 | 52.4 | 105.0 |
| Linezolid | ||||
| 24 h | 110.1 | N/A | N/A | N/A |
| 48 h | 125.3 | N/A | N/A | N/A |
| fAUC/MIC ratio | ||||
| TR-701 | ||||
| 24 h | 36.8 | 47.1 | 75.5 | N/A |
| 48 h | 44.9 | 51.8 | 68.2 | 136.7 |
| Linezolid | ||||
| 24 h | 32.8 | N/A | N/A | N/A |
| 48 h | 37.3 | N/A | N/A | N/A |
| MSSAd | ||||
| Dose (mg/kg/day) | ||||
| TR-701 | ||||
| 24 h | 28.9 | 37.7 | 66.9 | N/A |
| 48 h | 39.3 | 35.3 | 46.6 | 71.1 |
| Linezolid | ||||
| 24 h | 35.7 | N/A | N/A | N/A |
| 48 h | 64.1 | N/A | N/A | N/A |
| fAUC/MIC ratio | ||||
| TR-701 | ||||
| 24 h | 37.6 | 49.1 | 87.1 | N/A |
| 48 h | 51.2 | 46.0 | 60.7 | 92.6 |
| Linezolid | ||||
| 24 h | 10.6 | N/A | N/A | N/A |
| 48 h | 19.1 | N/A | N/A | N/A |
Table 4.
MRSA densities in thigh muscles of mice that were treated with various total doses of TR-701, administered as one, two, or four divided doses over 24 h
| Total dosage (mg/kg)a | MRSA density (log CFU/g ± SD) with the following no. of doses: |
P valued | ||
|---|---|---|---|---|
| 1 dose | 2 divided dosesb | 4 divided dosesc | ||
| 10 | 7.75 ± 1.23 | 7.86 ± 0.32 | 7.62 ± 0.52 | 0.76 |
| 20 | 7.07 ± 0.58 | 7.13 ± 0.30 | 6.97 ± 0.17 | 0.81 |
| 36 | 6.00 ± 0.75 | 6.19 ± 0.62 | 6.58 ± 0.70 | 0.43 |
| 72 | 4.94 ± 0.58 | 4.93 ± 0.49 | 4.76 ± 0.37 | 0.82 |
The concentration (mg/kg) of active component of TR-701 is shown.
One-half of the total dosage was administered at 0 h and then 12 h later.
One-fourth of the total dosage was administered at 0 h and then 6, 12, and 18 h later.
The P values were determined by analysis of variance. A P value of <0.05 was considered statistically significantly different.
Comparative dose range studies for TR-701 and linezolid in neutropenic mice infected with MSSA ATCC 29213 and MRSA 6-8548A.
Comparative dose range studies for TR-701/700 and linezolid were conducted for one MSSA strain and one community-associated MRSA strain (Fig. 6A and B and Table 3). From the 0- to 24-h time points, the MSSA strain in the control arm grew from 6.19 ± 0.06 to 9.18 ± 0.16 log CFU/g of thigh muscle. The MRSA strain in the control arm increased from 5.35 ± 0.18 to 8.94 ± 0.17 log CFU/g of thigh muscle between these time points.
Fig. 6.

Comparative 24- and 48-h dose range studies for TR-701 and linezolid against one community-associated MRSA strain (A) and one MSSA strain (B). Dosages of TR-701 are expressed as milligrams of the active component, TR-700, per kg of body weight. TR-701 and linezolid (Lin) were administered once daily. Error bars represent 1 standard deviation.
TR-701/700 was highly effective against both S. aureus strains. The antimicrobial effect of TR-701/700 dosages of >48 mg/kg/day increased from the 24-h time point to the 48-h time point for both isolates. At doses of TR-701/700 of 80 and 150 mg/kg/day, for example, the densities of the community-associated MRSA strain decreased by an additional 0.75 log CFU/g between the 24- and 48-h time points. For the MSSA isolate, the additional day of therapy decreased the bacterial count by an additional 1.5 log CFU/g between the 24- and 48-hour time points. With 24 h of therapy, the dosages of TR-701/700 evaluated resulted in as much as a 5 log CFU/g reduction in bacterial concentrations in mouse thigh muscles compared to no therapy (not stasis point). With 48 h of therapy, the dosages of TR-701/700 examined resulted in up to a 6 log CFU/g decrease in S. aureus densities in the infection site compared to untreated controls (Fig. 6B).
The doses of TR-701/700 that resulted in stasis effects and 1 and 2 log CFU/g reductions in bacterial densities in thigh tissues of neutropenic mice are shown in Fig. 6A and B. The dosages of TR-701/700 needed to achieve these endpoints were similar for the two S. aureus strains.
For linezolid, the regimen of 150 mg/kg once daily (fAUC of 89.3 mg·h/liter; fAUC/MIC ratio of 44.6) resulted in a 2 to 3 log CFU/g reduction in bacterial density in thigh tissue compared with no treatment. At best, this dose of linezolid resulted in bacterial densities in mouse thigh muscle that was approximately 1 log CFU/g higher than the stasis values (Fig. 6A and B).
For both S. aureus strains, the doses of linezolid that were examined resulted in smaller reductions in MSSA and MRSA densities in mouse thigh tissue than the same mg/kg/day doses of TR-701/700 (Fig. 6A and B). TR-701/700 at 80 mg/kg/day resulted in a 3 to 4.5 log CFU/g greater reduction in MRSA density in thigh muscle than the same dose of linezolid at both the 24- and 48-h time points. At both time points, TR-701/700 at 150-mg/kg/day dose resulted in a 3 log CFU/g greater decrease in pathogen load than the same dose of linezolid. To match fAUC/MIC ratios, 150 mg/kg of linezolid produced a fAUC/MIC ratio of 44.6 (Fig. 6A), while stasis was attained for a TR701/700 dose of 33.8 mg/kg, which generates a fAUC/MIC ratio of 44.0. The difference between the two regimens which are fAUC/MIC-matched is approximately 1.1 log10 CFU/g, favoring TR701/700.
The killing effect of linezolid did not increase much between the 24- and 48-h treatment time points for the MRSA strain (Fig. 6A).
Of note, for the MSSA strain, TR-701/700 at 30.6 mg/kg/day produced the same effect as 150 mg/kg/day of linezolid. For the community-associated MRSA (CAMRSA) isolate, 30.7 mg/kg of TR-701/700 produced the same antimicrobial effect as 150 mg/kg of linezolid. As noted above, the CAMRSA strain (Fig. 6A) had 1.1 log10 CFU/g greater effect than linezolid at a matching fAUC/MIC ratio. For the MSSA strain, stasis (5.7 log10 CFU/g) was achieved at a dose of 40.6 mg/kg of TR701/700, which is a fAUC/MIC ratio of 52.8. Linezolid at a 150-mg/kg dose produces a fAUC/MIC ratio of 44.6, which does not achieve stasis, but does lower the bacterial burden to 6.79 log10 CFU/g.
DISCUSSION
This study showed that the investigational oxazolidinone TR-701 had potent activity against one MSSA strain and two MRSA strains in a neutropenic mouse thigh infection model. The evaluations included linezolid as a control, administered in a single large dose or as a range of doses. In each case, TR701/700 outperformed the linezolid comparator, even at matched fAUC/MIC ratios.
In order to identify exposures linked to microbiological effects, it is important to investigate the pharmacokinetics of the drug in the infected animal model to be used for pharmacodynamic investigation. Thus, we developed a highly sensitive and precise LC-MS-MS assay for TR701, TR700, and linezolid. As TR701 was given as a prodrug by intraperitoneal injection, a more complex pharmacokinetic model was required, reflecting the hydrolysis of TR701 to the active component, TR700 (Fig. 2). All data were analyzed simultaneously. The model fit the data quite well, as indexed to the observed-predicted plots shown in Fig. 3. The coefficient of determination (r2) was in excess of 0.99 for both TR-701 and TR-700. Measures of bias and precision were quite acceptable. Consequently, we were confident that accurate measures of TR701/700 exposures could be calculated. Linezolid data were best fit with a two-compartment linear model, and again, we were confident that accurate linezolid exposures could be calculated.
In the first dose range study using MRSA ATCC 33591, all doses were given on a 12-hour basis. The findings were clear-cut. At the 24-hour endpoint, TR701/700 outperformed linezolid. At the 120-mg/kg/day dose (the only one of linezolid examined in that experiment), 24 and 48 h of treatment with linezolid did not achieve stasis, while 24 h and 48 h of treatment with TR701/700 resulted in decreases in the bacterial concentration in thigh tissue to 1.02 and 2.34 log CFU/g, respectively, below stasis. When one examines the fAUC/MIC ratios for both drugs, 38.5 mg/kg of TR701/700, which produces a fAUC/MIC ratio of 49.7, achieves stasis (burden of 5.66 log10 CFU/g) at 24 h, while with 120 mg/kg (60 mg/kg q12h) of linezolid, which generates a fAUC/MIC ratio of 35.7, the bacterial burden at 24 h is 7.49 log10 CFU/g.
After the steep portion of the dose-response curve was identified, the dose fractionation study allowed identification of the dynamically linked variable. The outcome was made clear in Fig. 5. We calculated the free-drug peak/MIC ratio, free-drug AUC/MIC ratio, and free-drug T>MIC as a fraction of 24 h. The free-drug AUC/MIC ratio explained a considerably greater portion of the overall variance (r2 = 0.984) than the free-drug peak/MIC ratio (r2 = 0.757) or free-drug T>MIC (r2 = 0.624) did. Examining each of the panels of Fig. 5 demonstrates that there was essentially no bias in microbiological activity by the schedule of administration for free-drug AUC/MIC ratio (Fig. 5B), while for the free-drug peak/MIC ratio, the once-daily administration was biased to less activity and the every 6-hour administration was biased to more activity. Ironically, for free-drug T>MIC, the once-daily administration was biased to more activity. For a pharmacodynamic descriptor, one wishes to minimize overall variance and to decrease bias to the greatest extent. On the basis of these two factors, we can confidently say that free-drug AUC/MIC ratio was the pharmacodynamic driver for the microbiological effect for TR-701/700.
Because of the performance of TR-701/700 in the dose range study, we wanted to examine other isolates to determine whether the outcome was strain specific. To this end, we examined a community-associated MRSA strain and a methicillin-sensitive strain. These results are displayed in Fig. 6A and B. These experiments demonstrated that while only two isolates were examined and studies of more isolates are needed, the relative performance of both agents was recapitulated.
In the community-associated MRSA experiment (Fig. 6A), we see that for all doses exceeding 40 mg/kg, there was a multilog difference in microbiological activity in favor of TR-701/700. For linezolid, there was no difference seen in activity between the 24- and 48-hour endpoints, while doses of TR-701/700 of 80 mg/kg/day demonstrated an increase in kill of approximately one-half log CFU/g. It should be noted that linezolid never achieved stasis, while TR-701/700 achieved greater than a 1 log CFU/g kill at 24 h and greater than a 2 log CFU/g kill at 48 h. For the fAUC/MIC ratio, 33.8 mg/kg of TR701/700 achieved stasis at 24 h (AUC/MIC ratio of 44.0), while 150 mg/kg of linezolid produced a fAUC/MIC ratio of 44.6, with a bacterial burden of 6.84 log10 CFU/g, 1.18 log10 CFU/g above stasis.
For the MSSA strain (Fig. 6B), we again see that linezolid never achieves stasis, while TR-701/700 achieves greater than 1 log CFU/g kill at 24 h and greater than 2 log CFU/g kill at 48 h. As with the ATCC MRSA strain (Fig. 4), the 48-h endpoint demonstrated a considerable increase in killing at doses exceeding 40 mg/kg. When examining the fAUC/MIC ratio, TR701/700 achieves stasis at 40.6 mg/kg, which generates a fAUC/MIC ratio of 52.8. Linezolid at 150 mg/kg produces a fAUC/MIC ratio of 44.6, with a bacterial burden of 6.79 log10 CFU/g, over 1 log10 CFU/g above stasis. Overall, one must conclude that TR-701/700 demonstrated clear superiority in microbiological effect relative to linezolid, even when MIC, protein binding, and pharmacokinetics are accounted for and exposures were calculated in terms of free-drug AUC/MIC ratios.
This finding of superiority needs explanation. None of the standard pharmacodynamic factors explains it, as they have been examined and their variance accounted for. Currently, we hypothesize that TR-701/700 was better at allowing the immune system that remains after cyclophosphamide induction of neutropenia to kill the staphylococci. Indeed, we are in the midst of examining the effect of granulocytes on bacterial kill in this system and will also try to identify factors in the neutropenic setting that will explain the superiority of TR701/700. With regard to the effect of macrophages, Lemaire et al. (9) showed that TR-700 accumulates within macrophages at concentrations that were 5 to 10 times greater than linezolid and was also 5 to 10 times better at intracellular staphylococcal killing relative to linezolid. It may be that these issues of penetration and killing may also make TR-701/700 a drug for which relapse from intracellular sites is much reduced relative to other antistaphylococcal therapies. Much more work needs to be done in this area.
ACKNOWLEDGMENT
This project was sponsored by a grant provided by Trius Therapeutics, San Diego, CA.
Footnotes
Published ahead of print on 18 April 2011.
REFERENCES
- 1. Akaike H. A. 1973. A new look at the statistical model identification. IEEE 19:716–723 [Google Scholar]
- 2. Andes D., van Ogtrop M. L., Peng J., Craig W. A. 2002. In vivo pharmacodynamics of a new oxazolidinone (linezolid). Antimicrob. Agents Chemother. 46:3484–3489 [DOI] [PMC free article] [PubMed] [Google Scholar]
- 3. Bozdogan B., Esel D., Whitener C., Browne F. A., Appelbaum P. C. 2003. Antibacterial susceptibility of a vancomycin-resistant Staphylococcus aureus strain isolated at the Hershey Medical Center. J. Antimicrob. Chemother. 52:864–868 [DOI] [PubMed] [Google Scholar]
- 4. Clinical Laboratory Standards Institute 2006. Methods for dilution antimicrobial susceptibility tests for bacteria that grow aerobically; approved standards, 7th ed. CLSI publication M7-A7. Clinical and Laboratory Standards Institute, Wayne, PA [Google Scholar]
- 5. D'Argenio D. Z., Schumitzky A. 1997. ADAPT II. A program for simulation, identification, and optimal experimental design. User manual. Biomedical Simulations Resource, University of Southern California, Los Angeles, CA: http://bmsr.usc.edu/ [Google Scholar]
- 6. da Silva Coimbra M. V., et al. 2003. Clonal spread of methicillin-resistant Staphylococcus aureus in a large geographic area of the United States. J. Hosp. Infect. 53:103–110 [DOI] [PubMed] [Google Scholar]
- 7. Diekema D. J., et al. 2001. Survey of infections due to Staphylococcus species: frequency of occurrence and antimicrobial susceptibility of isolates collected in the United States, Canada, Latin America, Europe, and the Western Pacific region for the SENTRY Antimicrobial Surveillance Program, 1997–1999. SENTRY Participants Group. Clin. Infect. Dis. 32(Suppl. 2):S114–S132 [DOI] [PubMed] [Google Scholar]
- 8. Leary R., Jelliffe R., Schumitzky A., Van Guilder M. 2001. An adaptive grid non-parametric approach to pharmacokinetic and dynamic (PK/PD) models, p. 389–394 In Proceedings of the 14th IEEE Symposium on Computer-Based Medical Systems. IEEE Computer Society, Bethesda, MD [Google Scholar]
- 9. Lemaire S., Van Bambeke F., Appelbaum P. C., Tulkens P. M. 2009. Cellular pharmacokinetics and intracellular activity of torezolid (TR-700): studies with human macrophage (THP-1) and endothelial (HUVEC) cell lines. J. Antimicrob. Chemother. 64:1035–1043 [DOI] [PubMed] [Google Scholar]
- 9a. Louie A., Fregeau C., Liu W., Kulawy R., Drusano G. L. 2008. Pharmacodynamics of TR-701 in a mouse thigh infection model against Staphylococcus aureus ATCC 33591, a methicillin-resistant isolate, abstr. A-985, p. 23 Abstr. 48th Annu. Intersci. Conf. Antimicrob. Agents Chemother. (ICAAC)-Infect. Dis. Soc. Am. (IDSA) 46th Annu. Meet. American Society for Microbiology and Infectious Diseases Society of America, Washington, DC [Google Scholar]
- 10. MacGowan A. P. 2003. Pharmacokinetic and pharmacodynamic profile of linezolid in healthy volunteers and patients with Gram-positive infections. J. Antimicrob. Chemother. 51(Suppl. 2):ii17–ii25 [DOI] [PubMed] [Google Scholar]
- 11. Moran G. J., et al. 2006. Methicillin-resistant S. aureus infections among patients in the emergency department. EMERGEncy ID Net Study Group. N. Engl. J. Med. 355:666–674 [DOI] [PubMed] [Google Scholar]
- 12. Slatter J. G., et al. 2002. Pharmacokinetics, toxicokinetics, distribution, metabolism and excretion of linezolid in mouse, rat and dog. Xenobiotica 32:907–924 [DOI] [PubMed] [Google Scholar]