Abstract
Objectives:
This study was designed to assess the effectiveness of self-administered osteoporosis risk score sheet, body mass index (BMI), and bone mineral density (BMD) (ultrasound) in screening females with low bone mass, and how the results of the tools correlate with each other.
Materials and Methods:
The study was conducted on 536 postmenopausal women, who attended public awareness camps on Midlife Women Health held at the Menopause Research Unit, MGMCH, Sitapura, Jaipur. At these camps, in addition to several informational sessions on issues related to menopause, ultrasonic measurement of BMD was conducted on each participant. A broad questionnaire to identify midlife health problems was developed, and osteoporosis specific score sheet was designed to be self-administered. Patients were required to complete the osteoporosis specific risk score sheet and women health questionnaire (WHQ). BMI was determined. Statistical analysis was carried out to find the correlation between various variables. Sensitivity and specificity of the each risk score ascertained and cutoff risk score for identifying osteopenia was derived by comparing area under curve of each risk score on drawing receiver operational curve (ROC).
Results:
Sensitivity of risk score system was calculated to be 78.33% with 95% confidence interval being 73.24–82.86% and specificity was 27.12% with 95% confidence interval being 21.56–33.27%, keeping the cutoff point at nine. There was statistically significant inverse relationship between risk score and BMD values with Pearson correlation coefficient of (–) 0.22 and positive relationship between BMD and BMI with correlation coefficient of 0.192.
Conclusion:
By noting down the risk factors and BMI, we can screen out the women who require further evaluation and management, thus, it is an effective tool, particularly in developing countries like India, where most of the patients cannot afford expensive DEXA scans, although considered as the gold standard for BMD assessment. With the help of such scoring systems, health resources can be judiciously utilized.
Keywords: Bone mineral density, fracture, osteoporosis, postmenopausal, risk assessment tools
INTRODUCTION
Osteoporosis is mainly known as the disease of postmenopausal women. It is a skeletal disorder characterized by compromised bone strength, predisposing a person to an increased risk of fracture.[1] Bone strength (and, hence, fracture risk) is dependent on many qualities of bone, of which bone mineral density (BMD) is the most commonly measured.[1]
Osteoporosis has no warning signs. Often, the first indication of the disease is a fracture. Nearly all nonvertebral fractures are caused by a fall; however, vertebral fractures often occur without a fall, and need not necessarily be painful.[2]
According to WHO, the osteoporosis is characterized by low BMD and degeneration of the bone microarchitecture, which increases the bone brittleness and fracture risk. The disease is identified clinically by the occurrence of nontraumatic fractures, especially in the lumbar spine (vertebral fractures) and forearm, and by the occurrence of femoral fractures after fall from height. The greatest loss of bone mass occurs in women during perimenopause and is associated with estrogen insufficiency, a condition of menopause.[3]
Osteoporosis and its consequent increase in fracture risk is a major health concern for postmenopausal women and older men, and has the potential to reach epidemic proportions. On the basis of the 2001 census, approximately 163 million Indians are above the age of 50; this number is expected to increase to 230 million by 2015.[4] Even conservative estimates suggest that of these, 20% of women and about 10–15% of men would be osteoporotic. The total affected population would, therefore, be around 25 million. If the lower bone density is shown to confer a greater risk of fracture, as is expected, the figure can increase to 50 million.[5]
Osteoporotic fractures (fragility fractures, low-trauma fractures) are those occurring from a fall from a standing height or less, without major trauma such as a motor vehicle accident.[6] These fractures may result in limitation of ambulation, depression, loss of independence, and chronic pain.[7]
Many risk factors are associated with osteoporotic fractures including low peak bone mass, hormonal factors, the use of certain drugs (e.g., glucocorticoids), cigarette smoking, low physical activity, low intake of calcium and vitamin D, race, small body size, and a personal or a family history of fracture.[8]
Relatively little is known about risk factors in women from Indian subcontinent. Osteoporotic fractures usually occur 10–20 years earlier in Indian/Pakistani men and women as compared with western Caucasian counterparts. The Indian/Pakistani women have lower BMD than American, placing them at greater osteoporotic risk. The shorter hip axis of Indian/Pakistani versus American might also attenuate hip fracture risk in former group.[9]
Menstrual status is an important determinant of peak bone mass as well as the development of bone loss prior to onset of menopause. It has also been reported that the group of postmenopausal women has significantly lower bone mass than pre- and perimenopausal women.[10,11]
The risk factors have been classified as modifiable, nonmodifiable, drugs, and diseases causing secondary osteoporosis.[12–14]
Assessment of Fracture Risk
Predicting incident fractures is critical today, but in the light of the aging demographics, will have even greater importance in future. Early recognition and treatment of osteoporotic patients are crucial to the prevention of these fractures. In order for risk assessment to be effective and efficient, it must be practical and have high predictive value for the identification of fractures. Various tools have been developed for the prediction of fractures.[15–19]
Bone densitometry using dual energy X-ray absorptiometry (DEXA) is the “gold standard” for osteoporosis diagnosis. However, mass screening for osteoporosis has not been recommended, and no consensus has reached regarding specific targeted screening programs. The clinical risk assessment tools to predict risk of osteoporosis on the basis of risk factors in low resource setting are still lacking.
MATERIALS AND METHODS
The study was conducted on 536 postmenopausal women, who had attained menopause (natural or surgical) at least 1 year back. These patients were selected from the groups who attended public awareness camps on Midlife Women Health screening, held at the Menopause Clinic and Research Unit, MGMCH, Jaipur. At these camps, in addition to several informational sessions on issues related to menopause, a broad questionnaire to identify midlife health problems, WHQ was created. Cases were also required to complete an osteoporosis specific risk score sheet. Women health questionnaire [Figure 1] and osteoporosis risk score sheet [Figure 2] were designed to be self-administered and covered the risk factors and other information, with use of items from published validated instruments.
Figure 1.
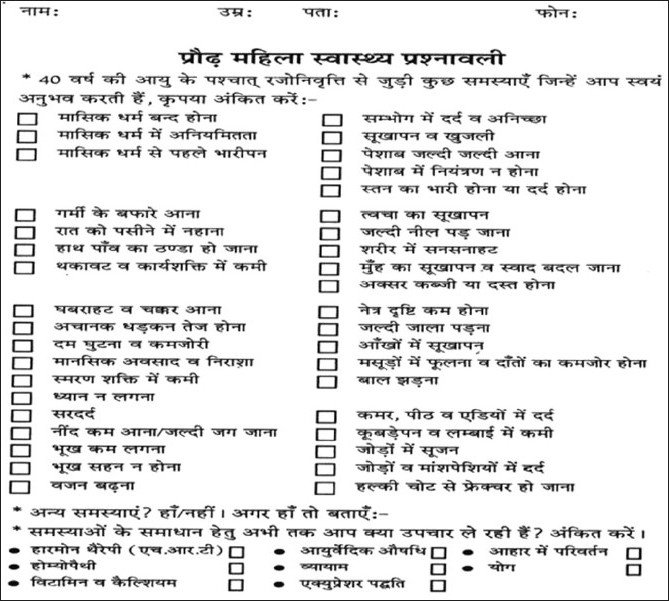
Women health questionnaire (original) in use
Figure 2.
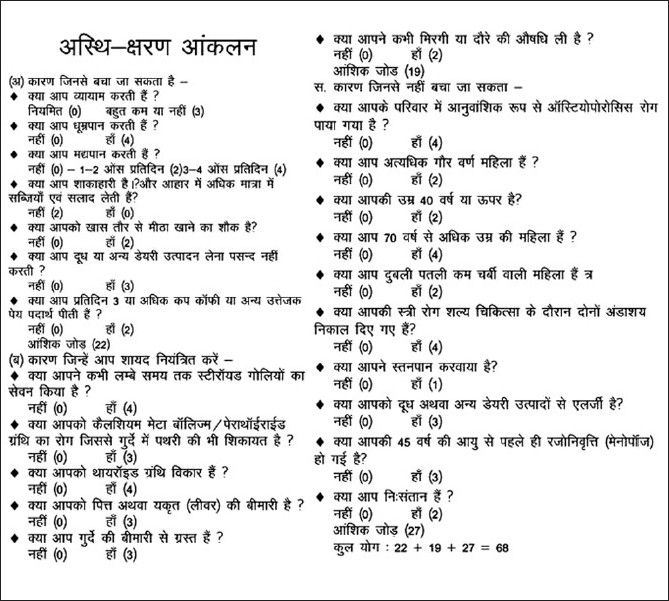
Osteoporosis specific risk score sheet (original) in use
Body Mass Index (BMI) was determined and ultrasonic measurement of BMD was conducted on each participant. For the purpose of this study, age, musculo-skeletal problems, osteoporosis specific risk score and BMI were selected as variables. Statistical analysis done to find the correlation between various variables. Risk scores were compared with BMD and correlation coefficients were calculated. Sensitivity and specificity of the each risk scores ascertained, and cutoff risk score for identifying osteopenia was derived by comparing area under curve of each risk score on drawing receiver operational curve (ROC).
Method for BMD
BMD was measured using Achilles Express quantitative ultrasound and expressed as T-score as defined by WHO. The patients were classified on the basis of BMD as normal, osteopenic and osteoporotic according to their T-score. In 1994, the World Health Organization (WHO) established a classification of BMD according to the standard deviation (SD) difference between a patient's BMD and that of a young-adult reference population. This value is now commonly expressed as “T-score.” A T-score that is equal to or less than –2.5 is consistent with a diagnosis of osteoporosis; a T-score between –1.0 and –2.5 is classified as low bone mass (osteopenia); and a T-score of –1.0 or higher is normal.[20]
RESULTS
A total of 536 postmenopausal women were included in the study. All of them filled their questionnaires by themselves or with the help of nursing staff. Detailed analysis of data was carried out. On symptomatological analysis, the chief complaint was vasomotor instability in 72%. Among this symptom group, the main complaint was hot flushes in 52%, night sweats in 10%, and sleep disturbances in 21%. The next major group was urogenital problems in 62% women. In this group, the main problems were vulvo vaginal itching, dryness, bleeding, watery discharge, and increased frequency of micturition. Next group was musculoskeletal problems, which were present in 64% patients mainly in the form of backache (54%) and joint and muscle pain (61%). It was important to note that 40% subjects with low BMD had no musculoskeletal symptoms [Figure 3], 46% had skin and soft tissue problems, 38% had breast problems, 40% had psychological disturbances and 42% had sexual problems.
Figure 3.
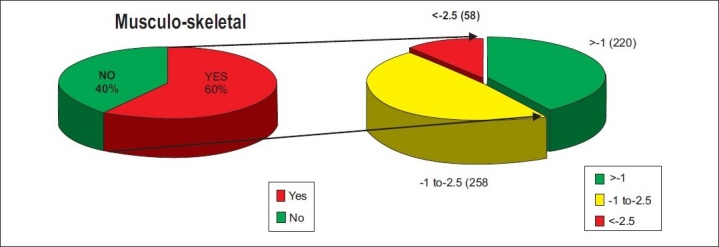
Relationship of musculoskeletal problems and BMD scores in study population
The agewise distribution of the sample is presented in Figure 4. Detailed analysis of all the variables, Age, BMI, BMD, risk scores is shown in Table 1.
Figure 4.
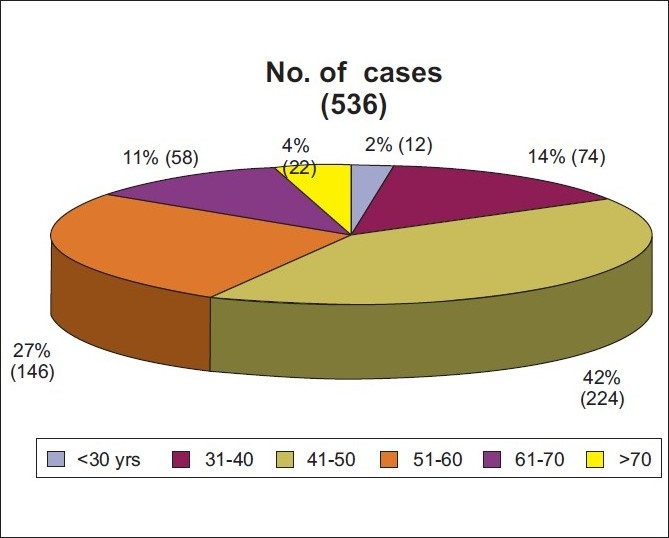
Distribution of cases according to age
Table 1.
Analysis of variables (age, BMD, BMI, and risk scores)

The mean age of osteopenic women was 49.83 years, while the mean age of osteoporotic women was 56.37 years. The correlation of age was not statistically significant; when correlated with risk scores, Pearson correlation was –0.10. P value was 0.818 [Scatterplot 1].
Scatterplot 1.
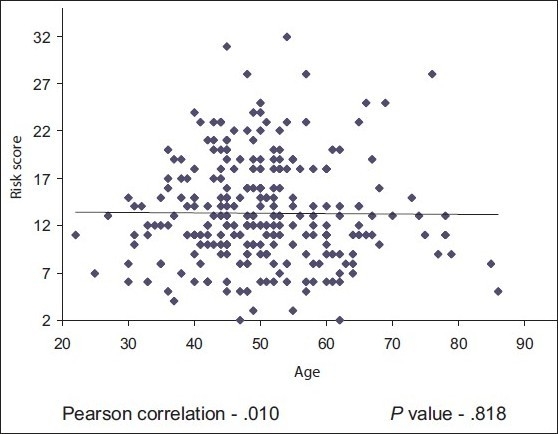
Correlation of risk score with age
The risk scores were categorized in three categories namely, Low risk of fracture (1-9), moderate risk of Fracture (10-16) and high risk of fracture (risk score 17 and above) and analyzed with all the variables [Table 2]. The patients were categorized according to WHO classification for BMD, and their other parameters were studied [Table 3]. The incidence of osteoporosis (BMD < –2.5) was 10.82% (58).
Table 2.
Profile of cases according to risk score divided into three groups

Table 3.
Profile of cases according to BMD

There was statistically significant direct relationship between BMD and BMI with Pearson correlation +0.192, which indicates when BMI increases BMD also increases [Scatterplot 2]
Scatterplot 2.
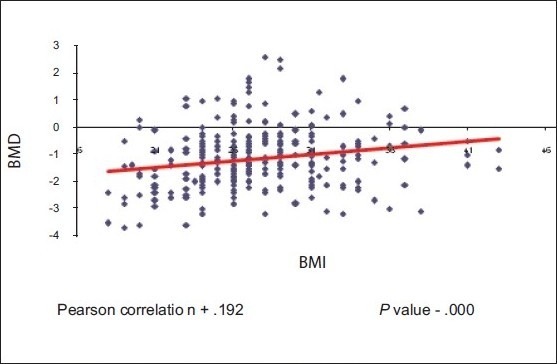
Correlation of BMD with BMI
There was statistically significant inverse correlation between risk scores and BMD with Pearson correlation value –0.22 with P value 0.000, which indicates that, as the risk scores increase BMD decreases [Scatterplot 3]
Scatterplot 3.
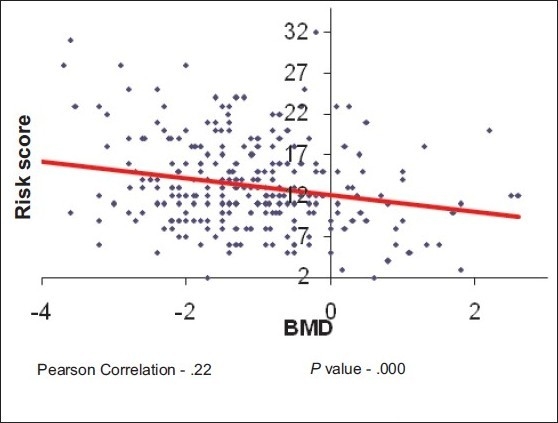
Correlation of risk score with BMD
The sensitivity of the risk score system was calculated to be 78.33% with 95% confidence interval between 73.24% and 82.86%. Specificity was 27.12% with 95% confidence interval between 21.56% and 33.27%. The cutoff risk score value for these observations was 9. Therefore, it was evident that the postmenopausal women having risk score of more than nine were at a greater risk of having osteopenia and further risk of osteoporotic fractures, so they should be subjected to DEXA and to be managed accordingly.
DISCUSSION
There are various tools available for fracture risk assessment in postmenopausal women, still many women who have or are prone to osteoporosis are not being identified or receiving intervention. BMD has traditionally been used for the diagnosis of osteoporosis and as a measure of fracture risk. North American Menopause Society (NAMS) recommends measuring the total hip, femoral neck, and posterior–anterior lumbar spine, using the lowest of the three BMD scores for diagnosis.[21] However, relying only on BMD, to identify those at-risk, neglects a considerable proportion of women in need of therapy. We used the quantitative ultrasound which gives results with the precision error of 1–5% (compared to 1% for DEXA) to screen as many women as possible.
Since, Improved strategies for fracture risk assessment are still needed, therefore, we developed this scoring system and translated it into Hindi, to make it easily understandable by local patients.
A risk assessment tool from a good quality study, assigned points to selected risk factors for low femoral neck bone density (age, weight, race, estrogen use, presence of rheumatoid arthritis, and history of fractures) and created a summary measure referred to as the simple calculated osteoporosis risk estimation (SCORE).[17] These risk factors were obtained from over 1200 women from the community and were subsequently tested in a validation group (n = 259). SCORE had an area under the ROC curve of 0.81 in the development group, and a sensitivity of 91% and a specificity of 40% in the validation group, while we included more risk factors to screen other high-risk variables also. The fracture index by Black et al[15] was designed to be used as a tool not only for physicians but also for patients. This is a self-administered questionnaire, and women assess their risk for fracture and use the results to facilitate a discussion with their physician. This instrument takes into account the major established risk factors, which include age, personal history of fracture, maternal history of hip fracture, weight, smoking status, and mobility. The maximum possible score is 11 without BMD information and 15 with BMD information, and the investigators recommend that postmenopausal women with a total score of 4 or greater without BMD assessment or 6 or greater with BMD assessment should undergo further evaluation by their physician. Further evaluation may include a thorough physical examination, medical history and radiographs to ensure no prior fractures. In addition, a comprehensive chemistry profile, tests for thyroid function, serum or urinary calcium level, vitamin D level, and bone turnover markers may help determine or rule out any secondary causes of osteoporosis or underlying metabolic diseases that may affect bone health. However, this scoring system was designed for risk assessment in order, postmenopausal white women and may not be applicable to other population groups. In our risk scoring system, we included as many risk factors as were of importance in Indian scenario. The other osteoporosis risk assessment tool by Cadarette et al.,[16] namely Osteoporosis Risk Assessment Instrument (ORAI) had sensitivity of 93.3% with 95% confidence interval 86.3–97.0% and specificity of 46.4% with 95% confidence interval 41.0–51.8%.
WHO's FRAX risk factors (personal history of fracture after age 40, history of hip fracture in a parent, cigarette smoking, excess alcohol consumption, glucocorticoid use, RA, or other secondary causes of osteoporosis) must be accurately collected, often with the aid of a simple questionnaire. Risk factors may help identifying contributry causes of osteoporosis and are essential in the determination of FRAX.[22] This tool however is not having the Indian version. The research work is still continue and Global Longitudinal Study of osteoporosis in Women (GLOW) would provide insights into the management of fracture risk in older women over 55 years, patient experience with prevention and treatment, and distribution of risk among older women, on an international basis,[23] but its usefulness in Indian context is still to be calculated. We designed this model capable of predicting BMD better in Indian scenario than most models previously developed.
CONCLUSION
Majority of the population remains undiagnosed and unaware of the importance of early recognition and preventive treatment of osteoporosis. Simple tools are effective in selecting the cases for BMD measurement and expensive specialized investigations, reducing modifiable risk factors and considering early treatment particularly in developing countries like India.
In conclusion, this approach provides a practical tool with which fracture risk may be assessed in individual patients in clinical practice. In some individuals, for example, those with a history of previous fragility fractures or elderly individuals on high doses of glucocorticoids, fracture probability based on these risk factors alone will be sufficiently high to exceed the cost-effective intervention threshold and BMD measurements will not be required. In others, the absence of any risk factors will indicate a risk that is sufficiently low to exclude the need for BMD assessment. In the remainder of individuals, BMD measurements may be used in combination with clinical risk factors to determine whether fracture probability attains or exceeds the intervention threshold.
The model thus improves the prediction of fracture risk in clinical practice, enabling more accurate targeting of treatment and resulting in greater cost-effectiveness in the prevention of osteoporotic fractures. The key for prevention of osteoporosis lies in creating and using specifically designed tools for early detection and subsequently managing the underlying cause with an individualized approach.
Acknowledgments
We acknowledge the management and staff of Mahatma Gandhi Medical College and Hospital for their assistance.
Footnotes
Source of Support: Nil
Conflict of Interest: None declared.
REFERENCES
- 1.Osteoporosis prevention, diagnosis, and therapy. NIH Consensus Development Panel on Osteoporosis Prevention, Diagnosis, and Therapy. JAMA. 2001;85:785–95. doi: 10.1001/jama.285.6.785. [DOI] [PubMed] [Google Scholar]
- 2.Eastell R. Forearm fracture. Bone. 1996;18:S203–7. doi: 10.1016/8756-3282(95)00503-x. [DOI] [PubMed] [Google Scholar]
- 3.Prevention and management of osteoporosis. Geneva: World Health Organization; 2003. World Health Organization Scientific Group on the Prevention and Management of Osteoporosis. (Technical Report Series, 921) [Google Scholar]
- 4.Nordin BE. International patterns of osteoporosis. Clin Orthop. 1966;45:17–30. [PubMed] [Google Scholar]
- 5.Gupta AK, Samuel KC, Kurian PM, Rallan RC. Preliminary study of the incidence and aetiology of femoral neck fracture in Indians. Indian J Med Res. 1967;55:1341–8. [PubMed] [Google Scholar]
- 6.Johnell O, Kanis JA. An estimate of the worldwide prevalence and disability associated with osteoporotic fractures. Osteoporosis Int. 2006;17:1726–33. doi: 10.1007/s00198-006-0172-4. [DOI] [PubMed] [Google Scholar]
- 7.Poole KE, Compston JE. Osteoporosis and its management. Br Med J. 2006;333:1251–6. doi: 10.1136/bmj.39050.597350.47. [DOI] [PMC free article] [PubMed] [Google Scholar]
- 8.Grazio S. Epidemiology of osteoporosis. Rhumatism. 2006;53:18–31. [PubMed] [Google Scholar]
- 9.Alekel DL, Mortillaro E, Hussain EA. Lifestyle and biologic contributors to proximal femur bone mineral density and hip axis length in two distinct ethnic groups of premenopausal women. Osteoporos Int. 1999;9:327–38. doi: 10.1007/s001980050155. [DOI] [PubMed] [Google Scholar]
- 10.Khan AA, Syed Z. Bone densitometry in premenopausal women, synthesis and review. J Clin Densitom. 2004;7:85–92. doi: 10.1385/jcd:7:1:85. [DOI] [PubMed] [Google Scholar]
- 11.Usmani SZ, Shahid Z. An overview of postmenopausal osteoporosis. Pak J Med Sci. 2004;20:270–5. [Google Scholar]
- 12.Physician's Guide to Prevention and Treatment of Osteoporosis. Belle Mead, NJ: Excerpta Medica, Inc; 1998. National Osteoporosis Foundation. [Google Scholar]
- 13.Beers MH, Berkow R, editors. 17th ed. White house station, NJ: Merck Research Laboratories; 1943,1999. The Merck Manual of Diagnosis and Therapy; pp. 470–1. [Google Scholar]
- 14.Gums JG. New Methods of Diagnosis and Treatment of Osteoporosis. US Pharm. 1996;9:85–93. [Google Scholar]
- 15.Black DM, Steinbuch M, Palermo L, Dargent-Molina P, Lindsay R, Hoseyni MS, et al. An Assessment Tool for Predicting Fracture Risk in Postmenopausal Women. Osteoporos Int. 2001;12:519–28. doi: 10.1007/s001980170072. [DOI] [PubMed] [Google Scholar]
- 16.Cadarette SM, Jaglal SB, Kreiger N, McIsaac WJ, Darlington GA, Tu JV. Development and validation of the Osteoporosis Risk Assessment Instrument to facilitate selection of women for bone densitometry. CMAJ. 2000;162:1289–94. [PMC free article] [PubMed] [Google Scholar]
- 17.Lydick E, Cook K, Turpin J, Melton M, Stine R, Byrnes C. Development and validation of a simple questionnaire to facilitate identification of women likely to have low bone density. Am J Managed Care. 1998;4:37–48. [PubMed] [Google Scholar]
- 18.Robbins J, Aragaki AK, Kooperberg C, Watts N, Wactawski Wende J, Jackson RD, et al. Factors associated with 5 – Year risk of hip fracture in postmenopausal women. JAMA. 2007;298:2389–98. doi: 10.1001/jama.298.20.2389. [DOI] [PubMed] [Google Scholar]
- 19.Kanis JA, Johnell O, Oden A, Johansson H, McCloskey E. FRAX and the assessment of fracture probability in men and women from the UK. Osteoporosis Int. 2008;19:385–97. doi: 10.1007/s00198-007-0543-5. [DOI] [PMC free article] [PubMed] [Google Scholar]
- 20.Geneva: World Health Organization; 1994. WHO Study Group on Assessment of Fracture Risk and its Application to Screening for Postmenopausal Osteoporosis. [PubMed] [Google Scholar]
- 21.Management of osteoporosis in postmenopausal women: 2010 position statement of the North American Menopause Society. Menopause. 2010;17:23–54. doi: 10.1097/gme.0b013e3181c617e6. [DOI] [PubMed] [Google Scholar]
- 22.World Health Organization Collaborating Centre for Metabolic Bone Diseases, University of Sheffield, UK FRAX: WHO Fracture Risk Assessment Tool. [Last accessed on 2009 Dec]. Available from: www.shef.ac.uk/frax .
- 23.Hooven FH, Adachi JD, Adami S, Boonen S, Compston J, Cooper C, et al. the Global Longitudinal Study of osteoporosis in Women rationale and study design. Osteoporosis int. 2009;20:1107–16. doi: 10.1007/s00198-009-0958-2. [DOI] [PMC free article] [PubMed] [Google Scholar]


