Abstract
Various pre-erythrocyte malaria vaccines are currently in clinical development, and among these is the adenovirus serotype 35-based circumsporozoite (CS) vaccine produced on PER.C6 cells. Although the immunological correlate of protection against malaria remains to be established, the CS antibody titer is a good marker for evaluation of candidate vaccines. Here we describe the validation of an anti-Plasmodium falciparum circumsporozoite antibody enzyme-linked immunosorbent assay (ELISA) based on the binding of antibodies to a peptide antigen mimicking the CS repeat region. The interassay variability was determined to be below a coefficient of variation (CV) of 15%, and sensitivity was sufficient to detect low antibody titers in subjects from endemic regions. Antibody titers were in agreement with total antibody responses to the whole CS protein. Due to its simplicity and high performance, the ELISA is an easy and rapid method for assessment of pre-erythrocyte malaria vaccines based on CS.
INTRODUCTION
Malaria remains the most lethal infectious disease, killing nearly 1 million people each year. The development of a protective vaccine against malaria is considered a high priority in order to prevent the disease (WHO, http://www.who.int/mediacenter/news/notes/2006/np35/en/print.html; Malaria Vaccine Initiative, http://www.malariavaccineroadmap.net/pdfs/vision_document.pdf). Although the feasibility of a malaria vaccine using irradiated sporozoites was demonstrated more than 30 years ago (3), an effective malaria vaccine has not been generated as yet. The protective effect of irradiated sporozoites is likely due to a protective antibody response. Immunological studies over the following decades, however, have indicated that both antibodies and T cells are required for protection against infection with malaria parasites.
Adenoviral vectors have been proven highly efficient in inducing both cellular and humoral immune responses in various disease models (1, 16, 20). Therefore, recombinant adenoviral vectors are considered to be a potential vaccine to prevent malaria disease. We have developed such a candidate malaria vaccine based on adenovirus serotype 35 (Ad35) expressing a Plasmodium falciparum circumsporozoite (CS) transgene (Ad35.CS) which is produced on PER.C6 cells. This vaccine induced strong immune responses in mice (17) and rhesus macaques (14, 18). Although heterologous prime-boost vaccine strategies are likely required to prevent P. falciparum infection (12), Ad35 is proposed to be an important component of such a combination. Following the successful preclinical investigations on Ad35.CS, a clinical phase I trial has started in the United States. The primary objective of this phase I study is to show safety and tolerability, and the secondary objective is to explore the immunogenicity of the vaccine by measuring T cell responses and antibody responses.
In this report we describe the development and validation of an antibody enzyme-linked immunosorbent assay (ELISA) that determines the antibody titer in human serum against CS induced by the vaccine, in order to support the secondary objective. Although the correlates of protection against malaria are not determined yet, the antibody assay described here is required to provide an accurate indication of the humoral immunogenicity of the vaccine. Therefore, we selected the immunodominant epitope in the CS antigen as the target for the antibody assay in order to detect the majority of human responses induced by the vaccine. Since the repeat region of CS is the immunodominant region for B cell epitopes (22–24) and antibodies against the NANP3 epitope in the repeat region reflect exposure to natural P. falciparum infection (25), it is assumed that the antibodies directed to this region correlate with the total amount of anti-CS antibodies. The (NANP)6C peptide, as described by Stoute et al. (19), is the optimal representation of the repeat region and was selected to be capture antigen in our assay. In general, an antibody ELISA would be based on the complete antigen of interest. The CS protein, however, is not readily available to the scientific community, and recombinant CS proteins from different sources may hamper the comparability of results between different laboratories. Using a synthetic peptide as target antigen could facilitate comparability between laboratories, since the antigen quality is much easier to guarantee for a peptide than for a recombinant protein. Here we describe the development of the CS antibody ELISA to determine the humoral immunogenicity of Ad35.CS in human subjects and its validation as a robust and reproducible assay to support clinical vaccine development.
MATERIALS AND METHODS
CS antibody ELISA protocol.
The peptide (NANP)6C, comprising 6 repeats of NANP, mimics a part of the repeat sequence of P. falciparum CS (4, 19), and this peptide was used as capture antigen to bind CS-specific antibodies. The peptide was obtained from Pepscan (Lelystad, Netherlands) at a purity of 90%. The peptide was coated at a concentration of 2 μg/ml in 0.05 M carbonate buffer at 2 to 8°C overnight or for a maximum of 3 days. Reference serum, serum samples, and internal controls were diluted in phosphate-buffered saline (PBS)–2% gelatin–1% human serum (dilution buffer) and incubated for 1 h at room temperature. Goat anti-human IgG horseradish peroxidase [HRP; catalog no. GAHu/IgG (H+L)/PO; Nordic Immunological Laboratories, Netherlands) was added and incubated for 1 h at room temperature. Finally, o-phenylenediamine (OPD; Sigma Aldrich) was added for the colorimetric reaction, which was stopped after 10 min using 5.3% H2SO4 stop solution. Subsequently, the optical density (OD) was measured at 492 nm, using a Bio-Tek microplate spectrophotometer type PowerWave 340.
Reference, control, and test sera.
Human serum samples from individuals vaccinated with RTS,S vaccine (7) (samples pos031118, IR2, IR2-20#060601, and 7-4/24-2/8-2/4-4-2) were kindly provided by Ann Stewart (Department of Immunology, WRAIR, Silver Spring, MD). Serum sample IR2 was used as the reference standard at 7 2-fold dilutions from 1/200 to 1/12,800.
Serum samples from individuals in regions of Africa where malaria is endemic (n = 19) were kindly provided by Adrian J. F. Luty (Department of Medical Parasitology, Radboud University Nijmegen Medical Research Center, Nijmegen, Netherlands). The African subjects were healthy adults aged >18 years and were lifelong residents of Gabon, an area that has perennial transmission of Plasmodium falciparum.
An additional human serum batch containing M31-70 CS antibody derived from an individual vaccinated with a virosome adjuvanted malaria vaccine was kindly provided by Rinaldo Zurbriggen (Pevion Biotech Ltd., Bern, Switzerland).
A normal human serum pool and 20 individual normal human serum samples were obtained from Harlan Sera-lab, Nr Loughborough, United Kingdom, and were used as negative controls. All serum samples were heat inactivated for 30 min at 56°C.
Validation.
Validation was performed according to the validation protocol with preset acceptance criteria. This immunogenicity assay was validated for specificity, sensitivity, precision, linearity, and range, as indicated by the guidelines from the International Conference on Harmonisation (ICH) and the U.S. Food and Drug Administration (FDA) (5, 8). The acceptance criteria were derived from the interpretation of Viswanathan et al. (21) for ligand binding assays. These included maximum coefficients of variation (CVs) of 20% for precision and accuracy and 25% for samples at the lower limit of quantitation (LLOQ) and a CV of 30% for total error (bias plus precision).
Validation experiments were performed using six quality control (QC) samples spanning the required range of the assay. For this, CS-positive serum sample M31-70 was diluted in negative serum to obtain large batches of sera positive for CS at different concentrations. These were aliquoted and stored at −80°C, until they were retrieved for experimentation. The nominal titers of the QC samples were based on multiple measurements on stock serum sample M31-70, corrected for the dilution in negative serum. These nominal titers and acceptance ranges are listed in Table 1.
Table 1.
Titers for QC samples representing the range of the assay and used as validation samples
| QC no. | Titer (EU/ml) |
||
|---|---|---|---|
| Nominala | Lower limit | Upper limit | |
| QC1 | 635 | 476 | 794 |
| QC2 | 282 | 226 | 339 |
| QC3 | 125 | 100 | 151 |
| QC4 | 55.8 | 44.6 | 66.9 |
| QC5 | 24.8 | 18.6 | 31.0 |
| QC6 | <18 | 18 | |
Nominal values were determined during development of the assay.
Data analysis and statistical methods.
Data were analyzed using Gen5 software, version 1.05. Sample titers were calculated in relation to that for the reference serum, which was designated to have a titer of 2,315 ELISA units (EU)/ml, as described in the Results section. All samples were tested at 2 dilutions, 1/100 and 1/200, and all dilutions were tested in duplicate wells. Measurements were accepted if the CV of duplicate measurements was within 20% and if the CV of the two dilutions was within 20% (on the basis of the calculated concentrations). The reportable value was defined as the average titer of the duplicate wells of the 1/100 sample dilutions. For the analysis of linearity and robustness, the titers were log10 transformed to obtain a normal distribution of data. Analysis of precision and accuracy was based on nontransformed data because the applicable guidelines prescribe acceptance criteria expressed in percent, which is not possible on a log scale. Means, standard deviations (SDs), and CVs were calculated using SAS software (version 9.1), command proc means. Intermediate precision and reproducibility were based on the root mean squared errors of regression models (SAS command proc glm), with the experiment and/or sample code being grouping variables.
RESULTS
Basic assay setup.
The basic ELISA protocol described in the Materials and Methods section was performed using test sera that tested positive for CS-specific antibodies in other laboratories. We optimized the peptide coating, secondary antibody manufacturer, and working concentration by cross titration of coating and secondary antibodies (data not shown).
Reference standard.
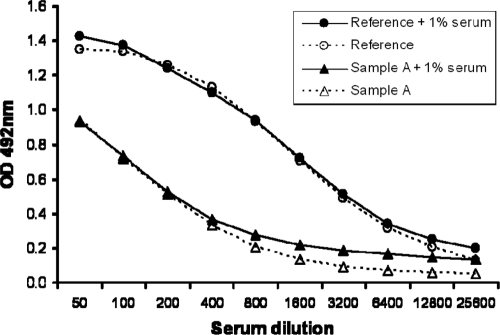
CS-positive serum sample IR2 was selected for use as the reference standard because it showed a strong signal in the ELISA and because a sufficient volume was available for prolonged usage. The reference standard was serially diluted in PBS or in PBS–1% normal human serum (Fig. 1). The seven successive dilutions from 1/200 to 1/12,800 resulted in values above 0.2 OD unit, included the linear range of the response curve, and were consequently selected as the calibration range.
Fig. 1.
Establishment of calibration curve. Reference serum and serum sample A were tested in 2-fold serial dilutions in PBS or PBS–1% normal human serum.
The addition of serum to the dilution buffer primarily had an effect at the low antibody concentrations, where the background of the serum increased the OD value compared to that obtained by dilution in buffer without serum. African serum sample A was tested in parallel and showed similar results. It was decided to test serum samples using dilutions of 1/100 and 1/200 to check for dilutional linearity within each individual serum sample. To keep all samples and reference standard dilutions in the same matrix, human serum is added to sample dilution buffer to obtain a 1% serum end concentration for all test samples, control samples, and reference standard dilutions.
Since the absolute antibody concentration in the serum cannot be quantified, reference standard serum sample IR2 was used to calculate relative ELISA titers for test samples, resulting in a quasiquantitative assay. Serial dilution of the IR2 serum resulted in a typical S curve (Fig. 1). At a dilution of 1/2,315, an OD value equivalent to 50% of the maximum OD value was measured. Therefore, a titer of 2,315 was assigned to the IR2 reference serum and is expressed as ELISA units/ml. The upper LOQ (ULOQ) of the assay is 11.58 EU/ml (1/200 dilution of the standard), and the lower LOQ is 0.18 EU/ml (1/12,800 dilution of the standard). When serum samples were tested at a 1/100 dilution, the actual range of the assay is thus 18 EU/ml to 1,158 EU/ml.
Analysis of sera from subjects from areas of endemicity, vaccinated subjects, and negative subjects.
Three categories of samples were subsequently tested in the ELISA to test the applicability of the assay. Eight samples were derived from African individuals from regions where malaria is endemic, and four samples were derived from individuals vaccinated with candidate malaria vaccines. Ten serum samples were obtained from European donors to represent negative samples (Fig. 2). CS antibody titers could be detected in both sera from an area where malaria is endemic and sera from vaccinated individuals, whereas the titers for all presumed negative sera were below the LOQ. These results show that the range of the ELISA is sufficient to detect both antibody responses in sera from areas of endemicity and strong vaccine-induced antibody responses.
Fig. 2.
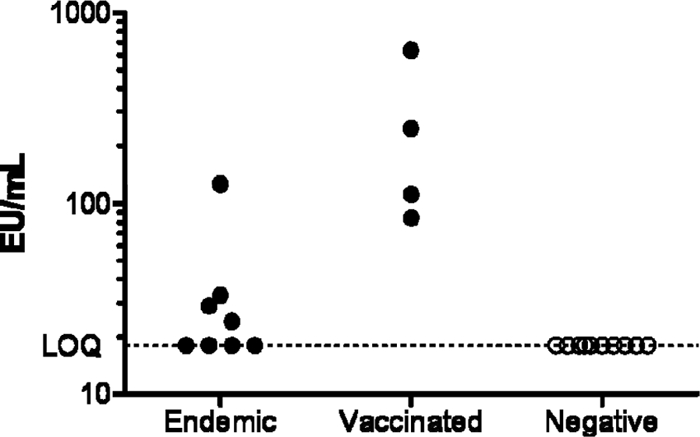
CS-specific antibody titers (EU/ml) obtained in sera derived from regions of endemicity, vaccination trials, and presumed negative donors.
Agreement with CS protein-specific antibody titers.
It is assumed that CS peptide binding antibodies correlate with the total CS-specific antibody responses, as reported previously (4). To extend this finding to our assay setup, a selected number of samples was tested in an ELISA using recombinant CS protein as capture antigen. This CS protein batch was produced on Hansenula polymorpha yeast for research purposes (13); however, the quantity of this protein source system cannot be continuously guaranteed for it to be a reliable source of antigen in a standard assay. Figure 3 shows the correlation between the two techniques. Although one sample clearly shows a high antibody titer against the whole protein, only a low titer against the repeat peptide is measured. This could be explained by the possibility of additional antibodies directed against epitopes outside the repeat region. As expected, the readout with the repeat peptide gives a slight underestimation of the antibody titers. Overall, however, this limited data set confirms the previously reported correlation by Del Giudice et al. (4).
Fig. 3.
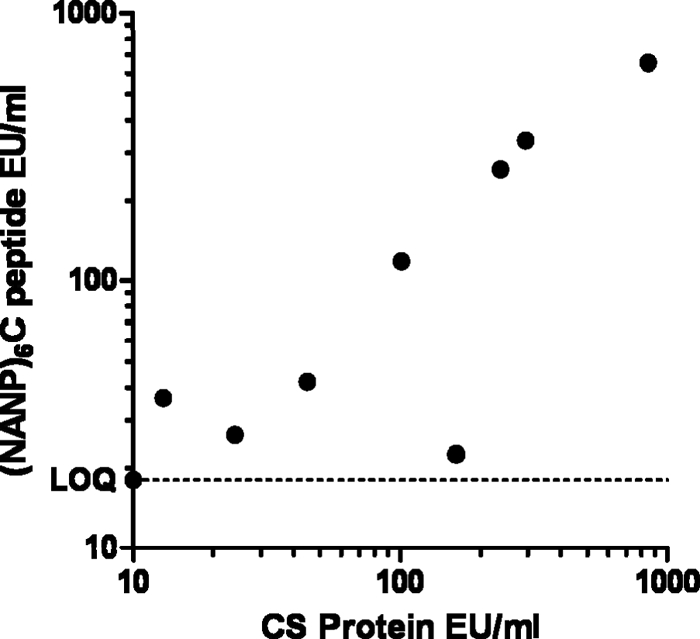
Comparison of ELISA titers of human serum samples derived from malaria-exposed Africans and vaccinated subjects. The titers were obtained in the peptide-based ELISA and a CS protein-based ELISA.
Robustness.
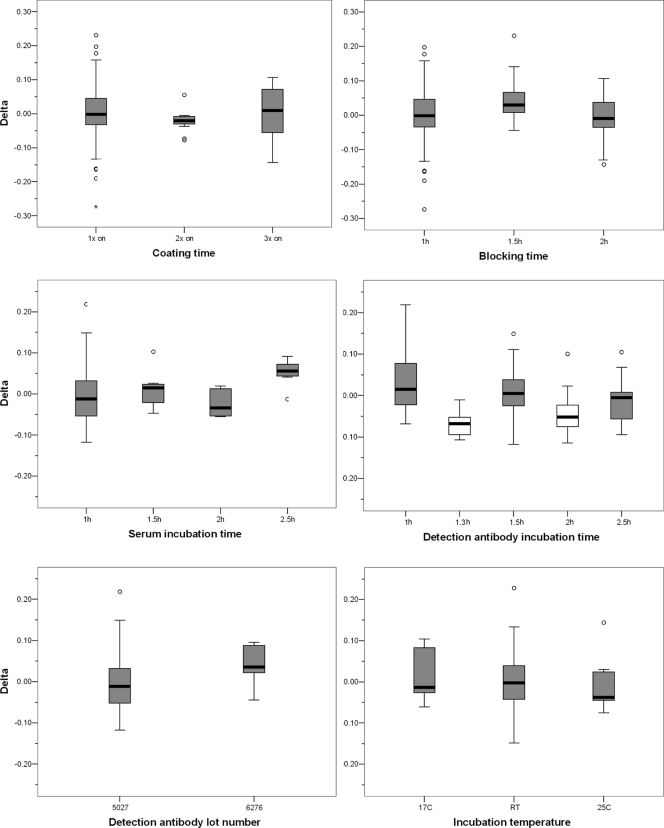
The robustness of the assay was investigated by deliberately changing several parameters in the protocol and determining the assay variation caused by the changes. Eight human serum samples of various anti-P. falciparum CS antibody concentrations that represent negative, low, intermediate, and high titers (positive samples in Fig. 2) were subjected to the robustness experiments. The measured titers were log10 transformed to obtain a normal distribution of titers. For each sample, the average titer was calculated using all robustness measurements irrespective of the variables. Then, for each individual measurement, the difference (delta) from the average titer was calculated. This was done to adjust for the difference in titers between the individual serum samples. Note that differences in log values are actually ratios on a linear scale. The effect of each parameter was analyzed by plotting the delta for each variable (Fig. 4). A substantial effect of a parameter on the outcome should be apparent by a box plot that is not centered on a delta value of zero. Subsequent analysis was performed using analysis of variance (ANOVA) and a post hoc test with a Bonferroni correction.
Fig. 4.
Robustness experiments with various assay parameters. Tests were conducted for coating, blocking, serum, and detection antibody incubation times; detection antibody lot number; and temperatures for blocking, serum, and detection incubation. White box plots indicate significant differences in titers compared to those obtained with other incubation times.
No statistically significant differences were observed for coating, blocking, and serum incubation times; detection antibody lot number; and incubation temperatures. For incubation times of the detection antibody, however, a statistically significant difference was found for 1.3 and 2 h incubation with anti-human HRP compared to 1, 1.5, and 2.5 h. These differences do not follow a logical trend, however, and the observed differences cannot be avoided by restricting the incubation time. Therefore, we interpret these differences to be assay variation not related to the tested incubation times. In summary, the ELISA is adequately robust, with wide ranges of acceptable incubation times.
Assay validation. (i) Specificity.
Specificity of the assay was determined by diluting QC sample 2 (QC2) 2-fold in five different negative serum batches. Since the Ad35-based malaria vaccine will likely induce vector-specific antibodies, QC2 was also spiked in a serum sample that was positive for Ad35. A maximum bias of 20% compared to the nontreated QC2 was set as the acceptance criterion. The results corrected for the dilution factor are listed in Table 2 and indicate that neither negative serum nor Ad35-positive serum introduced a bias of more than 4% in the CS-specific response.
Table 2.
Specificity was tested by spiking QC2 into 6 negative serum batches and comparing the result to that for nontreated QC2
| Sample | Titer (EU/ml) | Accuracy (%) | Bias (%) |
|---|---|---|---|
| QC2 | 278 | ||
| QC2 + serum 1 | 279 | 100.3 | 0.3 |
| QC2 + serum 2 | 278 | 99.7 | −0.3 |
| QC2 + serum 3 | 269 | 96.6 | −3.4 |
| QC2 + serum 4 | 279 | 100.2 | 0.2 |
| QC2 + serum 5 | 272 | 97.9 | −2.1 |
| QC2 + Ad35-positive serum | 283 | 101.5 | 1.5 |
(ii) Repeatability, intermediate precision, and accuracy.
Assay variation was investigated on five internal controls (QC1 through QC5) in triplicate measurements in seven independent experiments. A selection of five sources of variation was introduced in the experiments, including operator, carbonate buffer lot number, blocking/sample buffer lot number, detection antibody lot number, and OPD stop solution lot number. Two or three representatives were selected for each source. Acceptance criteria were set at 25% CV for QC1 and QC5, which are close to the ULOQ or LLOQ, and 20% CV for QC2, QC3, and QC4. The repeatability, or intra-assay precision, was determined by analyzing all data obtained in the precision experiments in an ANOVA for each QC sample, with assay run as a fixed factor. For each QC, the mean titer, SD, and CV were calculated. As shown in Table 3, the repeatability percent CV is within the acceptance criteria specified above for all QC samples individually.
Table 3.
Repeatability (intra-assay CV), intermediate precision (interassay CV), and accuracy results of precision experimentsa
| Parameter | QC1 | QC2 | QC3 | QC4 | QC5 |
|---|---|---|---|---|---|
| Nominal titer (EU/ml) | 635 | 282 | 125 | 55.8 | 24.8 |
| Acceptance titer range (EU/ml) | 476–794 | 226–339 | 100–151 | 44.6–66.9 | 18.6–31.0 |
| No. of samples | 17 | 17 | 18 | 18 | 36 |
| Mean titer (EU/ml) | 691.2 | 296.3 | 133.3 | 59.0 | 26.3 |
| Intra-assay SD | 80.2 | 22.8 | 10.6 | 2.6 | 1.2 |
| Intra-assay % CV | 11.6 | 7.7 | 8.0 | 4.4 | 4.4 |
| Interassay SD | 97.9 | 41.0 | 14.1 | 8.2 | 2.8 |
| Interassay % CV | 14.2 | 13.8 | 10.5 | 13.8 | 10.8 |
| Accuracy (%) | 108.9 | 105.1 | 106.6 | 105.7 | 106.0 |
| Bias (%) | 8.9 | 5.1 | 6.6 | 5.7 | 6.0 |
| Total error | 23.1 | 18.9 | 20.7 | 19.5 | 16.8 |
Composed from Output SAS analysis.
The intermediate precision or interassay variability was calculated using all data from all experiments for each QC sample, thus including the assay run variability. As shown in Table 3, the intermediate precision (interassay percent CV) is within the specifications for all QC samples tested.
Since a “gold standard” serum sample with a known amount of CS antibodies is not available, it is not possible to determine the absolute accuracy of the assay. Instead, we have verified whether the validation results were within the acceptance ranges on the basis of the QC target concentrations, as determined during assay development. The overall bias toward the target concentrations of the five QC samples had to be within 25% (for QC1 and QC5, close to ULOQ and LLOQ) or 20% (for QC2, QC3, and QC4) of the nominal titer that was spiked. As shown in Table 3, the bias of all internal controls is within these specifications.
Finally, the total error, which is the bias plus the intermediate precision, does not exceed 24%, which is well within the criterion of 30%.
(iii) Linearity.
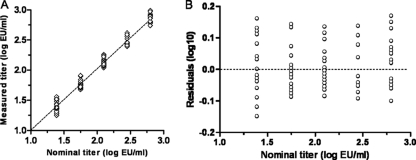
Since the QC samples were diluted from the same stock, the nominal values follow a serial dilution range of 2.25-fold dilutions. Linearity of the assay can thus be determined by correlating the measured QC results with the nominal values. Data from the precision experiments were log10 transformed, a linear regression line was fitted, and residuals were plotted against the nominal values (Fig. 5). The slope in Fig. 5A was 1.02, with a 95% confidence interval of 0.99 to 1.05. The residual plot in Fig. 5B shows a random distribution of data points around zero (dotted line), indicating no specific deviation from linearity. The assay is therefore considered linear in the range that has been validated in this study.
Fig. 5.
Analysis of linearity. (A) The measured QC titers obtained during all precision experiments are log transformed to obtain a normal distribution of data and plotted against the log nominal values. The resulting regression line is shown. (B) Residuals of the linear regression plotted against the nominal QC titers.
(iv) Stability.
Although antibodies in a serum matrix are generally regarded to be highly stable, we investigated the stability of the QC samples under various conditions that may occur during clinical sample analysis.
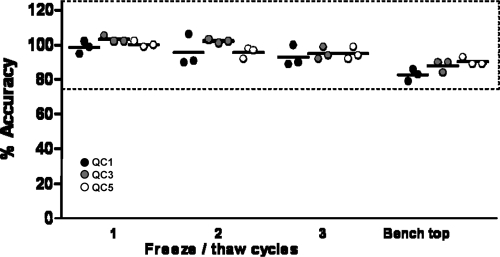
To investigate the effect of freeze-thaw cycles, three triplicate sets of QC1, QC3, and QC5 were subjected to one, two, and three freeze-thaw cycles by freezing at −80°C and thawing at room temperature. The acceptance criteria were set at biases of 25% for QC1 and QC5 and 20% for QC3. The accuracy of the treated QC samples is plotted as a percentage relative to that of the nontreated QC samples in Fig. 6. The results show no relevant differences of QC samples from nontreated samples after 3 cycles; therefore, it is concluded that clinical samples are allowed to be reanalyzed 3 times, provided that they are stored at −80°C.
Fig. 6.
Stability of QC samples 1, 3, and 5 was tested after 1, 2, and 3 freeze-thaw cycles and after 2 h at room temperature on the benchtop. Dotted lines represent ±25% bias acceptance criteria for QC1 and QC5.
In addition, the stability of the samples on the benchtop at room temperature for 2 h after they were completely thawed, representing the maximum processing time of samples during an assay run, was tested. The results in Fig. 6 show that the samples remained stable within the acceptable range.
(v) Reproducibility between different laboratories.
One of the main reasons to use a simple synthetic peptide instead of a recombinant protein of limited availability is that peptides facilitate the standardization of assays across different laboratories and enhance reproducibility between different laboratories. To verify this, we performed the validation of the same ELISA at a different laboratory, ABL, Assen, Netherlands. For each QC sample, the mean titer was calculated, and these were compared with the mean QC titers obtained during the validation at Crucell. The agreement of the results from the two laboratories are shown in Fig. 7.
Fig. 7.
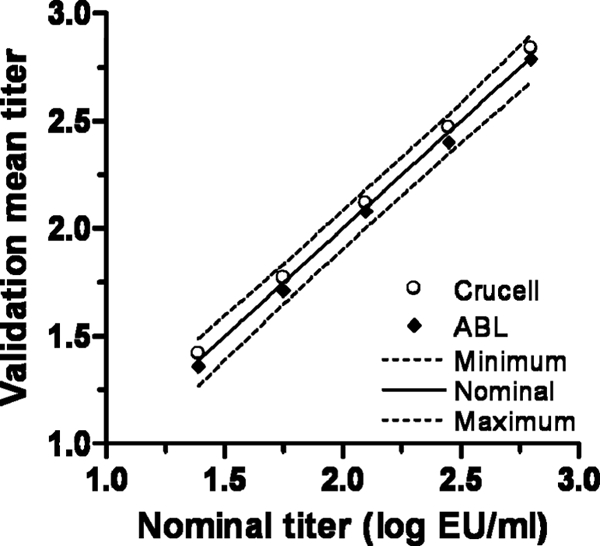
Reproducibility between different laboratories. Mean values obtained during the validation of the ELISA at two laboratories are plotted against the nominal values. The nominal values and the minimum and maximum acceptance limits (20% and 25% at LOQ) are indicated with solid and dashed lines, respectively.
The reproducibility between laboratories was calculated as the percent CV obtained with all the precision measurements at the two laboratories together (Table 4). Although increased variability could be expected between different laboratories, the reproducibility is comparable to the intermediate precision obtained at one laboratory alone.
Table 4.
Reproducibility of Crucell and ABL combineda
| Parameter | IC1 | IC2 | IC3 | IC4 | IC5 |
|---|---|---|---|---|---|
| Nominal titer (EU/ml) | 635 | 282 | 125 | 55.8 | 24.8 |
| Acceptance titer range (EU/ml) | 476–794 | 226–339 | 100–151 | 44.6–66.9 | 18.6–31.0 |
| No. of samples (Crucell + ABL) | 29 | 29 | 30 | 30 | 48 |
| Mean titer (EU/ml) | 662.9 | 278.4 | 127.6 | 56.1 | 25.5 |
| Reproducibility | |||||
| SD | 86.4 | 39.8 | 13.7 | 8.1 | 2.9 |
| % CV | 13.0 | 14.3 | 10.8 | 14.4 | 11.5 |
IC1 to IC5, internal control samples 1 to 5, respectively.
DISCUSSION
Using a simple synthetic peptide as capture antigen, we have developed a CS-specific antibody ELISA which successfully passed all acceptance criteria during assay validation. Following the successful validation, we have adopted this ELISA as our standard antibody readout assay for clinical studies. The use of synthetic peptides as capture antigen had previously been evaluated by several researchers, who showed the potential benefits of this approach (24). Del Giudice et al. have shown that, using a NANP40 peptide, antibody titers comparable to titers obtained with recombinant CS proteins could be measured (4), and we have confirmed this in our study using a shorter peptide. Stoute et al. have shown that the (NANP)6C was capable of strong inhibition of antibody binding to the same recombinant CS protein, R32LR (19). The R32LR recombinant protein has also been evaluated as capture antigen in a CS-specific antibody ELISA (6), but the limited availability of such a protein prohibits this protein from being the standard antigen. Using a simple peptide with six NANP repeats as standard antigen is therefore an attractive alternative that allows international comparison of antibody titers. Indeed, we have shown highly reproducible results between two different laboratories. Since the first report of using NANP repeat peptides as CS antigen (23), various versions ranging from 3 to 40 repeats have been used, mainly as a diagnostic antibody ELISA for epidemiological studies (2, 9–11, 15). A thorough comparison of the peptide antigen with protein antigens and whole parasite as antigen (immunofluorescence assay) has been performed by Del Giudice et al. (4). The current report has now demonstrated that such a peptide-based ELISA is fit for the purpose of an immunogenicity assay for the evaluation of malaria vaccines in clinical trials and with full validation according to FDA guidelines.
The need for a standard set of immunological assays was put forward as the first research goal in the malaria vaccine roadmap to enable comparisons of immune responses to vaccines (http://www.malariavaccineroadmap.net/pdfs/Malaria_Vaccine_TRM_Exec_Summary_Final.pdf). The antibody ELISA described here is capable of assessing the humoral immunogenicity of candidate CS-based malaria vaccines and is relatively easy to transfer to different labs. With these observations, the first criterion that a standard assay needs to comply with has been fulfilled.
ACKNOWLEDGMENTS
African human serum samples from a region where malaria is endemic were kindly provided by Adrian J. F. Luty (Department of Medical Parasitology of the Radboud University Nijmegen Medical Research Center, Nijmegen, Netherlands). U.S. human serum samples from individuals vaccinated with RTS,S-based vaccine were kindly provided by Ann Stewart (Department of Immunology of the WRAIR, Silver Spring, MD). A Swiss human serum sample positive for CS antibodies was kindly provided by Rinaldo Zurbriggen (Pevion Biotech Ltd., Bern, Switzerland).
Footnotes
Published ahead of print on 16 March 2011.
REFERENCES
- 1. Bruna-Romero O., Gonzalez-Aseguinolaza G., Hafalla J. C., Tsuji M., Nussenzweig R. S. 2001. Complete, long-lasting protection against malaria of mice primed and boosted with two distinct viral vectors expressing the same plasmodial antigen. Proc. Natl. Acad. Sci. U. S. A. 98:11491–11496 [DOI] [PMC free article] [PubMed] [Google Scholar]
- 2. Campbell G. H., et al. 1987. Detection of antibodies in human sera to the repeating epitope of the circumsporozoite protein of Plasmodium falciparum using the synthetic peptide (NANP)3 in an enzyme-linked immunosorbent assay (ELISA). Am. J. Trop. Med. Hyg. 37:17–21 [DOI] [PubMed] [Google Scholar]
- 3. Clyde D. F., Most H., McCarthy V. C., Vanderberg J. P. 1973. Immunization of man against sporozoite-induced falciparum malaria. Am. J. Med. Sci. 266:169–177 [DOI] [PubMed] [Google Scholar]
- 4. Del Giudice G., Douglas A., Verhave J. P., Wirtz R. A., Zavala F. 1989. Comparative analysis of ELISAs employing repetitive peptides to detect antibodies to Plasmodium falciparum sporozoites. Bull. World Health Organ. 67:515–523 [PMC free article] [PubMed] [Google Scholar]
- 5. FDA 2001. Guidance for industry. Bioanalytical method validation. FDA, Rockville, MD [Google Scholar]
- 6. Folena-Wasserman G., Inacker R., Rosenbloom J. 1987. Assay, purification and characterization of a recombinant malaria circumsporozoite fusion protein by high-performance liquid chromatography. J. Chromatogr. 411:345–354 [DOI] [PubMed] [Google Scholar]
- 7. Heppner D. G., Jr., et al. 2005. Towards an RTS,S-based, multi-stage, multi-antigen vaccine against falciparum malaria: progress at the Walter Reed Army Institute of Research. Vaccine 23:2243–2250 [DOI] [PubMed] [Google Scholar]
- 8. International Conference on Harmonisation 2005. Validation of analytical procedures: text and methodology Q2(R1). International Conference on Harmonisation, Geneva, Switzerland [Google Scholar]
- 9. Noland G. S., et al. 2008. Low prevalence of antibodies to preerythrocytic but not blood-stage Plasmodium falciparum antigens in an area of unstable malaria transmission compared to prevalence in an area of stable malaria transmission. Infect. Immun. 76:5721–5728 [DOI] [PMC free article] [PubMed] [Google Scholar]
- 10. Nuzzolo C. A., Bernardi A., Verdini A. S., Pessi A. 1990. A rapid inhibition micro ELISA for detecting antibodies to Plasmodium falciparum sporozoites in human blood. J. Immunoassay 11:389–412 [DOI] [PubMed] [Google Scholar]
- 11. Orlandi-Pradines E., et al. 2006. Antibody responses to several malaria pre-erythrocytic antigens as a marker of malaria exposure among travelers. Am. J. Trop. Med. Hyg. 74:979–985 [PubMed] [Google Scholar]
- 12. Radosevic K., Rodriguez A., Lemckert A., Goudsmit J. 2009. Heterologous prime-boost vaccinations for poverty-related diseases: advantages and future prospects. Expert Rev. Vaccines 8:577–592 [DOI] [PubMed] [Google Scholar]
- 13. Radosevic K., et al. 2010. The Th1 immune response to Plasmodium falciparum circumsporozoite protein is boosted by adenovirus vectors 35 and 26 with a homologous insert. Clin. Vaccine Immunol. 17:1687–1694 [DOI] [PMC free article] [PubMed] [Google Scholar]
- 14. Rodriquez A., et al. 2009. Evaluation of a prime-boost vaccine schedule with distinct adenovirus vectors against malaria in rhesus monkeys. Vaccine 27:6226–6233 [DOI] [PubMed] [Google Scholar]
- 15. Roy A., Sharma V. P., Chauhan V. S. 1994. The use of peptide ELISA in determining malaria endemicity. J. Immunol. Methods 167:139–143 [DOI] [PubMed] [Google Scholar]
- 16. Shiver J. W., et al. 2002. Replication-incompetent adenoviral vaccine vector elicits effective anti-immunodeficiency-virus immunity. Nature 415:331–335 [DOI] [PubMed] [Google Scholar]
- 17. Shott J. P., et al. 2008. Adenovirus 5 and 35 vectors expressing Plasmodium falciparum circumsporozoite surface protein elicit potent antigen-specific cellular IFN-gamma and antibody responses in mice. Vaccine 26:2818–2823 [DOI] [PubMed] [Google Scholar]
- 18. Stewart V. A., et al. 2007. Priming with an adenovirus 35-circumsporozoite protein (CS) vaccine followed by RTS,S/AS01B boosting significantly improves immunogenicity to Plasmodium falciparum CS compared to that with either malaria vaccine alone. Infect. Immun. 75:2283–2290 [DOI] [PMC free article] [PubMed] [Google Scholar]
- 19. Stoute J. A., et al. 1995. Induction of humoral immune response against Plasmodium falciparum sporozoites by immunization with a synthetic peptide mimotope whose sequence was derived from screening a filamentous phage epitope library. Infect. Immun. 63:934–939 [DOI] [PMC free article] [PubMed] [Google Scholar]
- 20. Sullivan N. J., Sanchez A., Rollin P. E., Yang Z. Y., Nabel G. J. 2000. Development of a preventive vaccine for Ebola virus infection in primates. Nature 408:605–609 [DOI] [PubMed] [Google Scholar]
- 21. Viswanathan C. T., et al. 2007. Quantitative bioanalytical methods validation and implementation: best practices for chromatographic and ligand binding assays. Pharm. Res. 24:1962–1973 [DOI] [PubMed] [Google Scholar]
- 22. Walther M. 2006. Advances in vaccine development against the pre-erythrocytic stage of Plasmodium falciparum malaria. Expert Rev. Vaccines 5:81–93 [DOI] [PubMed] [Google Scholar]
- 23. Zavala F., Cochrane A. H., Nardin E. H., Nussenzweig R. S., Nussenzweig V. 1983. Circumsporozoite proteins of malaria parasites contain a single immunodominant region with two or more identical epitopes. J. Exp. Med. 157:1947–1957 [DOI] [PMC free article] [PubMed] [Google Scholar]
- 24. Zavala F., et al. 1985. Rationale for development of a synthetic vaccine against Plasmodium falciparum malaria. Science 228:1436–1440 [DOI] [PubMed] [Google Scholar]
- 25. Zavala F., Tam J. P., Masuda A. 1986. Synthetic peptides as antigens for the detection of humoral immunity to Plasmodium falciparum sporozoites. J. Immunol. Methods 93:55–61 [DOI] [PubMed] [Google Scholar]


