

Abstract
Planar solid supported single lipid bilayers on mica, glass, or other inorganic surfaces have been widely used as models for cell membranes. To more closely mimic the cell membrane environment, soft hydrophilic polymer cushions were introduced between the hard inorganic substrate and the lipid bilayer to completely avoid the possible substrate-lipid interactions. In this article, sum frequency generation (SFG) vibrational spectroscopy was used to examine and compare single lipid bilayers assembled on the CaF2 prism surface and on poly (L-lactic acid) (PLLA) cushion. By using asymmetric lipid bilayers composed of a hydrogenated 1,2-dipalmitoyl-sn-glycerol-3-phosphoglycerol (DPPG) leaflet and a deuterated 1,2-dipalmitoyl-(d62)-sn-glycerol-3-phosphoglycerol (d-DPPG) leaflet, it was shown that the DPPG lipid bilayers deposited on the CaF2 and PLLA surfaces have similar structures. SFG has also been applied to investigate molecular interactions between an antimicrobial peptide Cecropin P1 (CP1) and the lipid bilayers on the above two different surfaces. Similar results were again obtained. This research demonstrated that the hydrophilic PLLA cushion can serve as an excellent substrate to support single lipid bilayers. We believe that it can be an important cell membrane model for future studies on transmembrane proteins, for which the possible inorganic substrate-bilayer interactions may affect the protein structure or function.
1. Introduction
Planar supported single lipid bilayers have successfully mimicked many aspects of cell membrane behavior.1–7 With the inherent fluidity, they have been used to investigate cell membrane structure, dynamics, lipid assembly, and multivalent ligand-receptor binding. Despite these great achievements, the incorporation of transmembrane proteins into supported lipid bilayers has not yet been satisfactorily explored. This is largely due to the limited space between the bottom leaflet of the bilayer and the solid supporting substrate. Typically, the distance between the bilayer and the underlying solid substrate is only around 1 nm. Proteins as well as other substances (e.g., nanoparticles) may penetrate through real cell membranes in vivo. While in the supported lipid bilayer systems, due to the limited space between the bilayer and the solid support, they might stay inside the bilayers, leading to substantial lipid bilayer damage.8,9
In the last few decades, numerous efforts have been made to increase the space between the lipid bilayer and the substrate to more closely resemble the cell membrane environment. The most common strategy is to introduce a polymer cushion between the bilayer and the supporting substrate.10–13 The use of soft hydrophilic polymeric materials is an excellent choice for the construction of the cushion because such materials can absorb/contain large quantities of water.
In our previous studies, neutral CaF2 prisms were used as supporting substrates for supported lipid bilayers since they did not exhibit substantial interactions with charged lipid bilayers or other charged molecules. In this research, to completely exclude the possibility of interactions between the lipid bilayer and the inorganic solid substrate for future transmembrane protein studies, a poly (L-lactide acid) (PLLA) thin film was introduced as a soft polymeric cushion between the CaF2 substrate and the lipid bilayer assembly.
PLLA is a hydrophilic polymer that can imbibe large quantities of water while serving as a solid supporting substrate for lipid bilayers.14–16 In addition, PLLA is an inert polymer that does not present any antigenic activity. PLLA is stable enough to investigate the interactions between the lipid bilayers and biological molecules.
In this study, 1,2-dipalmitoyl-sn-glycerol-3-phosphoglycerol (DPPG) and 1,2-dipalmitoyl-(d62)-sn-glycerol-3-phosphoglycerol (d-DPPG) were used as lipids for model bacterial cell membranes since the negatively charged phosphatidylglycerol is the major component in bacterial cell membranes. The structural information of d-DPPG/DPPG bilayers deposited on the CaF2 and PLLA substrates was investigated and compared. The negative charges on the DPPG bilayer ensure their strong interactions with positive charged peptides, proteins or nanoparticles. It is believed that the order of lipid bilayer alkyl chains mediated by the underlying substrate would play important roles in interactions between lipid bilayers and biomolecules like peptides.17 Here interactions between a model peptide named Cecropin P1 (CP1) and DPPG bilayers deposited on CaF2 and PLLA were also examined and compared. CP1 is an antimicrobial peptide, adopting an α-helical structure in a lipid bilayer.18 Their orientations in the lipid bilayers deposited on CaF2 and PLLA were determined and compared. Sum frequency generation (SFG) vibrational spectroscopy was employed in this study to characterize the order and orientation of lipid bilayers and CP1.
2. Experimental Section
2.1 Materials
GC grade CHCl3 was acquired from Mallinckrodt. Choline chloride (99+%) and PLLA (MW~6000) were obtained from Sigma-Aldrich (Milwaukee, Wisconsin). DPPG and d-DPPG were purchased from Avanti Polar Lipids (Alabaster, AL). These materials were used without any further purification. The molecular structures of DPPG, d-DPPG, and PLLA are shown in Fig. 1.
Fig. 1.

Molecular structure of A) 1,2-dipalmitoyl-sn-glycerol-3-phosphoglycerol (DPPG); B) 1,2-dipalmitoyl-(d62)-sn-glycerol-3-phosphoglycerol (d-DPPG); C) poly (L-lactic acid) (PLLA).
2.2. Sample Preparation
Right-angle CaF2 prisms were purchased from Altos, Inc. (Trabuco Canyon, CA). Before lipid bilayer or PLLA deposition, CaF2 prisms were stored in toluene overnight and rinsed with water before soaking in methanol for an hour. All the CaF2 prisms were rinsed thoroughly with an ample amount of deionized water and then cleaned inside a glow discharge plasma chamber for 4 min immediately before bilayer or PLLA preparation. Substrates were tested using SFG, and no contamination was detected. PLLA films were prepared by spin coating 1 wt % PLLA/toluene solution at 3000 rpm on CaF2 prisms. The films were then annealed at 50 °C for 12 h. The PLLA film thickness is about 100 nm.
The Langmuir-Blodgett/Langmuir-Schaefer (LB/LS) technique was used to prepare the lipid bilayers on CaF2 or PLLA.19 A 1 mg/mL solution of lipid in CHCl3 was spread at the air/water interface of a Langmuir-Blodgett trough (KSV Instruments). As described previously,19–22 the first lipid layer was deposited on a CaF2 or PLLA (on CaF2) substrate via a vertical pull of the substrate from the aqueous subphase into air. The second layer was deposited via the LS method by horizontally lowering the substrate (already with a monolayer of lipid) into the subphase. The lipid bilayers were maintained in an aqueous environment after the deposition. All LB and LS film transfers were carried out at a lipid surface pressure of 34 mN/m at 22 °C. Isotopically asymmetric bilayers were prepared by first depositing a monolayer of d-DPPG followed by the deposition of a monolayer DPPG.
2.3 SFG Experiment
SFG has been extensively applied to investigate various lipid monolayers and bilayers previously.23–41 Details about the SFG technique42–63 and our SFG setup can be found in previous papers and will not be repeated here.45,46 A near total reflection geometry was used for all experiments discussed in this paper.64 Most SFG spectra presented in this study were collected with an ssp (s-polarized SFG signal, s-polarized visible, and p-polarized IR) polarization combination of the input and signal beams. In the lipid bilayer – peptide interaction studies, SFG ppp spectra were also collected. Input laser beams were incident onto one of the right-angle faces of a prism and then reflected by the other right-angle face coated with the bilayer, as shown in Fig. 2. Details about the analysis of SFG spectra are presented below as well as in the supporting information.
Fig. 2.

Schematic of the SFG experimental geometry
3. Results and Discussion
It is believed that membrane lipids play very important roles for different cell functions. It is therefore important to understand how the membrane lipid composition regulates membrane protein folding, trafficking (transportation), organization (assembly) and function. We believe that the polymer cushion supported lipid bilayer examined here could more accurately mimic the real cell membrane environment for transmembrane protein studies in the future. Here we want to compare the lipid bilayers prepared on the PLLA cushion and on the CaF2 to see whether they are similar and whether they behave similarly while interacting with small peptides. The water contact angles were found to be lower than 30° on the PLLA cushion, indicating that the PLLA surface is highly hydrophilic, similar to that of CaF2.
3.1 SFG Spectra Collected from the Lipid Bilayers on CaF2 and PLLA Cushion
Fig.3 shows the SFG ssp spectra collected from the d-DPPG/DPPG lipid bilayers deposited on different substrates, CaF2 vs. PLLA, respectively. The spectra were obtained in the C-D (from d-DPPG) and C-H (from DPPG) stretching frequency regions. The SFG peak assignments were reported previously.65 For the DPPG leaflet, the SFG ssp spectrum is dominated by the C-H symmetric stretching mode (2875 cm−1) and the Fermi resonance (2940 cm−1) of the tail methyl groups. For the d-DPPG leaflet, the SFG ssp spectrum is dominated by the CD3 symmetric stretching at 2070 cm−1.
Fig. 3.

SFG ssp spectra collectd from the d-DPPG (A, B) leaflet in the C-D stretching frequency region and the DPPG (C, D) leaflet in the C-H stretching frequency region. Spectra A and C were collected from the lipid bilayer deposited on the CaF2 prism, while spectra B and D were detected from the lipid bilayer deposited on the PLLA cushion.
The SFG signal intensity (I) is proportional to the effective second order nonlinear optical susceptibility , which depends on the IR frequency:42,48
| (1) |
| (2) |
where, ω2 and ωq represent the frequencies of the infrared and qth peak center, respectively, Γq is the damping coefficient, and Aq is the signal strength. When different polarization combinations of input/signal beams (e.g., ssp or ppp) are used, different components of the (such as or ) can be determined. Such effective second order nonlinear optical susceptibility components are related to the second order nonlinear optical susceptibility components defined in the lab coordinate system (where z is usually defined as the surface normal and x-y plane is the surface/interface. The x-z plane contains the input and signal beams). Using the near total reflection geometry (Fig. 2), we have:
| (3) |
| (4) |
where Lyyz and Lzzz are Fresnel factors.
Fig.3 shows that the SFG spectral features for the d-DPPG/DPPG bilayers on different substrates, CaF2 vs. PLLA, are the same. SFG spectra were fitted using the equations (1) and (2) and the fitted spectra are shown as red lines in Fig. 3. The fitting parameters are displayed in Tables 1 and 2. Quantitatively, comparison of the normalized fitting signal strength for each peak in the SFG spectra collected from the lipid bilayers on the CaF2 and PLLA surfaces indicates that the relative signal strengths for various peaks in two cases are more or less the same. Therefore we believe that the lipid bilayers on the two substrates have the similar structure.
Table 1.
Spectral fitting results for C-D stretching signals
| Assignment | ωi (cm−1) | Ai (on CaF2) | Normalized Ai (on CaF2) | Ai (on PLLA) | Normalized Ai (on PLLA) | Γi (cm−1) |
|---|---|---|---|---|---|---|
| CD3, s | 2070 | 300 | 1.00 | 410 | 1.00 | 6 |
| CD2, s | 2100 | 20 | 0.07 | 20 | 0.05 | 10 |
| CD3, s, Fermi | 2120 | 200 | 0.67 | 290 | 0.71 | 10 |
| CD2, s, Fermi | 2140 | 180 | 0.60 | 270 | 0.66 | 12 |
| CD2, s, Fermi | 2172 | 30 | 0.10 | 50 | 0.12 | 10 |
| CD3, a | 2212 | −170 | −0.57 | −240 | −0.58 | 7 |
s: symmetric stretch, Fermi: Fermi resonance, a: asymmetric stretch
Table 2.
Spectral fitting results for C-H stretching signals
| Assignment | ωi (cm−1) | Ai (on CaF2) | Normalized Ai (on CaF2) | Ai (on PLLA) | Normalized Ai (on PLLA) | Γi (cm−1) |
|---|---|---|---|---|---|---|
| CH2, s | 2855 | 27 | 0.04 | 40 | 0.05 | 6 |
| CH3, s | 2879 | 610 | 1.00 | 740 | 0.97 | 7 |
| CH2, a | 2915 | −140 | −0.23 | −200 | −0.26 | 6 |
| CH3, Fermi | 2940 | 600 | 0.98 | 760 | 1.00 | 8 |
| CH3, a | 2961 | −125 | −0.20 | −155 | −0.20 | 10 |
s: symmetric stretch, Fermi: Fermi resonance, a: asymmetric stretch
The fitting results shown in Tables 1 and 2 reveal a small but detectable CD2 or CH2 signal, suggesting the presence of some gauche contents in the alkyl chains of the lipid bilayer. The deuterated methylene signal is more distinct than the hydrogenated methylene signal, indicating that the inner d-DPPG leaflet presents more gauche contents than the outer DPPG leaflet.
3.2 Stability of the Bilayer on Two Substrates
Fig. 4 shows the time-dependent SFG signals detected from the PLLA cushion supported and the CaF2 supported lipid bilayers. SFG ssp signals were collected at 2875 cm−1 (symmetric stretching of CH3) and 2070cm−1 (symmetric stretching of CD3) as a function of time. These signals are contributed from the end methyl groups of the inner and outer leaflets in the lipid bilayers on the two substrates. The SFG signals from the lipid bilayers constructed on the both substrates were very stable; no substantial signal decrease was detected within an hour or so. This shows that the lipid bilayers on both substrates can be stable during the entire time period to perform the SFG experiments to investigate these bilayers as well as to study interactions between these supported lipid bilayers and biological molecules, which will be presented later. We have used the CaF2 supported lipid bilayers in our previous SFG studies to examine molecular interactions between cell membranes and a variety of biological molecules including melittin, magainin 2, alamethicin, tachyplesin I, antimicrobial oligomers, Gβγ, and cytochrome b5.19,22,65–70 In the following we will demonstrate that the PLLA cushioned lipid bilayer should be stable enough to perform similar studies.
Fig. 4.

SFG signal intensities at 2875 cm−1 (for C-H signals) and at 2070 cm−1 (for C-D signals) monitored as a functional of time. The signals were offset. The signals are stable for at least one hour, indicating that the bilayers are stable during the time period of the SFG experiments.
3.3 Orientations of the DPPG and d-DPPG Alkyl Chains
Before we examined the interactions between biological molecules and the lipid bilayers deposited on the two substrates, we further studied the details of the d-DPPG/DPPG bilayers on CaF2 and on PLLA cushion, e.g., the orientations of the methyl end groups in each leaflet of the bilayer. As discussed in previous publications, methyl stretching signals can serve as an indicator to study lipid alkyl chain order and orientation.21,71 The orientation of methyl groups has been extensively deduced from SFG spectra collected by using different polarization combinations.42,72 In this study, we assumed a delta orientation distribution for the methyl end groups. We believe that such an assumption is reasonable because the lipid bilayer should be more or less ordered. Here, the tilt angle of the methyl end group was determined by analyzing the intensity ratio between the methyl symmetric stretch and the asymmetric stretch in the ssp SFG spectrum.
The details about the orientation determination are presented in the supporting information using the published approaches. It was found that the orientations of the CH3 and CD3 groups on the CaF2 and PLLA surfaces are identical (supporting information), further confirming that the lipid bilayers adopt similar structures on the two substrates. The orientation angles of the terminal CH3 and CD3 groups of the fatty acid chains in the bilayer were deduced to be 18.0° for the DPPG leaflet in contact with water and 16.5° for the d-DPPG leaflet in contact with both CaF2 prism and PLLA cushion. If an all-trans conformation of the alkyl chain in the lipid is assumed,27,32,73,74 the fatty acid chains in the bottom and top leaflets of the lipid bilayer are tilted at 17.0° and 18.5° from the surface normal respectively (Fig. 5).
Fig. 5.
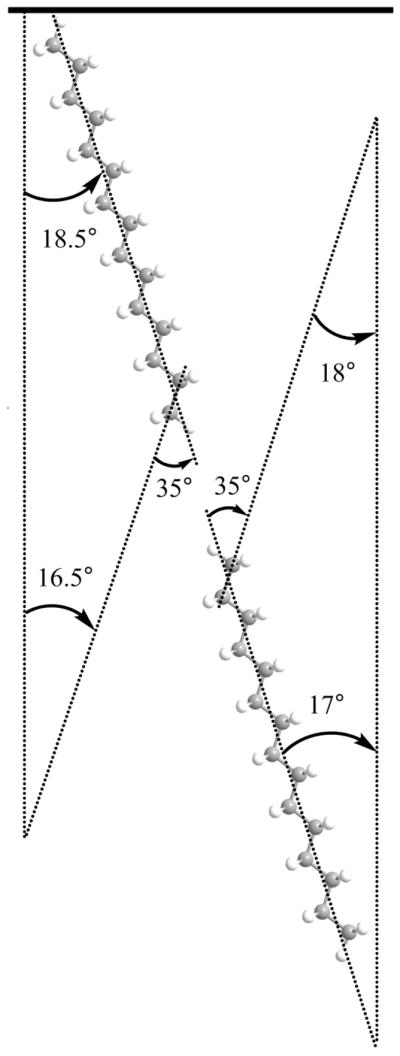
Schematic showing the methyl tilt angle and the alkyl chain orientation. The upper leaflet is d-DPPG, and the lower leaflet is DPPG.
The tilt of the lipid chains is thought to be due to the size “mismatch” between the lipid head and the tail.32 In a DPPG molecule, the “lateral” size of the headgroup is relatively larger than alkyl chains. As a result, in a close-packed environment, the lipid chains must be tilted to some extent to compensate for the head-tail size mismatch to form a stable bilayer.
Again, the similarity of the DPPG and d-DPPG orientations in the bilayer on both CaF2 prism and PLLA cushion indicated that the bilayer structures are similar.
3.4 Interactions between Cecropin P1 and Lipid Bilayers on Two Substrates
To further confirm that the lipid bilayer constructed on the PLLA cushion serves as an excellent model membrane, we applied SFG to investigate molecular interactions between an α-helical peptide, Cecropin P1 (CP1), and the DPPG bilayers deposited on the PLLA cushion (PLLA spin coated on CaF2 prism) and directly on the CaF2 prism.
Recently, SFG has been applied to study orientations of α-helical peptides at interfaces.75 The orientation of an α-helix can be determined by analyzing polarized SFG amide I spectra.75 More specifically, the orientation angle θ of an interfacial α-helix can be deduced from the SFG ppp and ssp signal strength ratio.75
SFG spectra were collected from the lipid bilayers prepared on CaF2 and PLLA cushion while in contact with CP1 solutions with different concentrations using ppp and ssp polarization combinations (Fig. 6). All such SFG spectra are dominated by a signal peak centered at ~1650 cm−1, indicating that CP1 adopts an α-helical structure associated with the DPPG bilayer. For three CP1 concentrations investigated here, the fitted signal strength ratios of the ppp and ssp spectra are different. For samples on the CaF2 substrate, when the concentrations of CP1 solutions are 12, 15 and 20 μM, the ratios of the fitted ppp/ssp signal strengths are 2.01, 1.47, and 1.25 respectively, leading to orientation angles (vs. the surface normal) of 71°, 27°, and out of range respectively, assuming a delta distribution. For samples on PLLA cushion, when the concentrations of CP1 are 12, 15 and 20 μM, the ratios of the fitted ppp/ssp signal strengths are 1.97, 1.54, and 1.15 respectively, leading to the orientation angles of CP1 on PLLA being 73°, 32 ° and out of range respectively, assuming a delta distribution. Clearly, for the same CP1 concentration, CP1 molecules adopt a similar orientation in the lipid bilayers constructed on the CaF2 surface and on the PLLA cushion.
Fig. 6.

SFG ssp and ppp spectra collected from CP1 associated with CaF2 supported lipid bilayer (left) and from CP1 associated with PLLA cushion supported lipid bilayer (right). The CP1 concentrations (from top to bottom) are 12, 15, and 20 μM.
Apparently, the orientation angles of CP1 associated with the lipid bilayers at different CP1 concentrations are quite different. When the CP1 concentration is low, the orientation angle was determined to be more than 70°, indicating that CP1 molecules are more or less lying parallel to the membrane surface. When the concentration is increased, CP1 molecules can insert into the bilayer and thus the orientation angle substantially decreased. They stand up more in the lipid bilayer. At an even higher concentration, the orientation of the CP1 molecules cannot be characterized by a single delta orientation distribution. They can adopt multiple distinct orientations, as we examined previously for other peptides.22
In addition to the SFG amide I signal collected from the peptides, we also studied the C-D stretching signals (Fig. 7) to understand how the lipid bilayer was disrupted during the CP1 – lipid bilayer interactions. SFG spectra were collected from the d-DPPG leaflet (next to the CaF2 or PLLA surface) when the bilayer was in contact with the CP1 solutions with different concentrations. The CP1 concentrations were varied by serial additions of more CP1 stock solutions into the subphase (The overall volumes of the CP1 stock solutions added are labeled in Fig. 7). The C-D SFG signals detected from the lipid bilayers on the two different substrates exhibit the same trend: SFG signal decreased when more CP1 was introduced to the solution. This is well correlated to the SFG amide I result: CP1 can insert into the bilayer when the concentration is higher enough, disrupting the deuterated leaflet. It can be seen that from the 30 μL to 60 μL, the C-D signals of the bilayers on both substrates decreased slightly. When 150 μL CP1 stock solution was added to the subphase, SFG signals from the d-DPPG leaflet on both substrates substantially decreased. Thus the concentration dependences for the lipid bilayers on the two substrates are similar. However they are not identical. From 60 μL to 80 μL, the signal from the d-DPPG leaflet next to the CaF2 surface did not show changes, but the signal from the d-DPPG leaflet next to the PLLA surface decreased noticeably. This slight difference may indicate that the interaction between the lipid bilayer and the CaF2 surface is a little bit stronger that that between the bilayer and the PLLA surface. Nevertheless, the lipid bilayers on the two substrates behaved similarly during the interactions with CP1, further confirming the similar structures of the lipid bilayers on the CaF2 surface and on the PLLA cushion.
Fig. 7.

SFG ssp (left) and ppp (right) spectra collected from the d-DPPG leaflet in the lipid bilayer in contact with CP1 solutions of different concentrations: Top: CaF2 supported lipid bilayer; Bottom: PLLA cushion supported lipid bilayer.
4. Summary
Similar features were observed in the SFG spectra collected from the isotopically asymmetric lipid bilayers deposited on bare CaF2 prism and PLLA cushion, indicating that the d-DPPG/DPPG lipid bilayers deposited on these two surfaces are similar. Quantitatively, the orientations of the alkyl chains in the d-DPPG and DPPG leaflets of the lipid bilayers prepared on the two different surfaces were determined to be the same. The average orientations of the lipid alkyl tails were determined to be approximately 17.0° for the DPPG leaflet in contact with water and 18.5° for the d-DPPG leaflet in contact with CaF2 or PLLA. Time dependent SFG signals demonstrated that the lipid bilayers constructed on the CaF2 surface as well as on the PLLA cushion were stable.
Similar results were also obtained from the SFG studies on the interactions between an α-helical peptide CP1 with the lipid bilayers constructed on the two different substrates. SFG amide I spectra from CP1 indicated that similar interactions between CP1 and the lipid bilayers on the two substrates occurred. When the CP1 concentration is low, CP1 molecules more or less lie down on the bilayer. When the concentration of CP1 increases, they can insert into the bilayer. When the concentration continues to grow, CP1 adopts multiple orientations. SFG C-D stretching signals also showed that the d-DPPG leaflet exhibited similar behavior during the bilayer - CP1 interactions for bilayers deposited on the CaF2 surface and on the PLLA cushion. It is worth mentioning that at the room temperature DPPG bilayer is in the gel phase, different from the lipid bilayers in cell membranes which are in the fluid phase. Even so, the studies on the interactions between DPPG bilayer (negatively charged) and CP1 molecules (positively charged) should elucidate the charge effect on the lipid-antimicrobial peptide interactions. In order to more closely model the real cell membranes, polymer cushioned fluid lipid bilayers (e.g., POPG) will be used to study molecular interactions between cell membranes and CP1 in the future.
Supported lipid bilayers on inorganic substrates were extensively used to study lipid bilayer properties using SFG. Our previous studies using lipid bilayers constructed on CaF2 demonstrated that such bilayers can serve as good model cell membranes to examine their interactions with small molecules such as peptides and antibiotic oligomers.19,22,65–70 In this study, we showed that the lipid bilayers prepared on the PLLA cushion are similar to those on CaF2, indicating that the hydrophilic PLLA cushion can serve as an excellent supporting substrate for lipid bilayers in similar studies. Furthermore, because of the soft nature of the PLLA, it can be an important and better cell membrane model for transmembrane proteins, for which the possible inorganic substrate-bilayer interactions may affect the structure or function. The comparison between the interactions of transmembrane proteins and lipid bilayers on the CaF2 surface and on the PLLA cushion will be studied in the future.
Supplementary Material
Acknowledgments
TW and NH gratefully acknowledge the support from (Chinese) National Key Program for Developing Basic Research (NO. 2007CB936104, 2010CB933903) and the (Chinese) 863 High Tech Project (NO. 2007AA022007, NO. 2007AA021905), the National Natural Science Foundation (of China) (NO. 60927001) as well as the Scientific Research Foundation of the Graduate School of Southeast University. ZC thanks the support from (US) National Institute of Health (1R01GM081655-01A2).
Footnotes
Supporting Information Available: Orientation analysis on methyl groups. This material is available free of charge via the internet at http://pubs.acs.org.
References
- 1.Brian AA, McConnell HM. Proc Natl Acad Sci USA. 1984;81:6159. doi: 10.1073/pnas.81.19.6159. [DOI] [PMC free article] [PubMed] [Google Scholar]
- 2.Tamm LK, Mcconnell HM. Biophys J. 1985;47:105. doi: 10.1016/S0006-3495(85)83882-0. [DOI] [PMC free article] [PubMed] [Google Scholar]
- 3.Castellana ET, Cremer PS. Surf Sci Rep. 2006;61:429. doi: 10.1016/j.surfrep.2006.06.001. [DOI] [PMC free article] [PubMed] [Google Scholar]
- 4.Chan YH, Boxer SG. Curr Opin Chem Biol. 2007;11:581. doi: 10.1016/j.cbpa.2007.09.020. [DOI] [PMC free article] [PubMed] [Google Scholar]
- 5.Tamm LK, Graves JT. J Struct Biol. 2009;168:1. doi: 10.1016/j.jsb.2009.07.016. [DOI] [PMC free article] [PubMed] [Google Scholar]
- 6.Liu J, Conboy JC. J Phys Chem C. 2007;111:8988. [Google Scholar]
- 7.Anglin TC, Cooper MP, Li H, Chandler K, Conboy JC. J Phys Chem B. 2010;114:1903. doi: 10.1021/jp909134g. [DOI] [PubMed] [Google Scholar]
- 8.Byrd MS, Sadovskaya I, Vinogradov E, Lu HP, Sprinkle AB, Richardson SH, Ma LY, Ralston B, Parsek MR, Anderson EM, Lam JS, Wozniak D. Mol Microbiol. 2009;73:622. doi: 10.1111/j.1365-2958.2009.06795.x. [DOI] [PMC free article] [PubMed] [Google Scholar]
- 9.Ross EE, Joubert JR, Wysocki RJ, Nebesny K, Spratt T, O’Brien DF, Saavedra SS. Biomacromolecules. 2006;7:1393. doi: 10.1021/bm050727l. [DOI] [PubMed] [Google Scholar]
- 10.Majewski J, Wong JY, Park CK, Seitz M, Israelachvili JN, Smith GS. Biophys J. 1998;75:2363. doi: 10.1016/S0006-3495(98)77680-5. [DOI] [PMC free article] [PubMed] [Google Scholar]
- 11.Wagner ML, Tamm LK. Biophys J. 2000;79:1400. doi: 10.1016/S0006-3495(00)76392-2. [DOI] [PMC free article] [PubMed] [Google Scholar]
- 12.Renner L, Pompe T, Lemaitre R, Drechsel D, Werner C. Soft Matter. 2010;6:5382. [Google Scholar]
- 13.Sackmann E, Tanaka M. Trends Biotechnol. 2000;18:58. doi: 10.1016/s0167-7799(99)01412-2. [DOI] [PubMed] [Google Scholar]
- 14.Vandoolaeghe P, Campbell RA, Rennie AR, Nylander T. J Phys Chem C. 2009;113:4483. [Google Scholar]
- 15.Ye Q, Konradi R, Textor M, Reimhult E. Langmuir. 2009;25:13534. doi: 10.1021/la902039g. [DOI] [PubMed] [Google Scholar]
- 16.Duan YX, Liu J, Sato H, Zhang JM, Tsuji H, Ozaki Y, Yan SK. Biomacromolecules. 2006;7:2728. doi: 10.1021/bm060043t. [DOI] [PubMed] [Google Scholar]
- 17.Schwieger C, Blume A. Biomacromolecules. 2009;10:2152. doi: 10.1021/bm9003207. [DOI] [PubMed] [Google Scholar]
- 18.Ye SJ, Nguyen KT, Boughton AP, Mello CM, Chen Z. Langmuir. 2010;26:6471. doi: 10.1021/la903932w. [DOI] [PMC free article] [PubMed] [Google Scholar]
- 19.Nguyen KT, Le Clair S, Ye SJ, Chen Z. J Phys Chem B. 2009;113:12358. doi: 10.1021/jp904154w. [DOI] [PMC free article] [PubMed] [Google Scholar]
- 20.Thompson NL, Palmer AG., III Mol Cell Biophys. 1988;5:39. [Google Scholar]
- 21.Chen X, Chen Z. Biochim Biophys Acta. 2006;1758:1257. doi: 10.1016/j.bbamem.2006.01.017. [DOI] [PubMed] [Google Scholar]
- 22.Chen X, Wang J, Boughton AP, Kristalyn CB, Chen Z. J Am Chem Soc. 2007;129:1420. doi: 10.1021/ja067446l. [DOI] [PubMed] [Google Scholar]
- 23.Watry MR, Tarbuck TL, Richmond GL. J Phys Chem B. 2003;107:512. [Google Scholar]
- 24.Liu J, Conboy JC. Biophys J. 2005;89:2522. doi: 10.1529/biophysj.105.065672. [DOI] [PMC free article] [PubMed] [Google Scholar]
- 25.Liu J, Conboy JC. J Am Chem Soc. 2004;126:8376. doi: 10.1021/ja048245p. [DOI] [PubMed] [Google Scholar]
- 26.Liu J, Conboy JC. J Am Chem Soc. 2004;126:8894. doi: 10.1021/ja031570c. [DOI] [PubMed] [Google Scholar]
- 27.Doyle AW, Fick J, Himmelhaus M, Eck W, Graziani I, Prudovsky I, Grunze M, Maciag T, Neivandt DJ. Langmuir. 2004;20:8961. doi: 10.1021/la0484220. [DOI] [PubMed] [Google Scholar]
- 28.Kim G, Gurau MC, Lim SM, Cremer PS. J Phys Chem B. 2003;107:1403. [Google Scholar]
- 29.Bonn M, Roke S, Berg O, Juurlink LBF, Stamouli A, Muller M. J Phys Chem B. 2004;108:19083. [Google Scholar]
- 30.Ye S, Noda H, Nishida T, Morita S, Osawa M. Langmuir. 2004;20:357. doi: 10.1021/la036008e. [DOI] [PubMed] [Google Scholar]
- 31.Chen XY, Clarke ML, Wang J, Chen Z. Int J Mod Phys B. 2005;19:691. [Google Scholar]
- 32.Ma G, Allen HC. Langmuir. 2006;22:5341. doi: 10.1021/la0535227. [DOI] [PubMed] [Google Scholar]
- 33.Anderson NA, Richter LJ, Stephenson JC, Briggman KA. J Am Chem Soc. 2007;129:2094. doi: 10.1021/ja066588c. [DOI] [PubMed] [Google Scholar]
- 34.Chen X, Tang H, Even MA, Wang J, Tew GN, Chen Z. J Am Chem Soc. 2006;128:2711. doi: 10.1021/ja057029t. [DOI] [PubMed] [Google Scholar]
- 35.Avery CW, Som A, Xu Y, Tew GN, Chen Z. Anal Chem. 2009;81:8365. doi: 10.1021/ac901271f. [DOI] [PubMed] [Google Scholar]
- 36.Harper KL, Allen HC. Langmuir. 2007;23:8925. doi: 10.1021/la7006974. [DOI] [PubMed] [Google Scholar]
- 37.Nickolov ZS, Britt DW, Miller JD. J Phys Chem B. 2006;110:15506. doi: 10.1021/jp0631578. [DOI] [PubMed] [Google Scholar]
- 38.Sovago M, Wurpel GWH, Smits M, Muller M, Bonn M. J Am Chem Soc. 2007;129:11079. doi: 10.1021/ja071189i. [DOI] [PubMed] [Google Scholar]
- 39.White RJ, Zhang B, Daniel S, Tang JM, Ervin EN, Cremer PS, White HS. Langmuir. 2006;22:10777. doi: 10.1021/la061457a. [DOI] [PubMed] [Google Scholar]
- 40.Oh-e M, Sasaki T, Noi M, Goto Y, Itoh K. Anal Bioanal Chem. 2007;3888:73. doi: 10.1007/s00216-006-1030-0. [DOI] [PubMed] [Google Scholar]
- 41.Tong Y, Li N, Liu H, Ge A, Osawa M, Ye S. Angew Chem, Int Ed. 2010;49:2319. doi: 10.1002/anie.200904950. [DOI] [PubMed] [Google Scholar]
- 42.Zhuang X, Miranda PB, Kim D, Shen YR. Phys Rev B. 1999;59:12633. [Google Scholar]
- 43.Bain CD. J Chem Soc, Dalton Trans. 1995;91:1281. [Google Scholar]
- 44.Eisenthal KB. Chem Rev. 1996;96:1343. doi: 10.1021/cr9502211. [DOI] [PubMed] [Google Scholar]
- 45.Wang J, Chen C, Buck SM, Chen Z. J Phys Chem B. 2001;105:12118. [Google Scholar]
- 46.Wang J, Paszti Z, Even MA, Chen Z. J Am Chem Soc. 2002;124:7016. doi: 10.1021/ja012387r. [DOI] [PubMed] [Google Scholar]
- 47.Scatena LF, Brown MG, Richmond GL. Science. 2001;292:908. doi: 10.1126/science.1059514. [DOI] [PubMed] [Google Scholar]
- 48.Chen Z, Shen YR, Somorjai GA. Annu Rev Phys Chem. 2002;53:437. doi: 10.1146/annurev.physchem.53.091801.115126. [DOI] [PubMed] [Google Scholar]
- 49.Chen P, Kung KY, Shen YR, Somorjai GA. Surf Sci. 2001;494:289. [Google Scholar]
- 50.Kim G, Gurau MC, Lim S-M, Cremer PS. J Phys Chem B. 2003;107:1403. [Google Scholar]
- 51.Perry A, Neipert C, Kasprzyk CR, Green T, Space B, Moore PB. J Chem Phys. 2005;14:144705. doi: 10.1063/1.2046630. [DOI] [PubMed] [Google Scholar]
- 52.Ye S, Noda H, Nishida T, Morita S, Osawa M. Langmuir. 2004;20:357. doi: 10.1021/la036008e. [DOI] [PubMed] [Google Scholar]
- 53.Gautam KS, Schwab AD, Dhinojwala A, Zhang D, Dougai SM, Yeganeh MS. Phys Rev Lett. 2000;85:3854. doi: 10.1103/PhysRevLett.85.3854. [DOI] [PubMed] [Google Scholar]
- 54.Yang CS-C, Richter LJ, Stephenson JC, Briggman KA. Langmuir. 2002;18:7549. [Google Scholar]
- 55.Bordenyuk AN, Jayathilake H, Benderskii AV. J Phys Chem B. 2005;109:15941. doi: 10.1021/jp051632g. [DOI] [PubMed] [Google Scholar]
- 56.Ma G, Liu DF, Allen HC. Langmuir. 2004;20:11620. doi: 10.1021/la0487343. [DOI] [PubMed] [Google Scholar]
- 57.Fitchett BA, Conboy JC. J Phys Chem B. 2004;108:20255. [Google Scholar]
- 58.Ye S, Morita S, Li G, Noda H, Tanaka M, Uosaki K, Osawa M. Macromolecules. 2003;36:5694. [Google Scholar]
- 59.Kweskin SJ, Komvopoulos K, Somorjai GA. Langmuir. 2005;21:3647. doi: 10.1021/la047223d. [DOI] [PubMed] [Google Scholar]
- 60.Baldelli S. Acc Chem Res. 2008;41:421. doi: 10.1021/ar700185h. [DOI] [PubMed] [Google Scholar]
- 61.Chen Z. Prog Polym Sci. 2010;35:1376. doi: 10.1016/j.progpolymsci.2010.07.003. [DOI] [PMC free article] [PubMed] [Google Scholar]
- 62.Ye S, Nguyen K, Le Clair SV, Chen Z. J Struct Biol. 2009;168:61. doi: 10.1016/j.jsb.2009.03.006. [DOI] [PMC free article] [PubMed] [Google Scholar]
- 63.Chen Z. Poly Inter. 2006;56:577. [Google Scholar]
- 64.Wang J, Even MA, Chen X, Schmaier AH, Waite JH, Chen Z. J Am Chem Soc. 2003;125:9914. doi: 10.1021/ja036373s. [DOI] [PubMed] [Google Scholar]
- 65.Chen X, Wang J, Kristalyn CB, Chen Z. Biophys J. 2007;93:866. doi: 10.1529/biophysj.106.099739. [DOI] [PMC free article] [PubMed] [Google Scholar]
- 66.Ye S, Nguyen K, Chen Z. J Phys Chem B. 2010;114:3334. doi: 10.1021/jp911174d. [DOI] [PMC free article] [PubMed] [Google Scholar]
- 67.Nguyen K, King JT, Chen Z. J Phys Chem B. 2010;114:8291. doi: 10.1021/jp102343h. [DOI] [PMC free article] [PubMed] [Google Scholar]
- 68.Chen X, Tang H, Even MA, Wang J, Tew GN, Chen Z. J Am Chem Soc. 2006;128:2711. doi: 10.1021/ja057029t. [DOI] [PubMed] [Google Scholar]
- 69.Chen X, Boughton AP, Tesmer JJG, Chen Z. J Am Chem Soc. 2007;129:12658. doi: 10.1021/ja075542w. [DOI] [PubMed] [Google Scholar]
- 70.Nguyen K, Soong R, Im S, Waskell L, Ramamoorthy A, Chen Z. J Am Chem Soc. 2010;132:15112. doi: 10.1021/ja106508f. [DOI] [PMC free article] [PubMed] [Google Scholar]
- 71.Ohe C, Ida Y, Matsumoto S, Sasaki T, Goto Y, Noi A, Tsurumaru T, Itoh K. J Phys Chem B. 2004;108:18081. [Google Scholar]
- 72.Hirose C, Akamatsu N, Domen K. Appl Spectrosc. 1992;46:1051. [Google Scholar]
- 73.Liu J, Conboy JC. Langmuir. 2005;21:9091. doi: 10.1021/la051500e. [DOI] [PubMed] [Google Scholar]
- 74.Harris AL, Chidsey CED, Levinos NJ, Loiacono DN. Chem Phys Lett. 1987;141:350. [Google Scholar]
- 75.Nguyen KT, Le Clair S, Ye SJ, Chen Z. J Phys Chem B. 2009;113:12169. doi: 10.1021/jp904153z. [DOI] [PMC free article] [PubMed] [Google Scholar]
Associated Data
This section collects any data citations, data availability statements, or supplementary materials included in this article.