Abstract
Niemann-Pick type C1 (NPC1) disease is a rare, progressively fatal neurodegenerative disease for which there are no FDA-approved therapies. A major barrier to developing new therapies for this disorder has been the lack of a sensitive and noninvasive diagnostic test. Recently, we demonstrated that two cholesterol oxidation products, specifically cholestane-3β,5α,6β-triol (3β,5α,6β-triol) and 7-ketocholesterol (7-KC), were markedly increased in the plasma of human NPC1 subjects, suggesting a role for these oxysterols in diagnosis of NPC1 disease and evaluation of therapeutics in clinical trials. In the present study, we describe the development of a sensitive and specific LC-MS/MS method for quantifying 3β,5α,6β-triol and 7-KC human plasma after derivatization with N,N-dimethylglycine. We show that dimethylglycine derivatization successfully enhanced the ionization and fragmentation of 3β,5α,6β-triol and 7-KC for mass spectrometric detection of the oxysterol species in human plasma. The oxysterol dimethylglycinates were resolved with high sensitivity and selectivity, and enabled accurate quantification of 3β,5α,6β-triol and 7-KC concentrations in human plasma. The LC-MS/MS assay was able to discriminate with high sensitivity and specificity between control and NPC1 subjects, and offers for the first time a noninvasive, rapid, and highly sensitive method for diagnosis of NPC1 disease.
Keywords: cholesterol, diagnostic tools, liquid chromatography/tandem mass spectrometry, Niemann-Pick disease, oxysterols, neurodegeneration
Niemann-Pick type C (NPC) disease is a rare, primarily pediatric disorder characterized by accumulation of cholesterol and other lipids in the viscera and central nervous system. Approximately 95% of NPC cases are caused by mutations of the NPC1 gene, whereas the remaining 5% are caused by mutations in the NPC2 gene (1, 2). Affected individuals typically present in early childhood with ataxia and progressive impairment of motor and intellectual function and usually die in adolescence. There are currently no FDA-approved therapies for this progressively fatal neurodegenerative disorder. However, a recent controlled study and a series of case reports suggests efficacy for miglustat (3), an inhibitor of glycosphingolipid biosynthesis that is now licensed for use as a disease modifying therapy in multiple countries, including the European Union, Russia, Brazil, Australia, Canada, and Taiwan.
A major barrier to developing new therapies for NPC1 disease has been the lack of an inexpensive and noninvasive diagnostic test. The current diagnostic standard for NPC1 is an invasive skin biopsy and filipin staining, which is only available in one of several specialized clinical laboratories world-wide (4). This approach is confounded by ”variant” NPC cases that have normal filipin staining and, therefore, require another diagnostic method for their detection. Together, the complex and time-consuming processing of the biopsy and lack of sensitivity of the filipin test have contributed to significant diagnostic delays in pediatric cohorts (>4 years) and in adults (>6 years) with NPC1 disease (5, 6). The delay in diagnosis is unfortunate as early intervention is likely to yield the most benefit in this disease.
Loss of NPC1 function results in endolysosomal accumulation of unesterified cholesterol (7, 8), which is the hallmark of NPC disease. In NPC1-deficient cells, cholesterol accumulation is associated with cellular oxidative stress, as evidenced by increased production of reactive oxygen species (ROS), oxidative damage, and a gene expression profile indicative of oxidative stress (9, 10). In the NPC1 mouse model, the oxidative stress is accompanied by elevated ROS and nonenzymatic oxidation of cholesterol in multiple tissues (11–13). These cholesterol oxidation products, specifically cholestane-3β,5α,6β-triol (3β,5α,6β-triol) and 7-ketocholesterol (7-KC), similarly were markedly increased in the plasma of all human NPC1 subjects studied (13). The 3β,5α,6β-triol and 7-KC markers were not increased in the plasma of other neurodegenerative or lysosomal storage diseases, correlated with severity and age of onset of disease, and, in a NPC1 disease model, were reduced in response to therapy (13). These findings indicate that 3β,5α,6β-triol and 7-KC are NPC1 disease-specific biochemical markers and suggest a role for these markers in diagnosis of NPC1 disease and evaluation of therapeutics in clinical trials.
To date, quantification of oxysterols in biological samples has been accomplished principally using GC-MS methods (14–18). Although this technique provides sensitive detection of oxysterols in complex mixtures, GC-MS-based methods are hampered by labor-intensive sample preparation and extraction procedures and by requirement for relatively large plasma volumes. Here, we describe the development of a sensitive and specific LC-MS/MS method capable of quantifying 3β,5α,6β-triol and 7-KC human plasma after derivatization with N,N-dimethylglycine. In this study, we describe a noninvasive, rapid, and highly sensitive method for diagnosis of NPC1 disease and use this assay to discriminate with high sensitivity and specificity between control and NPC1 subjects.
MATERIALS AND METHODS
Chemicals and reagents
3β,5α,6β-triol was obtained from Steraloids, Inc. (Newport, RI). 25,26,26,26,27,27,27-[2H7]cholesterol and 7-ketocholesterol (7-KC) were obtained from Medical Isotopes, Inc. (Pelham, NH). 25,26,26,26,27,27,27-[2H7]7-ketocholesterol ([2H7]7-KC) was obtained from Avanti Polar Lipids (Alabaster, AL). The internal standard 25,26,26,26,27,27,27-[2H7]cholestane-3β,5α,6β-triol ([2H7]3β,5α,6β-triol) was prepared from 25,26,26,26,27,27,27-[2H7]cholesterol based on modified literature methods (19, 20) as described in the supplemental material. Dimethylglycine (DMG) hydrochloride, N-(3-dimethylaminopropyl)-N′-ethylcarbodiimide hydrochloride (EDC), 4-(dimethylamino)pyridine (DMAP), TCA, acetic acid, formic acid, 30% hydrogen peroxide, dichloromethane, sodium hydroxide, dioxane, and chloroform were obtained from Sigma-Aldrich (St. Louis, MO). All HPLC solvents (methanol and acetonitrile) were HPLC grade and were purchased from EMD Chemicals (Gibbstown, NJ).
Sample collection
NPC1 plasma samples were obtained from individuals enrolled in the National Institutes of Health protocol 06-CH-0186 (Evaluation of Biochemical Markers and Clinical Investigation of Niemann-Pick Disease, type C; Principal Investigator: F. D. Porter). This clinical protocol was approved by the National Institute of Child and Human Development Institutional Review Board and the analysis of coded human samples was approved by the Human Studies Committee at Washington University, St. Louis, MO. Deidentified, archived NPC1 plasma samples were also obtained from the University of Oxford, Oxford, UK. Normal plasma was obtained from anonymized residual samples at St. Louis Children's Hospital, St. Louis, MO. Control human plasma, which was used to prepare quality control (QC) samples and standard curves, was obtained commercially from BioChemed Services (Winchester, VA). All plasma samples were collected in ethylenediamine tetraacetic acid dipotassium salt (EDTA-K2) containing tubes.
Stock solution preparation
All the stock solutions (1 mg/ml) were prepared in methanol. A working solution containing 10 μg/ml of 3β,5α,6β-triol and 10 μg/ml of 7-KC was prepared by the dilution of the stock solution with methanol. An internal standard/protein precipitation solution (40 ng/ml of [2H7]3β,5α,6β-triol and 40 ng/ml of [2H7]7-KC) was prepared in methanol.
Sample preparation
Standards, QCs, and blank or study samples (50 μl) were aliquotted into 2 ml polypropylene tubes. Because the LC-MS/MS assay was designed to only measure free or unesterified oxysterols, saponification of plasma samples during sample preparation, which is necessary for measurement of total oxysterol species, was not required. Elimination of this step avoids the known degradation of oxysterols that occur during the alkaline hydrolysis procedure and the possibility for overestimation of total oxysterol concentrations (21). To each tube, internal standard/protein precipitation solution (250 μl) was added except that methanol (250 μl) was used for a blank. Tubes were vortexed, centrifuged for 10 min at 9400 relative centrifugal force, supernatants transferred to clean 1.2 ml Corning polypropylene cluster tubes, and the organic layer was evaporated to dryness under a stream of nitrogen at 35°C in a Multi-Well Evaporation Systems (VWR, West Chester, PA). To the extracts, 20 μl of 0.5 M DMG/2M DMAP in chloroform and 20 uL of 1M EDC in chloroform were added to derivatize the samples. Mixtures were capped, vortexed, and heated for 1 h at 45°C. 20 μl of methanol was added to all the samples to quench the reaction, tubes vortexed briefly and dried with nitrogen stream at 35°C, and reconstituted with 200 μl of methanol-water (4:1).
LC-MS/MS analysis
Sample analysis was performed by HPLC-MS using a Prominence UFLC system (Shimadzu Scientific Instruments, Columbia, MD), and a 4000QTRAP mass spectrometer (Applied Biosystems/MDS Sciex Inc., Ontario, Canada). Data were acquired using Analyst software (v.1.5.1). Mass spectrometry was performed in the positive ionization mode using an atmospheric pressure chemical ionization (APCI) source. The partially purified DMG derivatives prepared from 10 μg of 3β,5α,6β-triol, [2H7]3β,5α,6β-triol, 7-KC, [2H7]7-KC, which were isolated from the organic phase from partition of the crude reaction mixture between diethyl ether and water, were dissolved in 1 ml of methanol-water (4:1). Mass spectrometric parameters were optimized by infusing these solutions into mobile phase flow via a T-union and manually adjusting mass spectrometric settings to achieve maximum response.
HPLC was performed on a Betasil C18, 100mm×2.1mm, 5 μm particle size column (Thermo Electron Corp., Waltham, MA). The mobile phase consisted of solvent A = 0.015% TCA, 0.5% acetic acid in water, and solvent B = 0.015% TCA, 0.5% acetic acid in acetonitrile; the flow rate was 1 ml/min. The step gradient used was as follows: after injection hold 35% solvent B for 0.1 min, 35% to 56% solvent B in 4.5 min, 56% to 80% solvent B in 2 min, 80% to 100% solvent B in 0.1 min, hold 100% solvent B for 0.5 min, 100% to 35% solvent B in 0.1 min, reequilibrate at 35% solvent B for 1.5 min. The total run-time was 8.5 min. A 15 μl sample injection was used. The autosampler wash solvent was methanol.
The optimized heated nebulizer (APCI) and MS/MS conditions were as follows. The source temperature was 500°C. Collision-activated dissociation, ion source gas1 and curtain gases were set at medium, 35 and 20, respectively. Needle current was set at 5.00. The resolutions of Q1 and Q3 were set at unit and unit, respectively. The Scheduled MRMTM was used taking the advantage of well separation of DMG derivatives of 3β,5α,6β-triol and 7-KC. The cycle time and time window were set as 0.2 s and 2 min, respectively. Optimized voltages and retention time are shown in Table 1.
TABLE 1.
Scheduled MRM (positive ion mode) parameters and retention time
| DMG derivative | Mass transition | DP | CE | EP | CXP | Retention time (min)a |
| 3β,5α,6β-triol | 591→104 | 115 | 46 | 10 | 12 | 6.6 |
| 591→488 | 115 | 27 | 10 | 12 | ||
| 7-KC | 486→104 | 95 | 35 | 10 | 12 | 4.7 |
| 486→383 | 95 | 25 | 10 | 12 | ||
| D7-3β,5α,6β-triol | 598→104 | 115 | 46 | 10 | 12 | 6.6 |
| D7-7-KC | 495→383 | 95 | 25 | 10 | 12 | 4.7 |
Retention time may change on a different column.
Standard curves
Because of the endogenous presence of 3β,5α,6β-triol and 7-KC in human plasma, methanol-water (1:1) was used to prepare the calibration standards. Calibration curves were prepared by spiking the 3β,5α,6β-triol and 7-KC working solution into methanol-water (1:1) and plasma, and preparing serial dilutions that yielded eight calibration standards consisting of 3β,5α,6β-triol and 7-KC at 2, 4, 10, 20, 50, 100, 200, and 400 ng/ml. Methanol-water (1:1) served as blank.
QC samples
A pooled-plasma sample was analyzed to establish the mean concentration of endogenous 3β,5α,6β-triol and 7-KC by the LC/MS/MS method. The low, medium, and high plasma quality control (LQC, MQC, and HQC) samples were prepared by spiking 3β,5α,6β-triol and 7-KC working solution to yield endogenous level + 0/0, endogenous level + 150/150, and endogenous level + 300/300 ng/ml, respectively. The lower limit of quantification (LLOQ) sample was prepared in methanol-water (1:1). The endogenous level + 800/800 ng/ml QC, also known as a dilution QC, was at a concentration higher than the upper limit of quantification (ULOQ), and was diluted 1:4 and 1:9 with water prior to extraction.
Linearity, precision, and accuracy
The linearity of the response of each analyte was assessed over their respective calibration range for three analytical batch runs. The precision and accuracy of the assay was determined for each analyte at three QC concentration levels in human plasma over the three batch runs. The dilution QC was used to assess the dilution integration. These QC concentrations included the known fortified levels added to the plasma plus the endogenous concentration of analyte. For each QC concentration, analysis was performed in six replicates on each day except for dilution QCs of which three replicates were prepared. Precision was denoted by a percent coefficient of variance (%CV) calculated by dividing the SD by the mean and then multiplied by 100; (SD/Mean×100). The accuracy was denoted by a percent relative error (%RE), calculated by subtracting the nominal level from the mean amount divided by the theoretical amount and then multiplied by 100; [((Mean−Nominal)/(Nominal))×100].
Sample stability
For each analyte, stability in stock solution and standard matrix, stability to long-term storage and freeze/thaw, stability on the bench-top and in whole blood, and stability in the autosampler were determined as described in the legend for Fig. 5.
Analysis of subject samples
An analytical batch consisted of LQC, MQC, and HQC and calibration standards in duplicate, a blank, a blank with internal standards, and <120 unknown subject samples. The standard curve covered the expected unknown sample concentration range, and the samples that exceeded the highest standard were diluted and reassayed. In the dilution sample reassay, a diluted QC in triplicate was also included in the analytical run. The results of the QC samples provided the basis of accepting or rejecting the run (22). At least two-thirds of QC samples should be within 15% of their respective nominal value. One-third of QC samples may be outside the 15% of their respective nominal value but not all at the same concentration.
Statistics
Results are expressed as mean ± SD or as mean ± SEM. For group comparisons, the statistical significance of differences in mean values was determined by a two-tailed single-factor ANOVA or Student's t-test. To perform correlations, data was analyzed using Pearson and Spearman correlations as appropriate. A p-value of 0.05 or less was considered significant.
RESULTS
Selection of ions for monitoring by mass spectrometry
Initially, mass spectrometric detection of underivatized 3β,5α,6β-triol and 7-KC was investigated using ESI and APCI sources. Both 3β,5α,6β-triol and 7-KC were detected in positive APCI Q1 full mass scan, although only 7-KC was detected as [M+H]+ at m/z 401 in positive ESI Q1 spectrum. The 3β,5α,6β-triol formed [M+H-2H2O]+ at m/z 385 and [M+H-3H2O]+ at m/z 367 in positive APCI Q1 full mass scan. The [M+H]+ at m/z 401 and [M+H-H2O]+ at m/z 383 were observed in positive APCI Q1 spectrum of 7-KC. Multiple fragments in low abundance including loss of water and cleavage of steroid nucleus were observed for both [3β,5α,6β-triol+H-2H2O]+ and [7-KC+H]+ in collisionally activated dissociation. Several most abundant product ions such as [3β,5α,6β-triol +H-3H2O]+, [7-KC+H-H2O]+, and fragments from cleavage of steroid nucleus were chosen to set up multiple reaction monitoring (MRM) mass transitions for detections of 3β,5α,6β-triol and 7-KC. However, low responses of 3β,5α,6β-triol were observed when MRM detections were used even at the optimized collision energy (data not shown).
Oxysterol derivatization with dimethylglycine
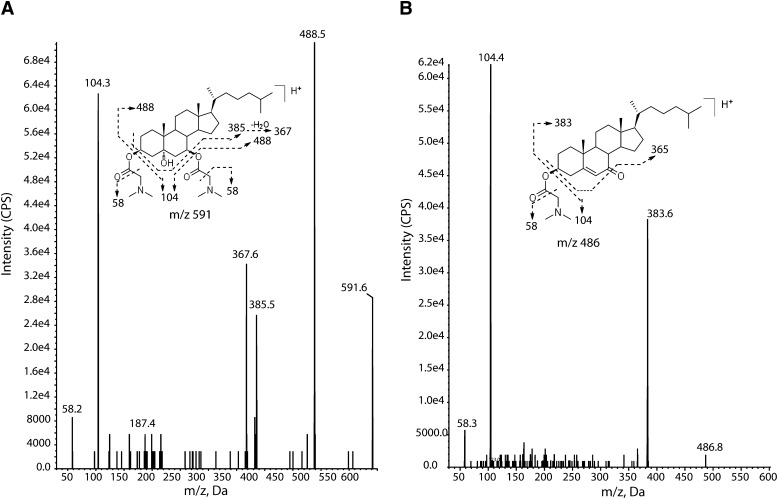
To enhance mass spectrometric detection of 3β,5α,6β-triol and 7-KC, the oxysterols were converted into dimethylglycinates, which we previously have shown greatly improves ionization efficiencies of the oxysterols (23) (Fig. 1 and supplementary Fig. I). The dimethylglycinate derivative of 3β,5α,6β-triol was temporally assigned as cholestane-5α-hydroxy-3β,6β-bis(dimethylglycinate) (CH-DMG2); the 5α-OH moiety of 3β,5α,6β-triol was not esterified likely due to steric hinderance. The 7-KC was converted into 7-ketocholestryl dimethylglycinate (KC-DMG). CH-DMG2 yielded [M+H]+ at m/z 591 and [M+2H]2+ at m/z 296 in ESI mode, the [M+H]+ was 3-fold more abundant than [M+2H]2+, and only [M+H]+ was observed in APCI mode. The [M+H]+ ion of KC-DMG at m/z 486 was observed in both ESI and APCI modes. The [M+H]+ ions of CH-DMG2 and KC-DMG were selected as precursor ions for obtaining MS/MS product-ion spectra. Introduction of the dimethylglycinate -20and improved collision activated dissociation efficiency in Q2 quadrupole, greatly enhancing the overall response for the oxysterols. The fragmentation pathways of the oxysterol-DMG derivatives are proposed in Fig. 1. The loss of DMG via McLafferty rearrangement led to predominant product ions at m/z 104 and 488 in [CH-DMG2+H]+, and m/z 104 and 383 in [KC-DMG+H]+, respectively. Similarly, [D7-CH-DMG2+H]+ yielded the major product ions at m/z 104 and 495, and [D7-KC-DMG+H]+ yielded m/z 104 and 490 ions (spectra not shown), providing support for the proposed fragmentation mechanism. The MRM mass transitions for oxysterol-DMG derivatives were m/z 591→104 (quantifier) and 591→488 (qualifier) for CH-DMG2 and m/z 486→383 (quantifier) and 486→104 (qualifier) for 7-KC-DMG. Because APCI mode was slightly more sensitive than ESI mode and less affected by ion suppression caused by ion pairing reagents in the mobile phase, it was selected as the method for detection of the oxysterol-DMG derivatives.
Fig. 1.
Product ion spectra and collision-activated dissociation of dimythlglycine derivatives of 3β,5α,6β-triol and 7-KC. Spectra for cholestane-5α-hydroxy-3β,6β-bis(dimethylglycinate) (CH-DMG2) (A) and 7-ketocholesterol dimethylglycinate (KC-DMG) (B) are presented. Fragmentation patterns for each analyte are shown above spectra.
Evaluation of efficiency of oxysterol extraction and matrix suppression effects
Recovery of 3β,5α,6β-triol and 7-KC from human plasma was assessed using deuterated internal standards ([2H7]3β,5α,6β-triol and [2H7]7-KC) due to the presence of endogenous 3β,5α,6β-triol and 7-KC in all plasma samples. First, replicates of control plasma, with and without the deuterated oxysterols, were extracted and recoveries of 3β,5α,6β-triol and 7-KC assessed by comparison of the mean peak areas of internal standard and recovery samples (an internal standard was added to the control plasma extracts alone set to provide recovery standard). The recoveries of 3β,5α,6β-triol and 7-KC following protein precipitation with methanol and derivatization were 89% (2.04%CV, n = 3) and 90% (1.54%CV, n = 3), respectively. Because LC-MS/MS-based assays can also be affected by matrix ion suppression effects related to variation in ionization response due to matrix components coeluting with the analyte, we assessed the suppression coefficient for 3β,5α,6β-triol and 7-KC by calculating the ratio of the average peak area response for the deuterated standards spiked in the recovery sample to the average peak area response in methanol-water (1:1) samples. The suppression coefficients of 3β,5α,6β-triol and 7-KC were 0.945 and 0.915, respectively, indicating similar matrix effects in plasma and nonbiological matrix.
Calibration curves
Because of the endogenous presence of 3β,5α,6β-triol and 7-KC in human plasma, calibration standards were prepared in methanol-water (1:1), in addition to human plasma. Methanol-water mixture was selected as a standard matrix because it allowed use of a simple and well-controlled preparation method, demonstrated excellent linearity and repeatability, and minimized nonspecific binding of the oxysterols. The slopes of the calibration curves were shown to be nearly identical in methanol-water and plasma (Table 2). The intercept of the plasma calibration curve was larger than zero due to the endogenous oxysterol concentrations, whereas the intercept of the methanol-water calibration curve passed close to zero. The near identity in the slopes between the calibration curves indicated that methanol-water (1:1) was a suitable surrogate matrix.
TABLE 2.
Characteristics of calibration regression line data prepared in the methanol-water (1:1) and in plasma
| Analyte | Matrix | Slope | Intercept | R2 |
| 3β,5α,6β-triol | Methanol-water (1:1) | 0.00563 | 0.000856 | 0.9990 |
| Plasma | 0.00534 | 0.00686 | 0.9946 | |
| 7-KC | Methanol-water (1:1) | 0.00383 | 0.000302 | 0.9990 |
| Plasma | 0.00389 | 0.00777 | 0.9940 |
Selectivity of the method
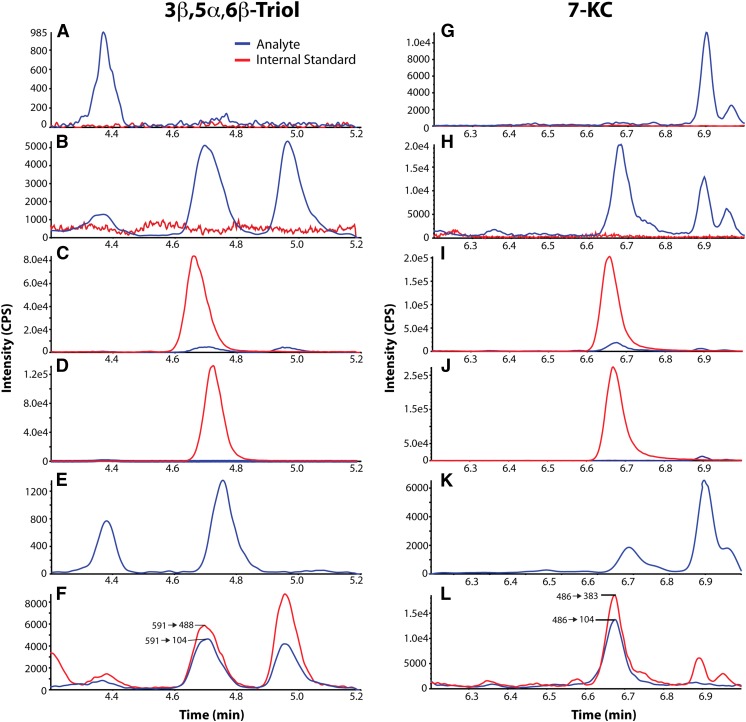
Selectivity is the ability of a bioanalytical method to distinguish between analyte and interference in the matrix. To ascertain the selectivity of the method, we analyzed methanol-water (1:1) blanks with and without internal standard and six independent human plasma samples. No significant interference peaks were found in the methanol-water or plasma samples at the retention times or in the MRM channels for either the analytes or the internal standard (Fig. 2A, G). Typical chromatograms of human plasma in the absence (Fig. 2B, H) and presence of internal standards (Fig. 2C, I) are shown. Endogenous 3β,5α,6β-triol and 7-KC were present in all human plasma examined. No significant interfering peaks from the methanol-water samples containing internal standards were observed at the retention times and in the MRM channels for the analytes (Fig. 2D, J). Chromatograms of the second mass transitions of 591→488 (3β,5α,6β-triol) and 486→104 (7-KC) were used for confirmation purposes (Fig. 2F, L). The selectivity was further confirmed by determining the branching ratio of the mass transitions from six individual blank plasma samples within 10% of the value of the calibrator (prepared in methanol-water, 1:1). The branching ratio is the ratio of peak areas of two mass transitions of 3β,5α,6β-triol (591→104/591→488) and 7-KC (486→383/486→104), and was used to assure specificity of the detection (24–26). The branching ratios of six individual blank plasma samples were compared with the ratios of the same transitions in the ULOQ calibrator containing 400 ng/ml 3β,5α,6β-triol and 7-KC (supplementary Table I).
Fig. 2.
Chromatograms of oxysterol dimethylglycinates. Chromatograms are shown for 3β,5α,6β-triol with retention time of 4.7 min (A–F) and 7-KC with retention time of 6.6 min (G–L), with analytes in blue and internal standards in red. Selected chromatograms are shown for blank (A, G), control plasma without internal standard (B, H), control plasma with internal standard (C, I), blank with internal standard (D, J), LLOQ (E, K), and control plasma in 2 MRM transitions (F, L).
Sensitivity of the method
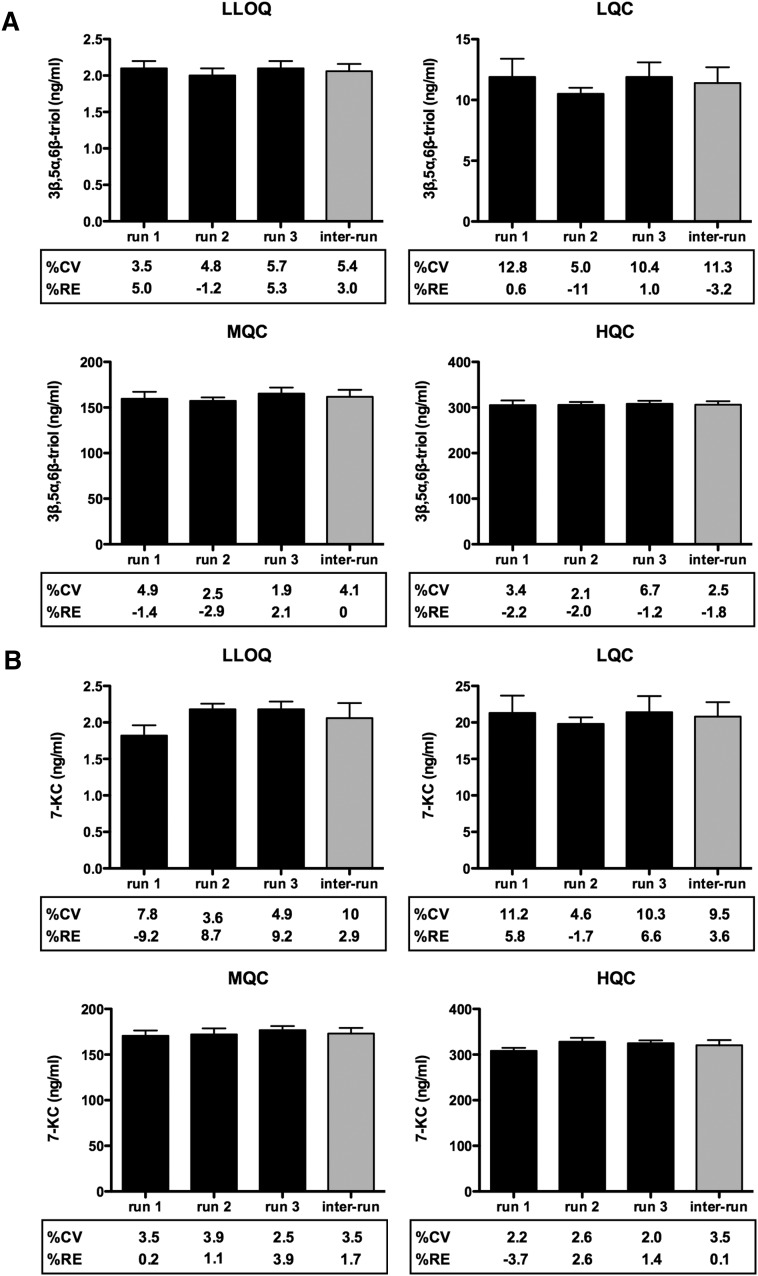
The sensitivity of the assay, as defined by the LLOQ, was determined for both 3β,5α,6β-triol and 7-KC using methanol-water (1:1) samples at 2 ng/ml, the lowest concentration in the standard curve. Samples were processed and analyzed with a calibration curve and QC samples. At the LLOQ, the intra-run precision (CV) was <8% for 3β,5α,6β-triol and 7-KC, and the intra-run accuracies (RE, relative error) was within ± 10% for 3β,5α,6β-triol and 7-KC (Fig. 3A, B). A typical MRM chromatogram at the LLOQ concentration is shown in Fig. 2E and K.
Fig. 3.
Intra- and inter-assay accuracy and precision of measurement of plasma 3β,5α,6β-triol and 7-KC. Assay accuracy and precision was determined for (A) 3β,5α,6β-triol and (B) 7-KC measurements at LLOQ, LQC, MQC, and HQC. %CV and RE were based on three independent runs (six replicates/run) and are shown below each graph.
Precision and accuracy of the method
The accuracy and precision of the plasma method were assessed by analyzing QC samples along with a calibration curve on three different days. The calibration curve consisted of eight standards of different concentrations, each in duplicate, ranging from 2 to 400 ng/ml of 3β,5α,6β-triol and 7-KC in methanol-water (1:1). Excellent results were obtained for the calibration curves as the deviations of the back-calculated concentrations from their nominal values were within 15% for all the calibration standards in the 3 days of validation. All the QC samples were prepared in human plasma, and the endogenous levels of 3β,5α,6β-triol and 7-KC were determined by mean of multiple replicates (n = 12). The endogenous levels were used to calculate the nominal concentrations of the spiked and/or diluted QCs. The results of the QC samples in the three validation runs demonstrate intra-run precision (CV) <15% and intra-run accuracies (RE) <15% for 3β,5α,6β-triol and 7-KC, and inter-run precision (CV) <15% and inter-run accuracy <15% for 3β,5α,6β-triol and 7-KC (Fig. 3). The accuracies of dilution integration samples are shown in supplementary Table II. Because sample carryover could adversely affect accuracy of an assay, we evaluated carryover by injecting a blank sample immediately following the highest standard (400 ng/ml for 3β,5α,6β-triol and 7-KC). No carryover or interference was observed in the region of interest (not shown).
Sample stability
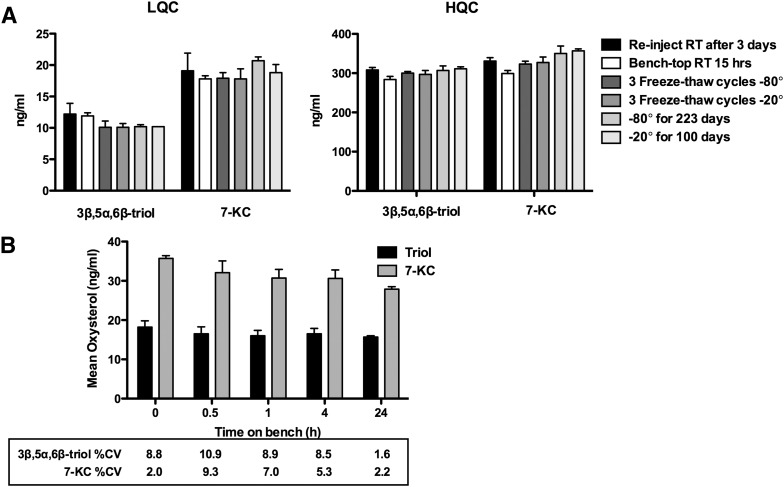
3β,5α,6β-triol and 7-KC were stable in methanol stock solution and in standard matix (methanol-water (1:1)) for up to 24 h at room temperature and for 42 days at -20°C (supplementary Table III). Stability of 3β,5α,6β-triol and 7-KC in the matrix of interest was evaluated under a variety of conditions to establish lengths of storage and sample processing conditions. The bench-top stability study showed that the 3β,5α,6β-triol and 7-KC were stable in human plasma for 15 h at room temperature, and for 223 days at −80°C and 100 days at −20°C (Fig. 4A). For processed samples (autosampler stability), the analytes were stable for 3 days at room temperature. The 3β,5α,6β-triol and 7-KC were stable in human whole blood at room temperature for 24 and 4 h, respectively (Fig. 4B).
Fig. 4.
Stability of 3β,5α,6β-triol and 7-KC. A: Stability of oxysterols in LQC and HQC plasma and processed samples under a variety of conditions. B: Stability of oxysterols in whole blood at room temperature. Each data point represents n = 3–6 replicates.
Measurement of 3β,5α,6β-triol and 7-KC in plasma from human subjects
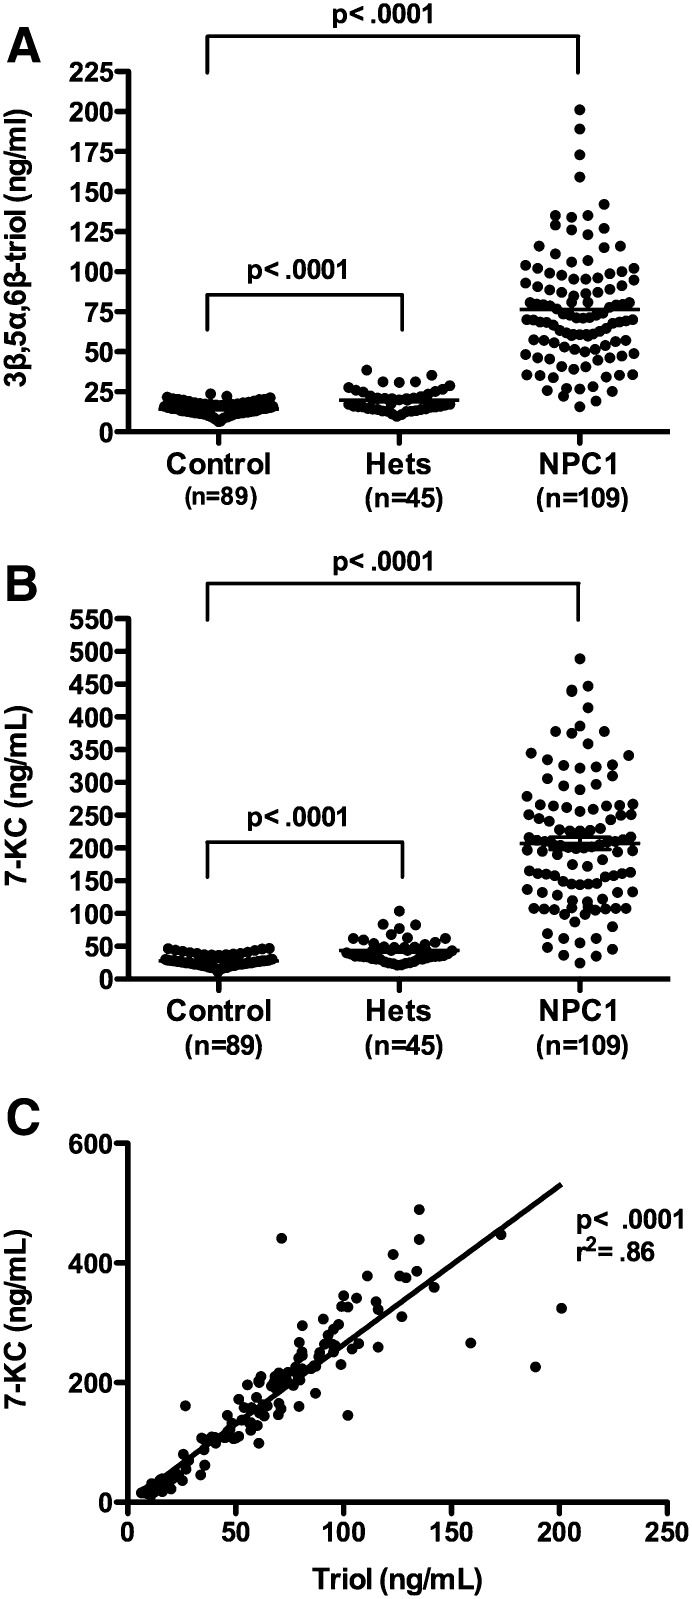
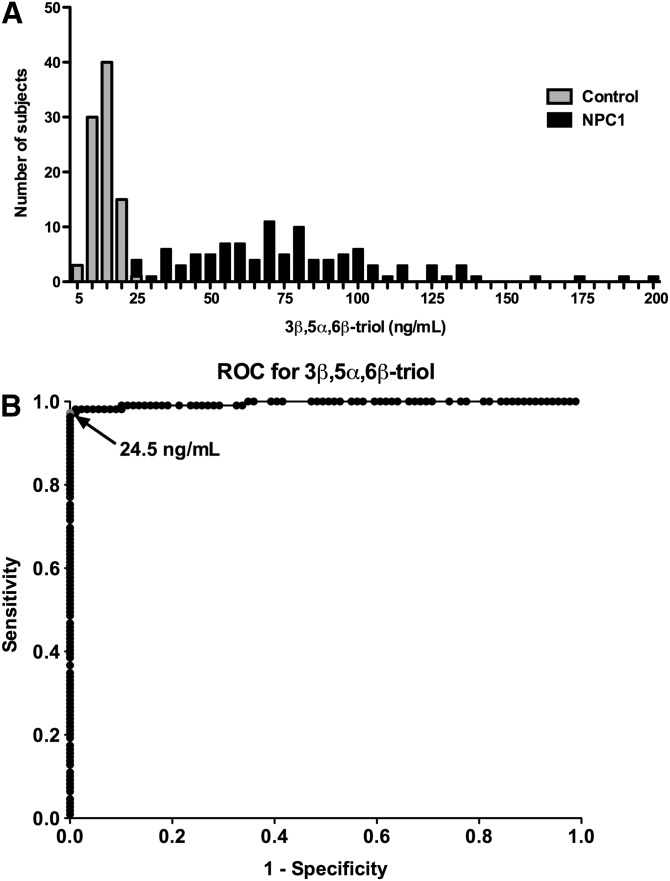
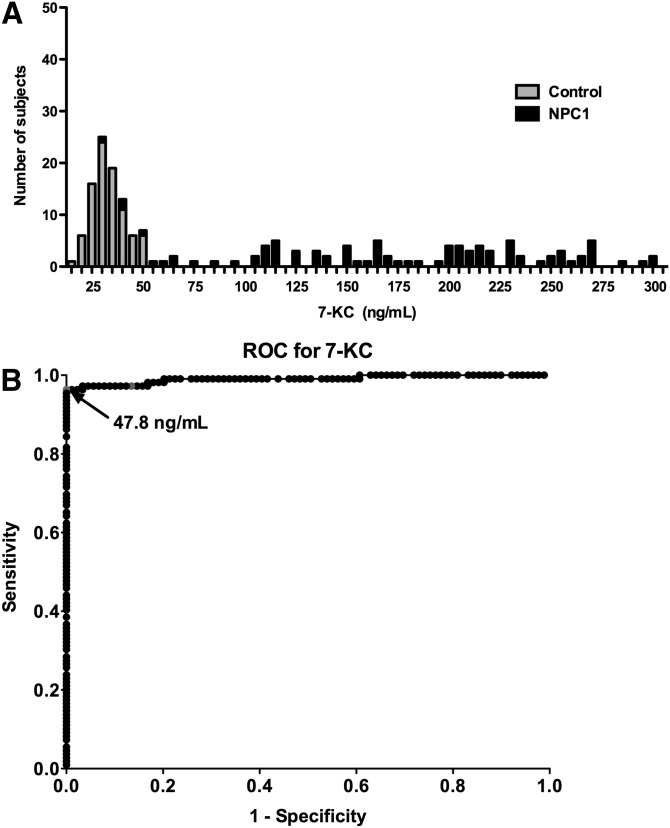
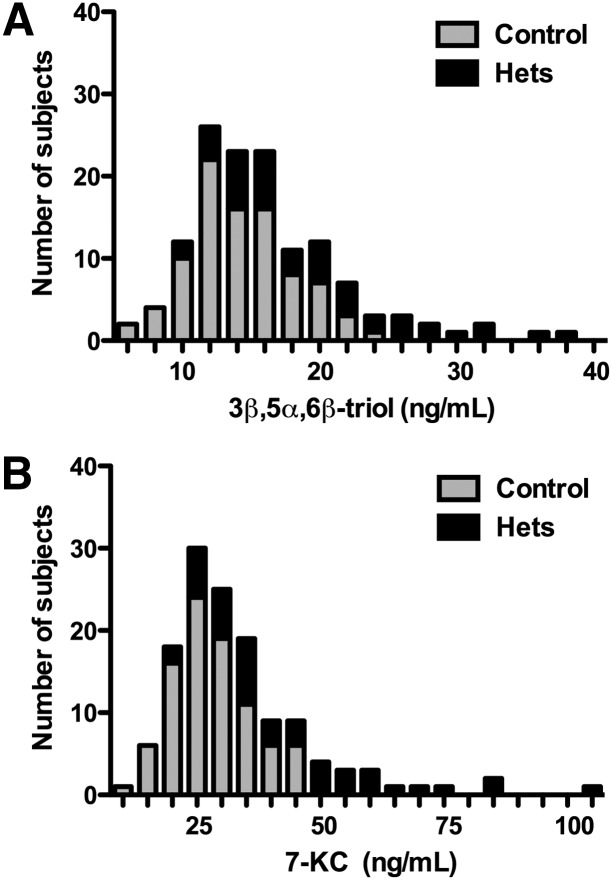
The LC-MS/MS assay was used to measure the free or unesterified 3β,5α,6β-triol and 7-KC concentrations in plasma samples from 109 NPC1 subjects (0–47 years; mean age 12 years), 89 controls (1–64 years; mean age 22 years) and 45 obligate heterozygotes (parents of NPC1 subjects) or known sibling carriers (5–77 years; mean age 40 years) (Fig. 5A, B). The 3β,5α,6β-triol (control mean 14.6 ng/ml, range 7.42–21.2 ng/ml; NPC1 mean 80.3 ng/ml; range 15.1–201 ng/ml; P < 0.001) and 7-KC (control mean 29.0 ng/ml, range 11.4–44.4 ng/ml; NPC1 mean 229 ng/ml, range 24.7-489 ng/ml; P < 0.001) plasma concentrations were significantly elevated in the NPC1 subjects, consistent with our previous findings (13). The plasma 3β,5α,6β-triol and 7-KC were highly correlated (Fig. 5C; r2 = 0.86), indicating that production of these oxysterols in vivo likely involves a common process (13). To assess the ability of the 3β,5α,6β-triol and 7-KC assays to discriminate NPC1 subjects from controls, oxysterol concentrations in these groups were compared using histogram plots (Figs. 6A and Fig. 7A) and receiver-operator characteristic (ROC) analysis was performed. ROC curves demonstrated that the area under the curve for 3β,5α,6β-triol was 0.9958 (Fig. 6B) and for 7-KC was 0.9907 (Fig. 7B). For 3β,5α,6β-triol, a cut-off value of 24.5 ng/ml yields a sensitivity of 97.3% and specificity of 100% to discriminate between NPC1 subjects and controls. Similarly, for 7-KC, a cut-off value of 47.5 ng/ml yields a sensitivity of 96.4% and specificity of 100% to discriminate between NPC1 subjects and controls. These oxysterol disease markers were also significantly elevated in NPC1 heterozygotes (3β,5α,6β-triol mean 19.7 ng/ml, range 9.61–38.6; 7-KC mean 43.8 ng/ml, 21.2–83.7 ng/ml), as compared with controls (Fig. 5). Twenty-five percent of the NPC1 carriers demonstrated plasma 3β,5α,6β-triol concentrations above the 24.5 ng/ml cut-off, and 36% of the NPC1 carriers demonstrated plasma 7-KC concentrations above the 47.5 ng/ml cut-off (Fig. 8).
Fig. 5.
Plasma 3β,5α,6β-triol and 7-KC concentrations in human subjects. A: 3β,5α,6β-triol and (B) 7-KC concentrations in plasma samples in control (n = 89), NPC1 heterozygote (n = 45), and NPC1 subjects. (n = 109). Data are presented as mean ± SEM. * P < 0.001 for heterozygotes versus controls and for NPC1 versus controls. C: Correlation of plasma 3β,5α,6β-triol and 7-KC concentrations. 7-KC concentrations are shown as a function of 3β,5α,6β-triol concentrations for all subjects. R2 = 0.86, P < 0.0001.
Fig. 6.
Sensitivity and specificity of plasma 3β,5α,6β-triol assay. A: Histogram plots for control and NPC1 subjects. B: ROC curve demonstrates 0.9958 area under the curve for 3β,5α,6β-triol assay. Using cut-off value of 24.5 ng/ml, sensitivity is 97.3% and specificity is 100%.
Fig. 7.
Sensitivity and specificity of plasma 7-KC assay. A: Histogram plots for control and NPC1 subjects. B: ROC curve demonstrates 0.9907 area under the curve for 7-KC assay. Using cut-off value of 47.5 ng/ml, sensitivity is 96.4% and specificity is 100%.
Fig. 8.
Comparison of plasma 3β,5α,6β-triol and 7-KC concentrations in NPC1 heterozygotes. A: Histogram plots for plasma 3β,5α,6β-triol concentrations for control and NPC1 subjects. B: Histogram plots for plasma 7-KC concentrations for control and NPC1 subjects.
DISCUSSION
The nonenzymatically formed cholesterol oxidation products, 3β,5α,6β-triol and 7-KC, have recently been shown to be diagnostic markers for NPC1 disease (13). The goal of this study was to develop a sensitive, high-throughput method for detection of these metabolites in human plasma that could be readily implemented in a clinical laboratory setting. We show that chemical derivatization with dimethylglycine successfully enhanced the ionization and fragmentation of 3β,5α,6β-triol and 7-KC for mass spectrometric detection of the oxysterol species in human plasma (23). The LC-MS/MS method successfully resolved the oxysterol dimethylglycinates with high sensitivity and selectivity, and enabled accurate quantification of 3β,5α,6β-triol and 7-KC concentrations in human plasma. Examination of plasma from control and NPC1 subjects confirmed our earlier report of elevated plasma oxysterols in NPC1 disease and demonstrated that this method could discriminate between control and NPC1 subjects with high sensitivity and specificity. This method provides a robust platform for clinical assessment of the oxysterol markers and offers for the first time a noninvasive, rapid, and highly sensitive method for diagnosis of NPC1 disease.
The current diagnostic standard for NPC1 disease is an invasive skin biopsy followed by filipin staining of the cultured fibroblasts for cholesterol (4). The filipin assay, however, has several drawbacks. The assay is performed in only a few specialized centers world-wide and typically requires several weeks from time of biopsy to report results. Moreover, the filipin test has limited sensitivity, is frequently indeterminate in NPC1 subjects with less severe disease, and may be confounded by NPC1 carriers who test positive. To improve measurement of cholesterol accumulation in cells, quantitative microscopy has been proposed as a diagnostic tool, but this approach similarly is unable to discriminate some classic and variant NPC1 cases from normal controls (27). Routine DNA sequence analysis, which is used to confirm filipin test results, is more sensitive, but in both our and others’ experience, fails to identify mutations on both alleles in 10–15% of NPC1 cases (28). Because there is no dominant genotype in NPC1 disease and there are >300 private mutations in the NPC1 locus, mutation analysis alone may be unable to distinguish between disease-causing alleles and polymorphisms. By contrast, the LC-MS/MS assay for the 3β,5α,6β-triol and 7-KC species provides a functional readout of the NPC1 cellular phenotype (13) with far higher sensitivity and specificity (for 3β,5α,6β-triol, 97.3% sensitivity and 100% specificity) than is afforded by the filipin assay. The oxysterol analytes do not require specialized collection tubes (e.g., routine EDTA chelation is sufficient), are stable during processing, and in samples stored at −20°C, can be performed with small amounts of plasma (<50 μl), and require limited sample processing, all characteristics that will facilitate implementation of the LC-MS/MS oxysterol assay in clinical laboratory settings.
The availability of a simple, noninvasive, and quantitative test has profound implications for diagnosis and treatment of NPC1 disease. The oxysterol assay will enable more widespread testing in populations enriched for NPC1 disease, such as neonates with jaundice or adolescents and adults with psychiatric disease and neurological symptoms, patient groups in which the prevalence of NPC1 disease may approach 8% (29, 30). Because the clinical presentation of NPC1 disease is similar to a number of other lysosomal storage disorders, measurement of plasma oxysterols will likewise provide a new diagnostic tool to clinicians to exclude the diagnosis of NPC1 disease in patients with enlarged livers or spleens or with a suspected storage disorder. The oxysterol assay may also prove useful for monitoring response to therapy by providing quantitative biomarkers that could serve as surrogate endpoints in clinical trials (13). Finally, the LC-MS/MS-based assay could provide a platform for newborn screening. The feasibility of screening newborns for elevated oxysterol levels is supported by the demonstrated stability of the oxysterol analytes, the sensitivity for analyte detection in small blood volumes, and the stringent ROC curves. Early detection of NPC1 disease by an oxysterol newborn screening test would facilitate treatment in presymptomatic NPC1 subjects, individuals most likely to benefit from medical intervention (6). Moreover, newborn screening of the general population will also provide, for the first time, the true incidence of NPC1 disease, which has likely been underestimated due to the difficulty in establishing a diagnosis.
Plasma oxysterol concentrations were elevated not only in NPC1 subjects but also in nonaffected NPC1 heterozygotes. Despite considerable overlap in oxysterol values between heterozygotes and controls, we found that mean 3β,5α,6β-triol and 7-KC plasma concentrations in NPC1 heterozygotes were increased approximately 1.3- and 1.6-fold as compared with control subjects, consistent with our earlier findings (13). Nonetheless, a significant proportion of the heterozygotes demonstrated plasma 3β,5α,6β-triol and 7-KC concentrations that exceeded the upper limits of the normal range, indicating that the oxysterol assay is able to discriminate a subset of NPC1 carriers from the general population. Because cholesterol oxidation products, such as 3β,5α,6β-triol and 7-KC, result from excess tissue oxidative stress, elevated circulating oxysterol concentrations may reflect increased susceptibility for oxidative stress-related disease (e.g., atherosclerosis or neurodegeneration) and in theory, could identify at-risk individuals. Based on a calculated NPC1 mutation carrier frequency of 0.6%, we estimate that the subset of NPC1 heterozygotes with elevated oxysterol levels may represent up to 0.125% of the general population and thus must be taken into consideration when setting reference values and interpreting assay results. In populations with increased incidence of NPC1 disease (e.g., neonates with jaundice, 5–8%), the false-positive rate due to this heterozygote subset is negligible, and accordingly, the positive predictive value of the oxysterol test is >97%. On the other hand, population-based screening using a cut-off value for 3β,5α,6β-triol of 24.5 ng/ml may be more problematic as the positive predictive value is <1%. This can be readily addressed by raising the cut-off value to 38 ng/ml, which effectively lowers the sensitivity to 87.6% but increases the positive predictive value to 100%. The approximate 10% NPC1 cases in the overlap zone could then be detected using a secondary screen such as another NPC1 disease-specific biomarker or sequencing of the NPC1 gene.
In summary, we describe the development of a sensitive and specific LC-MS/MS method capable of quantifying 3β,5α,6β-triol and 7-KC human plasma. Here, this assay is used to evaluate the intra- and inter-subject variability of these oxysterol species in control, heterozygote, and NPC1 subjects, and validate our earlier findings of increased plasma 3β,5α,6β-triol and 7-KC concentrations in NPC1 subjects. Measurement of plasma oxysterols offers the first noninvasive, quantitative, and highly sensitive method for detection of NPC1 disease and, we believe, will replace the filipin test as the diagnostic standard for NPC1 disease. The LC-MS/MS assay also provides a conceptual basis to screen newborns for NPC1 disease and has the potential to transform current approaches to diagnosis and treatment of the disorder.
Supplementary Material
Acknowledgments
The authors thank Dr. Doug Covey for providing laboratory equipment and space for chemical synthesis and Sarah Gale for assistance in preparation of figures.
Footnotes
Abbreviations:
- 3β,5α,6β-triol
- cholestan-3β,5α,6β-triol
- 7-KC
- 7-ketocholesterol
- APCI
- atmospheric pressure chemical ionization
- CH-DMG2
- cholestane-5α-hydroxy-3β,6β-bis(dimethylglycinate)
- 13CNMR
- carbon 13 nuclear magnetic resonance; CV, coefficient of variance
- DMAP
- 4-(dimethylamino)pyridine
- DMG
- dimethylglycine
- EDC
- 1-ethyl-3-(3-dimethylaminopropyl) carbodiimide
- [2H7]3β,5α,6β-triol
- 25,26,26,26,27,27,27-D7-cholestane-3β,5α,6β-triol
- [2H7]7-KC
- 25,26,26,26,27,27,27-D7-7-ketocholesterol
- 1HNMR
- proton nuclear magnetic resonance
- HQC
- high quality control
- KC-DMG
- 7-ketocholesteryl dimethylglycinate
- K2EDTA
- ethylenediamine-tetraacetic acid dipotassium salt
- LLOQ
- lower limit of quantification
- LQC
- low quality control
- MQC
- medium quality control
- MRM
- multiple reaction monitoring
- NPC
- Neimann Pick Type C
- PPV
- positive predictive value
- QC
- quality control
- RE
- relative error
- ROC
- receiver-operator characteristic
- ROS
- reactive oxygen species
- ULOQ
- upper limit of quantification
This work was performed in the Metabolomics Facility at Washington University. The authors received support from the Washington University Specialized Centers of Clinically Oriented Research grant P50 HL083762 (D.S.O.), Dana's Angels Research Trust (D.S.O. and N.Y.), Ara Parseghian Medical Research Foundation (D.S.O. and N.Y.), Medical Research Council, UK (A.S.), and Action Medical Research, UK (D.T.V.). This study was also supported by the intramural research program of the Eunice Kennedy Shriver National Institute of Child Health and Human Development (F.D.P.) and a Bench to Bedside award from the Office of Rare Diseases (F.D.P. and D.S.O.).
The online version of this article (available at http://www.jlr.org) contains supplementary data in the form of one figure and three tables.
REFERENCES
- 1.Carstea E. D., Morris J. A., Coleman K. G., Loftus S. K., Zhang D., Cummings C., Gu J., Rosenfeld M. A., Pavan W. J., Krizman D. B., et al. 1997. Niemann-Pick C1 disease gene: homology to mediators of cholesterol homeostasis. Science. 277: 228–231. [DOI] [PubMed] [Google Scholar]
- 2.Naureckiene S., Sleat D. E., Lackland H., Fensom A., Vanier M. T., Wattiaux R., Jadot M., Lobel P. 2000. Identification of HE1 as the second gene of Niemann-Pick C disease. Science. 290: 2298–2301. [DOI] [PubMed] [Google Scholar]
- 3.Patterson M. C., Vecchio D., Prady H., Abel L., Wraith J. E. 2007. Miglustat for treatment of Niemann-Pick C disease: a randomised controlled study. Lancet Neurol. 6: 765–772. [DOI] [PubMed] [Google Scholar]
- 4.Wraith J. E., Baumgartner M. R., Bembi B., Covanis A., Levade T., Mengel E., Pineda M., Sedel F., Topcu M., Vanier M. T., et al. 2009. Recommendations on the diagnosis and management of Niemann-Pick disease type C. Mol. Genet. Metab. 98: 152–165. [DOI] [PubMed] [Google Scholar]
- 5.Sevin M., Lesca G., Baumann N., Millat G., Lyon-Caen O., Vanier M. T., Sedel F. 2007. The adult form of Niemann-Pick disease type C. Brain. 130: 120–133. [DOI] [PubMed] [Google Scholar]
- 6.Yanjanin N. M., Velez J. I., Gropman A., King K., Bianconi S. E., Conley S. K., Brewer C. C., Solomon B., Pavan W. J., Arcos-Burgos M., et al. 2010. Linear clinical progression, independent of age of onset, in Niemann-Pick disease, type C. Am. J. Med. Genet. B. Neuropsychiatr. Genet. 153B: 132–140. [DOI] [PMC free article] [PubMed] [Google Scholar]
- 7.Ory D. S. 2000. Niemann-Pick type C disease: a disorder of cellular cholesterol trafficking. Biochim. Biophys. Acta. 1529: 331–339. [DOI] [PubMed] [Google Scholar]
- 8.Sturley S. L., Patterson M. C., Pentchev P. 2009. Unraveling the sterol-trafficking defect in Niemann-Pick C disease. Proc. Natl. Acad. Sci. USA. 106: 2093–2094. [DOI] [PMC free article] [PubMed] [Google Scholar]
- 9.Reddy J. V., Ganley I. G., Pfeffer S. R. 2006. Clues to neuro-degeneration in Niemann-Pick Type C disease from global gene expression profiling. PLoS ONE. 1: e19. [DOI] [PMC free article] [PubMed] [Google Scholar]
- 10.Zampieri S., Mellon S. H., Butters T. D., Nevyjel M., Covey D. F., Bembi B., Dardis A. 2009. Oxidative stress in NPC1 deficient cells: protective effect of allopregnanolone. J. Cell. Mol. Med. 13: 3786–3796. [DOI] [PMC free article] [PubMed] [Google Scholar]
- 11.Tint G., Pentchev P., Xu G., Batta A., Shiefer S., Salen G., Honda A. 1998. Cholesterol and oxygenated cholesterol concentrations are markedly elevated in peripheral tissue but not in brain from mice with Niemann-Pick type C phenotype. J. Inherit. Metab. Dis. 21: 853–863. [DOI] [PubMed] [Google Scholar]
- 12.Zhang J. R., Coleman T., Langmade S. J., Scherrer D. E., Lane L., Lanier M. H., Feng C., Sands M. S., Schaffer J. E., Semenkovich C. F., et al. 2008. Niemann-Pick C1 protects against atherosclerosis in mice via regulation of macrophage intracellular cholesterol trafficking. J. Clin. Invest. 118: 2281–2290. [DOI] [PMC free article] [PubMed] [Google Scholar]
- 13.Porter F. D., Scherrer D. E., Lanier M. H., Langmade S. J., Molugu V., Gale S. E., Olzeski D., Sidhu R., Dietzen D. J., Fu R., Wassif C. A., Yanjanin N. M., Marso S. P., House J., Vite C., Schaffer J. E., Ory D. S. 2010. Cholesterol oxidation products are sensitive and specific blood-based biomarkers for Niemann-Pick C1 disease. Sci. Transl. Med. 2: 56ra81. [DOI] [PMC free article] [PubMed] [Google Scholar]
- 14.Bjorkhem I., Breuer O., Angelin B., Wikstrom S. A. 1988. Assay of unesterified cholesterol-5,6-epoxide in human serum by isotope dilution mass spectrometry. Levels in the healthy state and in hyperlipoproteinemia. J. Lipid Res. 29: 1031–1038. [PubMed] [Google Scholar]
- 15.Breuer O., Bjorkhem I. 1990. Simultaneous quantification of several cholesterol autoxidation and monohydroxylation products by isotope-dilution mass spectrometry. Steroids. 55: 185–192. [DOI] [PubMed] [Google Scholar]
- 16.Dzeletovic S., Breuer O., Lund E., Diczfalusy U. 1995. Determination of cholesterol oxidation products in human plasma by isotope dilution-mass spectrometry. Anal. Biochem. 225: 73–80. [DOI] [PubMed] [Google Scholar]
- 17.Gruenke L. D., Craig J. C., Petrakis N. L., Lyon M. B. 1987. Analysis of cholesterol, cholesterol-5,6-epoxides and cholestane-3 beta,5 alpha,6 beta-triol in nipple aspirates of human breast fluid by gas chromatography/mass spectrometry. Biomed. Environ. Mass Spectrom. 14: 335–338. [DOI] [PubMed] [Google Scholar]
- 18.Menendez-Carreno M., Garcia-Herreros C., Astiasaran I., Ansorena D. 2008. Validation of a gas chromatography-mass spectrometry method for the analysis of sterol oxidation products in serum. J. Chromatogr. B Analyt. Technol. Biomed. Life Sci. 864: 61–68. [DOI] [PubMed] [Google Scholar]
- 19.Fieser L. F., Rajagopalan S. 1949. Selective oxidation with N-bromosuccinimide. II. Cholestane-3β,5α,6β-triol. J. Am. Chem. Soc. 71: 3938–3941. [Google Scholar]
- 20.Li S., Pang J., Wilson W. K., Schroepfer G. J., Jr 1999. Sterol synthesis. Preparation and characterization of fluorinated and deuterated analogs of oxygenated derivatives of cholesterol. Chem. Phys. Lipids. 99: 33–71. [DOI] [PubMed] [Google Scholar]
- 21.Schroepfer G. J., Jr 2000. Oxysterols: modulators of cholesterol metabolism and other processes. Physiol. Rev. 80: 361–554. [DOI] [PubMed] [Google Scholar]
- 22.US Food and Drug Administration. 2001. Guidance for Industry: Bioanalytical Method Validation. In Fed. Reg. 66(100) (2001) 28526. [Google Scholar]
- 23.Jiang X., Ory D. S., Han X. 2007. Characterization of oxysterols by electrospray ionization tandem mass spectrometry after one-step derivatization with dimethylglycine. Rapid Commun. Mass Spectrom. 21: 141–152. [DOI] [PMC free article] [PubMed] [Google Scholar]
- 24.Kaufmann A., Butcher P., Maden K., Widmer M., Giles K., Uria D. 2009. Are liquid chromatography/electrospray tandem quadrupole fragmentation ratios unequivocal confirmation criteria? Rapid Commun. Mass Spectrom. 23: 985–998. [DOI] [PubMed] [Google Scholar]
- 25.Kushnir M. M., Rockwood A. L., Nelson G. J., Yue B., Urry F. M. 2005. Assessing analytical specificity in quantitative analysis using tandem mass spectrometry. Clin. Biochem. 38: 319–327. [DOI] [PubMed] [Google Scholar]
- 26.Vogeser M., Seger C. 2010. Pitfalls associated with the use of liquid chromatography-tandem mass spectrometry in the clinical laboratory. Clin. Chem. 56: 1234–1244. [DOI] [PubMed] [Google Scholar]
- 27.Tängemo C., Weber D., Theiss S., Mengel E., Runz H. 2011. Niemann-Pick Type C disease: characterizing lipid levels in patients with variant lysosomal cholesterol storage. J. Lipid Res. 52: 813–825. [DOI] [PMC free article] [PubMed] [Google Scholar]
- 28.Park W. D., O'Brien J. F., Lundquist P. A., Kraft D. L., Vockley C. W., Karnes P. S., Patterson M. C., Snow K. 2003. Identification of 58 novel mutations in Niemann-Pick disease type C: correlation with biochemical phenotype and importance of PTC1-like domains in NPC1. Hum. Mutat. 22: 313–325. [DOI] [PubMed] [Google Scholar]
- 29.Yerushalmi B., Sokol R. J., Narkewicz M. R., Smith D., Ashmead J. W., Wenger D. A. 2002. Niemann-pick disease type C in neonatal cholestasis at a North American Center. J. Pediatr. Gastroenterol. Nutr. 35: 44–50. [DOI] [PubMed] [Google Scholar]
- 30.Bauer P., Boettcher T., Meyer W., Martus P., Weiss S., Oheim R., Heinze K., Wittstock M., Rolfs A. 2008. Niemann-Pick type C disease (NP-C) is a considerable diagnosis in juvenile and adult-onset psychiatric disorders. In: Annual Meeting of the American Society of Human Genetics (ASH-G), Philadelphia. [Google Scholar]
Associated Data
This section collects any data citations, data availability statements, or supplementary materials included in this article.


