

Abstract
The retina uses two photoreceptor types to encode the wide range of light intensities in the natural environment. Rods mediate vision in dim light, whereas cones mediate vision in bright light. Mouse photoreceptors include only 3% cones, and the majority of these coexpress two opsins (short- and middle-wavelength sensitive, S and M), with peak sensitivity to either ultraviolet (360 nm) or green light (508 nm). The M/S-opsin ratio varies across the retina but has not been characterized functionally, preventing quantitative study of cone-mediated vision. Furthermore, physiological and behavioral measurements suggested that mouse retina supports relatively slow temporal processing (peak sensitivity, ∼2–5 Hz) compared to primates; however, past studies used visible wavelengths that are inefficient at stimulating mouse S-opsin. Here, we measured the M/S-opsin expression ratio across the mouse retina, as reflected by ganglion cell responses in vitro, and probed cone-mediated ganglion cell temporal properties using ultraviolet light stimulation and linear systems analysis. From recordings in mice lacking rod function (Gnat1−/−, Rho−/−), we estimate ∼70% M-opsin expression in far dorsal retina, dropping to <5% M-opsin expression throughout ventral retina. In mice lacking cone function (Gnat2cpfl3), light-adapted rod-mediated responses peaked at ∼5–7 Hz. In wild-type mice, cone-mediated responses peaked at ∼10 Hz, with substantial responsiveness up to ∼30 Hz. Therefore, despite the small percentage of cones, cone-mediated responses in mouse ganglion cells are fast and robust, similar to those in primates. These measurements enable quantitative analysis of cone-mediated responses at all levels of the visual system.
Introduction
The visual system represents an important model for studying the architecture and function of the CNS. There are obvious advantages to studying this system in mouse, which offers genetic tools for probing neural circuit function (Nirenberg and Meister, 1995; Kim et al., 2008; Okawa et al., 2010; Borghuis et al., 2011; Wei et al., 2011; Yonehara et al., 2011), but there are also potential disadvantages. For example, the mouse's small eye supports relatively poor spatial acuity (Stone and Pinto, 1993; Hübener, 2003; Prusky and Douglas, 2004; Niell and Stryker, 2008; Umino et al., 2008). Furthermore, the mouse is nocturnal with a rod-dominated retina (97% of photoreceptors) (Carter-Dawson and Lavail, 1979; Jeon et al., 1998), suggesting that the cone system may be underdeveloped. Indeed, cells of the retina, thalamus, superior colliculus, and cortex show relatively sluggish temporal tuning, peaking at ∼2–5 Hz (Porciatti et al., 1999; Grubb and Thompson, 2003, 2005; Niell and Stryker, 2008; Pandarinath et al., 2010a,b; Wang et al., 2010). Behavioral experiments show similar sensitivity (Umino et al., 2008; Pandarinath et al., 2010a). On the other hand, some properties of the mouse's cone system resemble the primate's, including the cone threshold, dark noise, and Weber adaptation (Naarendorp et al., 2010). Cones partly compensate for their small number by having 10-fold more release sites than rods (Tsukamoto et al., 2001). Furthermore, mouse cone bipolar cells outnumber rod bipolar cells, and the 11 cone bipolar pathways resemble those found in higher mammals (Wässle et al., 2009). Thus, mouse is potentially a useful model for human cone-mediated vision, especially the temporal components of vision, and for diseases that affect cone function. To fully evaluate this model requires a thorough understanding of how to stimulate the cones.
Mouse cones comprise two populations: genuine S cones (∼5%) and coexpressing cones (∼95%) (Rohlich et al., 1994; Applebury et al., 2000; Haverkamp et al., 2005; Nikonov et al., 2006). Genuine S cones express only S-opsin, with peak sensitivity to UV light (360 nm) (Jacobs et al., 1991), and make synapses selectively with S-cone bipolar cells (Haverkamp et al., 2005). Coexpressing cones express both S-opsin and M-opsin (508 nm) in a dorsal–ventral gradient (see Fig. 1A,B). Across the entire retina, the M/S-opsin ratio is ∼1/3 to ∼1/5, based on measurements of total mRNA and full-field electroretinography (ERG) (Lyubarsky et al., 1999; Applebury et al., 2000; Jacobs et al., 2004). Thus, the mouse cone system predominantly expresses S-opsin. Since S-opsin sensitivity drops >100-fold at wavelengths longer than 425 nm, efficient stimulation requires UV light (see Fig. 1C).
Figure 1.

Coexpression of two cone opsins in mouse retina. A, Schematic model illustrating two cone populations across the retina. Genuine S cones comprise ∼5% of the population (outlined in cyan circles); these cones express purely S-opsin and are defined by their synaptic connection with S-cone bipolar cells (Haverkamp et al., 2005). Coexpressing cones show a gradient of mostly M-opsin expression in the dorsal retina to mostly S-opsin expression in the ventral retina (green to gray to magenta). OD, Optic disc. B, Three possible patterns of M/S-opsin coexpression in cones across the retina (diameter, 5 mm) in which the total M/S-opsin ratio is 1/3. For M-opsin expression to be dominant in the dorsal retina, it must decline sharply in the ventral retina (curve a), whereas lower peak M-opsin expression generates a shallower gradient (curves b and c). C, Spectral sensitivity of mouse photoreceptors from a standard template (lines) and the spectra of the light stimuli (filled regions): green LED (green), UV LED, (magenta), and the green channel of the oLED monitor (blue). The black dashed line indicates rhodopsin's 50% enhanced sensitivity to UV light, relative to the template, as measured by rod-mediated responses below.
Here, we characterized functionally M/S cone opsin expression ratio across mouse retina, as reflected in ganglion cell responses. Over a large region of retina, >95% of the photopigment is S-opsin. This characterization enables systematic study of cone-mediated responses at multiple levels of the visual system. With sufficient cone stimulation, using UV light, ganglion cell responses proved to be fast and robust, similar to responses measured in primate cells.
Materials and Methods
Mouse strains
Mice of either sex from four strains were used. Wild-type mice (C57BL/6; aged 6–7 months) were purchased from the Jackson Laboratory. The Rho−/− mouse (aged 1–1.5 months) has a mutation in the rhodopsin gene, causing rod dysfunction, and was generated on the C57BL/6 background (Humphries et al., 1997). The Gnat1−/− mouse (aged 3–7 months) has a mutation in the rod transducin α subunit gene, causing rod dysfunction, and was generated originally on the BALB/c background (Calvert et al., 2000). The Gnat2cpfl3 mouse (aged 5 months) has a naturally occurring missense mutation in the cone transducin α subunit gene, causing cone dysfunction, and was found in the ALS/LtJ strain (Chang et al., 2006). Rho−/− mice were from a colony at University of Michigan established by Dr. Paul Sieving (National Eye Institute, Bethesda, MD). Gnat1−/− and Gnat2cpfl3 mice were kindly provided by Dr. Alapakkam Sampath (University of Southern California, Los Angeles). Gnat1−/− mice originated in the laboratory of Dr. Janice Lem (Tufts University, Medford, MA), and Gnat2cpfl3 mice originated in the laboratory of Dr. Bo Chang (Jackson Laboratory, Bar Harbor, ME). The Gnat1−/− and Gnat2cpfl3 mice were backcrossed onto a C57BL/6 background for >5 generations before establishing a colony of homozygous animals.
Tissue preparation
Mice were housed in a 12 h/12 light/dark cycle. On the day of the experiment, each animal was dark adapted for 1 h and then anesthetized with an intraperitoneal injection of ketamine (100 mg/kg) and xylazine (10 mg/kg). All procedures were performed in a room illuminated with dim red light. A marker was used to dot the dorsal side of each cornea. Under anesthesia, the animal was decapitated and both eyes were removed. All procedures conformed to the National Institutes of Health guidelines for use and care of animals in research and were approved by the University Committee on Use and Care of Animals at the University of Michigan. The eyes were dissected under an infrared dissecting microscope. The intact eye was oriented according to the approximate dorsal side marked on the cornea, and then a slit was made at the left side of the horizontal stripe underneath the optic nerve that marks the nasal-temporal axis (Wei et al., 2010). The eye cup was then dissected from the cornea and lens, and the retina was isolated from the retinal pigment epithelium. The retina was mounted flat on filter paper, ganglion cell side up, and maintained in darkness at room temperature in oxygenated (95% O2 and 5% CO2) Ames medium (Sigma) until the time of recording. In some experiments (Rho−/− retinas), the retina was cut in half along the horizontal meridian, and each half was mounted separately.
Electrophysiology
At the time of recording, the retina, attached to the filter paper, was placed in a chamber on the stage of an Olympus BX51WI microscope and superfused (∼6 ml/min) with oxygenated (95% O2 and 5% CO2) Ames medium heated to 33–35°C with an in-line heater (TC-344B; Warner Instruments). The retina and electrode were visualized at 60× [numerical aperture (NA), 0.9] using a cooled CCD camera (Retiga 1300, Qcapture software; Qimaging Corporation). We targeted the largest cell bodies in the ganglion cell layer (∼20 μm diameter), which biases the recordings to one of three cell types (see Results). A glass electrode (tip resistance, 3–6 MΩ) was filled with Ames medium, and a seal was established for loose-patch extracellular recording of action potentials, measured as currents under voltage clamp (Vhold = 0 mV). Data were sampled at 10 kHz and stored on a computer using a MultiClamp 700B amplifier and pClamp 9 software (Molecular Devices).
We recorded the x–y coordinates of the cell's position and the optic disc and the orientation of the slit marking the horizontal axis. From these, we could calculate the cell's vertical position along the dorsal–ventral axis, relative to the optic disc. In the experiments with Rho−/− mice, the retina was first cut in half along the horizontal meridian (see above, Tissue preparation), and thus estimates of dorsal–ventral position were less accurate than those in other experiments.
Light calibration
We express light intensity in either photoisomerizations (R*) per rod (brief flash stimuli) or photoisomerizations per rod (or cone) per second (balancing experiment and white-noise stimulus). We measured light projected through the objective lens at the focal plane on the stage. Light intensity was measured with a radiometer (in watts per square millimeter; Model S370; United Detector Technology), and the spectrum was measured with a spectrometer (Model USB4000-UV-VIS; Ocean Optics). The photoisomerization rate was computed based on the spectral sensitivity of the photoreceptors (Jacobs et al., 1991; Govardovskii et al., 2000) (see Fig. 1C) and using a collecting area of 0.85 μm2 for rods and 1 μm2 for cones (Lyubarsky et al., 2004; Naarendorp et al., 2010). In estimating light intensity, we included a factor for the reflectance off the white filter paper underneath the retina: 39% reflectance for the green light-emitting diodes (LEDs) and 55% reflectance for the UV LEDs.
Light stimulation
In some experiments, the retina was stimulated by the green channel of a miniature organic LED (oLED) display (eMagin; SVGA Rev. 2). Stimuli were programmed in Matlab on a Macintosh computer using the Psychophysics Toolbox, as described previously (Manookin et al., 2010). In other experiments, the retina was stimulated by either the green channel (peak, 530 nm) of red/green/blue LEDs (NSTM515AS), or the combined output of four UV LEDs (peak, 370 nm; NSHU-550B; Nichia America) (see Fig. 1C). Green and UV LEDs were diffused and windowed by an aperture in the microscope's fluorescence port. Intensity was controlled by pClamp 9 software via a custom noninverting voltage-to-current converter using operational amplifiers (TCA0372; ON Semiconductor). For all methods of stimulation, the gamma curve was corrected to linearize output. For most experiments, stimuli were projected through a 4× objective (NA, 0.13) centered on the cell body and focused on the photoreceptors. For experiments using the Rho−/− retina, light from the LEDs was projected through the 60× (NA, 0.9) objective.
Stimuli were either flashes (20 or 200 ms) of variable intensity light or Gaussian white noise. The white-noise stimulus was a flickering spot (300 or 1000 μm diameter) with either a dark background or a background equal to the mean intensity of the spot. Spot intensity was generated randomly from a Gaussian distribution. The contrast of the stimulus is defined by the SD of the Gaussian, which in this case was one-third of the mean. This is the highest contrast that can be achieved while allowing the distribution to extend ±3 SDs from the mean. In some conditions, the white noise was presented on the oLED at a frame rate of 60 Hz; in this case, the power of stimulus frequencies up to 30 Hz was relatively flat (Zaghloul et al., 2005). In other conditions, the white noise was presented using the UV or green LEDs; in this case, the output was limited to a 0–30 Hz bandwidth, and stimulus power was approximately constant over this range. The stimulus comprised 10 cycles of 10 s each. The first 7 s were unique in each cycle, and the last 3 s were repeated across cycles. The linear–nonlinear (LN) model, described below, was generated based on the unique data, and its predictive ability was tested on the average response of the repeated data.
Analysis
The linear–nonlinear model.
We used an LN cascade model to interpret a cell's responses to the white-noise stimulus. The model consists of a linear filter that determines the cell's temporal sensitivity and a time-independent or “static” nonlinearity that converts the filtered stimulus into a firing rate (see Fig. 4A). The nonlinearity accounts for the spike threshold and saturation in the firing response. The LN model provides a compact description of the response and allows quantitative comparison of contrast sensitivity across conditions varying in mean luminance or contrast (Chichilnisky, 2001; Kim and Rieke, 2001; Baccus and Meister, 2002; Zaghloul et al., 2005).
Figure 4.
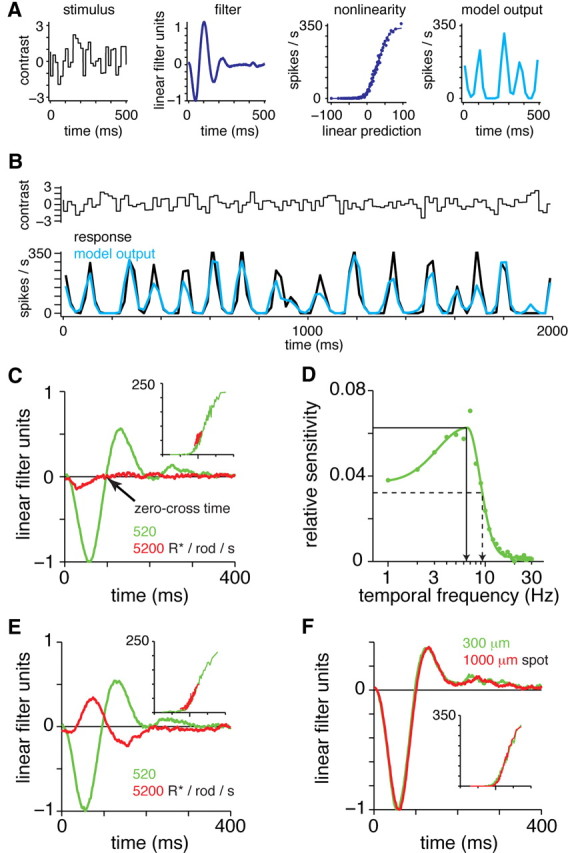
Linear–nonlinear model describes the temporal tuning of the receptive field center in ganglion cells. A, Linear–nonlinear model. The stimulus is shown in contrast units, where the mean luminance is zero and the SD is 1 (range, −3.3 to +3.3; black to white). The stimulus is filtered to generate a linear prediction, and the linear prediction is passed through a nonlinear function to generate the model output (in spikes per second). B, Model explains most of the variance in the response of a Gnat2cpfl3 ganglion cell (same cell as in A). Model and response represent firing rates in 20 ms bins. In this case, the r2 between model and data was 0.76. C, LN models for a Gnat2cpfl3 OFF ganglion cell at two light levels. Spot (1 mm diameter) centered over the cell body was modulated by white noise while the background was maintained at the mean luminance. Filters were scaled to align the nonlinearities (see Materials and Methods). The nonlinearities (inset) plot the linear model (arbitrary units; zero position indicated by elongated tick) versus firing rate (from zero to maximum rate; shown in spikes per second). The response was nearly saturated at 5200 R*/rod/s. In the 520 R*/rod/s mean condition, response speed was quantified by the zero-cross time: the time when the filter crossed zero following the first response peak (arrow). D, Fourier transform of the filter in C. (520 R*/rod/s mean condition). The temporal frequencies corresponding to the maximal amplitude (TFpeak) and the half-maximal amplitude (TF50) are indicated by the solid and dashed lines, respectively. E, Same as C, except the spot was presented against a dark background. In this case, the response at the mean of 5200 R*/rod/s showed an inverted sign (ON filter), suggesting a surround-mediated response to scattered light in the presence of a saturated center. F, A Gnat2cpfl3 OFF ganglion cell showed similar responses to two spot sizes (background equaled the mean luminance of spot modulation).
A linear filter (F) can be computed in the Fourier domain by cross-correlating the stimulus [s(t), described by deviations from a mean of zero] and the response [r(t), in spikes/s] and dividing by the power spectrum of the stimulus:
 |
where s̃(ω) is the Fourier transform of s(t), r̃(ω) is the Fourier transform of r(t), an asterisk denotes the complex conjugate, and S(ω) is the power spectrum of the stimulus calculated from the autocorrelation [s̃ * (ω)s̃(ω)]. Since the stimulus power was flat or nearly flat (see above), we computed the filter from the numerator in Equation 1. The filter in the time domain, F(t), was calculated by taking the inverse Fourier transform of F̃(ω). This filter is proportional to the spike-triggered average stimulus (the average stimulus preceding each spike) (Chichilnisky, 2001).
The linear prediction of the firing rate [rL(t)] was generated by convolving the filter and the stimulus:
 |
The linear prediction was plotted against the measured firing rate, at each time point, to generate the static nonlinearity, and data were binned along the x-axis (100 bins) (see Fig. 4A). In some cases, we compared responses in multiple conditions, each of which generated a filter and nonlinear function. To simplify the comparison of multiple LN models, we described the effect of mean luminance as a change in the L filter followed by a common N function. This was possible, because the LN model is unique only up to a scale factor. Thus, the y-axis of the L filter and the x-axis of the N function can be scaled by the same factor without changing the output of the model (Chander and Chichilnisky, 2001; Kim and Rieke, 2001; Baccus and Meister, 2002). For each cell's responses to stimuli of different mean luminances, the nonlinearities were scaled to align with each other, and then the y-axis of linear filters were scaled by the same factors. We used a nonparametric scaling procedure to align the nonlinearities, as described previously (Beaudoin et al., 2007).
Validating the LN model.
To generate the LN output we first fit the nonlinear function with a cumulative Gaussian (Chichilnisky, 2001):
where C is the cumulative normal density and the parameters correspond to a maximum response (α), response gain (β), and response threshold (γ). This N function served as the “input–output” relationship that transformed the L prediction into the LN prediction (rLN):
We computed the squared correlation (r2) between the LN prediction and the average response to the repeated stimulus (see Fig. 4B); the r2 value represents the proportion of variance in the response explained by the model prediction. Across all conditions, r2 was 0.72 ± 0.012 (mean ± SEM; n = 74 conditions), similar to the value for spiking responses in previous studies (Zaghloul et al., 2003; Beaudoin et al., 2007).
We presented white noise using either the UV LEDs or the oLED monitor described above. For the UV LEDs, the stimulus was an ∼1 mm diameter spot focused on the photoreceptors through the 4× lens, and the background was dark. For the oLED monitor, the stimulus diameter could be varied, and the background could be either dark or equal to the mean luminance of spot modulation. Preliminary experiments showed that for rod-mediated responses (Gnat2cpfl3 retina), the presence of the background was necessary to determine the saturation level of the rods. For example, the response was strongly suppressed when stimulating with a mean luminance of 5200 R*/rod/s (see Fig. 4C). However, the same spot presented with a dark background generated an inverted filter (i.e., an OFF cell's negative filter changed to a positive filter) (see Fig. 4E). The inverted filter's peak was 23 ± 4% (mean ± SEM; n = 13) of the filter's peak at 520 R*/rod/s. The inverted filter was most likely caused by saturation of the receptive field center combined with stimulation of the receptive field surround by scattered light. This inverted filter was absent after a bleaching stimulus described below, suggesting that both center and surround regions were suppressed by the bleach. For the UV LED stimulus, we were not able to generate a background. Thus, in wild-type retinas, the UV stimulus at high mean luminance generates a cone-mediated center response that could be combined with a rod-mediated surround response. However, the cone-mediated response could be isolated following the bleach.
We compared filters generated by a 300-μm-diameter spot (i.e., the expected size of the receptive field center, equivalent to ∼10° of visual angle) (Stone and Pinto, 1993; Sagdullaev and McCall, 2005) and a 1-mm-diameter spot (i.e., the size of the UV LED stimulus). The two filters showed similar time courses: the zero-cross time (see Fig. 4F) was 0.4 ± 3.8 ms (mean ± SEM) longer for the 1-mm-diameter spot. Furthermore, the amplitudes were similar: the amplitude for the 0.3-mm-diameter spot was 0.98 ± 0.14 of the amplitude for the 1-mm-diameter spot. Thus, the 1-mm-diameter stimulus largely reflects the response of the receptive field center. A 300-μm-diameter region on the retina would stimulate ∼30,000 rods and ∼1,000 cones (Carter-Dawson and Lavail, 1979; Jeon et al., 1998).
The cell's temporal frequency (TF) tuning was shown by plotting the Fourier amplitudes of the linear filter (see Fig. 4D). The Fourier amplitudes were fit with a function comprising two half Gaussians (modified from Grubb and Thompson, 2003):
where Q is the Fourier amplitude at each temporal frequency (ω), p is peak temporal frequency, a is the amplitude at the optimal temporal frequency, and the half Gaussians each have their own standard deviation (s1 and s2) and baseline level (b1 and b2). From this function, we determined the temporal frequency at which sensitivity peaked (TFpeak) and the frequency at which sensitivity fell by 50% from the peak (TF50) (see Fig. 4D).
Opsin percentage model
Ganglion cell spike responses were measured to various intensity flashes of green and UV light. For each light stimulus, intensity–response curves were fit with a Naka–Rushton equation:
 |
where R is the spiking response at each intensity (I), A is the maximum response amplitude, σ is the half-saturation value, and n defines the slope. The two curves were fit simultaneously with common A and n values but unique σ values (σgreen, σUV). The sensitivity to green light depends on the proportion of M- and S-opsin in the population of ∼1000 cones mediating the ganglion cell's response:
where Dgreen is the cell's sensitivity to green light, B is a proportionality constant that relates opsin expression to ganglion cell sensitivity, M is the proportion of M-opsin in the cones mediating the cell's response, S is the proportion of S-opsin in those cones (where S = 1 − M), and RM, green* and RS,green* are the isomerization rates of a pure M or S cone to the green light, respectively (i.e., based on the light intensity, spectrum, and cone collecting area described above). Similarly, for UV light, the cell's sensitivity is described by the following equation:
For both green and UV light, the sensitivity was defined as 1/σ from Equation 7:
 |
From Equations 8–10, we can compute the percentage of M-opsin as follows:
 |
For both green and UV light, intensity–response curves were measured either in a single set of trials (Rho−/−, a few Gnat1−/− cells) or were averaged over repeated sets (typically two to three repeats, most Gnat1−/− cells). This averaging had minimal impact on the estimate of M%: for those cells where we had multiple repeats (n = 33 Gnat1−/− cells), M% changed by only 1.2 ± 5.9% (mean ± SD) when analyzing data from the first set of trials versus the average data from multiple sets. Thus, the signal-to-noise ratio was high enough for a single set of trials to estimate M% and did not limit our ability to measure the change in M% as a function of dorsal–ventral position.
Results
We made loose-patch recordings of action potentials from 133 ganglion cells by targeting the largest cell bodies in the ganglion cell layer (∼20 μm diameter). The targeting of large somas biases the recordings to one of three cell types: ON α/transient cells, OFF α/transient cells, or OFF delta/sustained cells (Pang et al., 2003; Murphy and Rieke, 2006; Margolis and Detwiler, 2007; van Wyk et al., 2009). All cells could be unambiguously classified as either the ON or OFF type based on the response to brief flashes or white-noise stimuli. In separate experiments, three-dimensional reconstructions from confocal microscope images showed that all cells with large somas stratified in one of three distinct strata of the inner plexiform layer, similar to the corresponding cell types in the guinea pig retina (Manookin et al., 2008, 2010; see also Margolis and Detwiler, 2007; van Wyk et al., 2009). For the OFF cells recorded here, response properties were relatively uniform, and therefore we distinguish only ON from OFF cells below where relevant.
Rod-mediated responses generate empirical estimates of rhodopsin sensitivity to green and ultraviolet light
The following experiments aim to distinguish rod- from cone-mediated responses in wild-type retina. Most mouse cones show peak sensitivity to UV light, suggesting that UV stimulation will be useful for studying cone-mediated vision (Jacobs et al., 1991; Nikonov et al., 2006). However, rods are also sensitive to UV light because of rhodopsin's “beta band” of absorption in the UV range (Govardovskii et al., 2000) (Fig. 1C). Thus, distinguishing rod- from cone-mediated responses to UV light requires a quantitative estimate of the rod's relative sensitivity to UV and visible wavelengths. The template for rhodopsin's spectral sensitivity predicts that rods should be 27% as sensitive to our UV LED stimulus as to our green LED stimulus (Fig. 1C) (Govardovskii et al., 2000), and we tested this prediction by measuring ganglion cell responses in the Gnat2cpfl3 retina (Chang et al., 2006). This retina lacks cone function, and thus the response should be mediated by rods. In a “balancing experiment,” a green light stimulus (1.8 R*/rod/s) turned off as a UV light turned on to different intensities. When the UV light matches the green light in photoisomerizations per rod per second, there should be no response at the transition, whereas when the UV light drives higher or lower photoisomerization rates, there should be “on” or “off” responses (Fig. 2A1–A3). For each cell, we determined the “balance point” when both the onset and offset of the UV light evoked no response. The balance point across cells suggested that the rhodopsin sensitivity to UV light relative to the green light was 52 ± 3% (mean ± SEM; n = 13) higher than predicted by the standard template (Fig. 2A1–A3).
Figure 2.

Rod-mediated ganglion cell responses in the Gnat2cpfl3 retina show higher than expected sensitivity to UV light. A1, ON ganglion cell spike responses in the balancing experiment. The green light was turned off for 200 ms as the UV light was turned on to different intensities (dimmest to brightest; trials 1 to 12). When the UV light matched the green light in photoisomeration rate (photoisomerizations per rod per second), there was no response at the transition. When the UV light generated fewer photoisomerizations than the green, there was an “off” response (decreased firing rate), whereas when the UV light generated more photoisomerizations than the green, there was an “on” response (increased firing rate). Responses to UV light onset and offset were measured during times indicated by the magenta and green boxes, respectively. A2, The change in firing rate, from the maintained rate, is plotted versus the estimated ratio of photoisomerizations to the green versus UV lights according to the rhodopsin template (Govardovskii et al., 2000). Responses are from the single set of trials plotted in A1. Responses during the transition (magenta) and afterward (green; boxed responses in A1.) were fit with polynomials. The balance point refers to the intersection of the fitted lines. A3, Histogram of balance points across cells (n = 13). The average balance point was 1.52 ± 0.03 (mean ± SEM), indicating that rhodopsin is ∼52% more sensitive to UV light than predicted by the template. The balance point for each cell was averaged over repeated measurements (typically 2–3 repeats). B1, ON ganglion cell responses to brief (20 ms) green and UV light flashes of variable intensity (dimmest to brightest; trials 1 to 12). Responses were measured during the period indicated by the magenta and green boxes. B2, The firing rate, above the maintained rate, following each flash (see boxed responses in B1) and averaged over two repeats. Responses to UV and green light are each plotted versus the estimated photoisomerizations per rod (Govardovskii et al., 2000) and fit with a Naka–Rushton equation (see Materials and Methods) that differed only in the half-saturation constant (σ). This cell showed higher sensitivity to UV light than to green light. B3, Histogram of relative σ values for green versus UV light. The average ratio was 1.48 ± 0.08, consistent with the balancing experiment. For each cell, responses were typically averaged over two repeats. C, Rhodopsin template (Govardovskii et al., 2000) is plotted on previously published ERG measurements from the mouse eye in vivo (dark-adapted, rod-mediated A wave) (Lyubarsky et al., 1999). The ERG measurements are consistent with a ∼50% elevation in UV light sensitivity relative to the template (green dashed line showing 1.5-fold increase), consistent with the above results. Data from Lyubarsky et al. (1999) are reproduced with permission from the Society for Neuroscience and the senior author of the article (Dr. E. N. Pugh). D, Ganglion cell responses to UV and green light align after correcting for rhodopsin UV sensitivity. Responses were normalized to the maximum firing rate and averaged across cells. Error bars indicate ±1 SD across cells.
As a second test of rhodopsin's sensitivity to UV light, we recorded responses to brief flashes of green or UV stimuli at several intensities (Fig. 2B1–B3). The responses at the two wavelengths should match when equated for photoisomerizations per rod. Consistent with the result above, the ganglion cells showed 48 ± 8% (n = 9) higher sensitivity to UV light than predicted by the standard template. We thus conclude that rhodopsin sensitivity to the UV light stimulus is ∼50% higher than predicted [i.e., rods are 41% (27% × 1.5) as sensitive to our UV stimulus as to our green stimulus]. This relatively high sensitivity to UV light is consistent with previous in vivo ERG recordings of rod-mediated responses (Lyubarsky et al., 1999) (Fig. 2C). This enhanced UV sensitivity was taken into account below when calculating photoisomerization rates for rhodopsin.
To assess the absolute sensitivity of Gnat2cpfl3 cells in our preparation, we replotted the flash response data on a modified photoisomerizations per rod axis, taking into account the estimated 50% elevation in UV sensitivity described above. On average (n = 9 cells), the response to UV and green light now overlapped (Fig. 2D). Furthermore, the absolute sensitivity of the rod-mediated ganglion cell responses was similar to previous measurements in the wild-type retina (Dunn et al., 2006). Thus, the Gnat2cpfl3 rod-mediated ganglion cell responses are apparently similar in sensitivity to the wild-type retina, consistent with ERG recordings (Chang et al., 2006).
Functional estimate of cone opsin distribution across the mouse retina
Most mouse cones (∼95%) coexpress both M- and S-opsins in a dorsal–ventral gradient (Fig. 1A), and the total M/S ratio across the retina is ∼1/3 to ∼1/5 (Rohlich et al.,1994; Lyubarsky et al., 1999; Applebury et al., 2000; Jacobs et al., 2004). Thus, for most of the retina, cone-mediated responses should show strong sensitivity to UV light (Fig. 1). To measure the relative percentage of the M- and S-opsins along the dorsal–ventral axis, we recorded ganglion cell responses to the green and UV light stimuli in two strains with rod dysfunction: Rho−/− (Humphries et al., 1997) and Gnat1−/− (Calvert et al., 2000). For each ganglion cell, we presented 200 ms flashes of either green or UV light at several intensities and fit each curve with a Naka–Rushton equation; the relative sensitivity to the two lights was determined by the difference in the half-saturation intensity for each light (see Materials and Methods).
For both the Gnat1−/− and Rho−/− retinas, there was a dramatic shift in spectral sensitivity across the retina. Cells in the dorsal retina showed stronger sensitivity to green light, whereas those in the ventral retina showed stronger sensitivity to UV light (Fig. 3A). Based on the relative sensitivities to green and UV light, we calculated the percentage of M-opsin across the cone population driving the ganglion cell's response and plotted this percentage against the ganglion cell's position along the dorsal–ventral axis (see Materials and Methods) (Fig. 3B). In both strains, the M percentage was ∼70% in the dorsal retina (2 mm dorsal to the optic disc) but dropped to less than ∼5% in the ventral retina (2 mm ventral to the disc), with a steep decline in M percentage beginning at ∼1 mm dorsal to the optic disc (Fig. 3C). Thus, the cones in the majority of the ventral retina apparently express >95% S-opsin.
Figure 3.
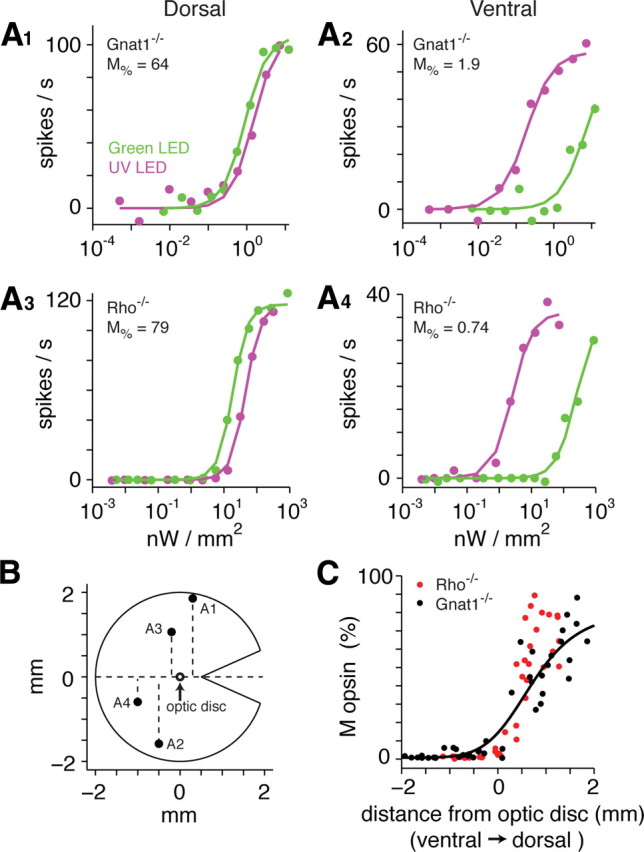
Estimated ratio of M/S-opsin expression as a function of retinal position. A1–A4, Ganglion cell spike responses to various intensities of green and UV light at different positions of the Gnat1−/− and Rho−/− retinas. For each cell, responses to each stimulus were fit with a Naka–Rushton equation that differed only in their half-saturation (σ) values. The ratio of σ values was used to calculate the M/S-opsin ratio (see Materials and Methods). Responses in A1, A3 and A4 show measurements from a single set of trials, whereas A2 is an average of four sets. B, Schematic diagram of a mouse retina with a cut at the horizontal position. Labeled points indicate the position of cells in A. C, Calculated M-opsin percentage as a function of the dorsal–ventral position of ganglion cells. The line was fit to the Gnat1−/− data (black points).
We fit a modified Naka–Rushton equation to describe the percentage of M-opsin (M%) as a function of dorsal–ventral position (p, in mm, starting in the ventral retina, at −2 mm from the disc):
 |
where Mmax is the maximum M percentage minus the minimum M percentage, Mσ is a half-saturation value, Mn is the exponent describing the slope of the function, and Mmin is the minimum M percentage. The best fitting parameters were Mmax = 80, Mσ = 3.2, Mn = 6.4, and Mmin = 0.8. This equation was fit to the Gnat1−/− cells, where the dorsal–ventral positions were recorded with relatively high accuracy (see Materials and Methods). However, the general pattern was very similar in the Rho−/− cells. Notably, of the 35 total cells recorded in the ventral retina, all expressed <10% M-opsin contribution, and 86% (30/35) expressed <5% M-opsin contribution. In the following experiments, we used the fitted curve to estimate photoisomerizations per cone per second based on the dorsal–ventral position of each cell.
Rod-mediated responses support bandpass temporal filtering and show light adaptation
The mouse strains described above allow us to assess the temporal properties of isolated rod- or cone-mediated ganglion cell responses. We started by characterizing responses in Gnat2cpfl3 cells using white-noise stimulation and an LN cascade analysis. In this analysis, the cell's response is modeled by a temporal filter and a static nonlinearity (Fig. 4A). The filter describes the cell's temporal sensitivity to the stimulus, and the nonlinearity describes how the filtered stimulus (i.e., a linear model) is converted into a firing rate. The nonlinearity captures the threshold and saturation in the firing response (see Materials and Methods). The LN model is useful because it provides a compact functional description that captures most of the variance in the response (Fig. 4B). We modeled the effect of increasing mean luminance as a change in the linear filter followed by a constant nonlinearity (see Materials and Methods).
Rod-mediated responses showed biphasic filters, indicating bandpass temporal frequency tuning at both levels of mean luminance (Fig. 5A) (Zaghloul et al., 2005). The response adapted at the higher mean luminance by becoming faster, which we quantified by the filter's zero-cross time (Fig. 4C). Across cells, the 10-fold increase in mean luminance shortened the zero-cross time from 105 ± 5 ms (mean ± SEM) to 91 ± 4 ms (difference of 14 ± 4 ms; p < 0.01; n = 12) (Fig. 5C). We also plotted the Fourier transform of the linear filter to generate a temporal frequency-tuning curve (Fig. 5B). The peak amplitude shifted from 5.1 ± 0.3 Hz to 6.9 ± 0.3 Hz with the increase in mean luminance (Fig. 5D). Thus, the temporal tuning of the light-adapted, rod-mediated response was sufficient to explain the temporal tuning of downstream circuits and behavior shown previously (see Introduction). The responses at the light levels tested (52 and 520 R*/rod/s) likely depend on both the rod bipolar pathway and additional pathways for rod signaling (Murphy and Rieke, 2006): rod synapses with certain types of cone bipolar cells (Soucy et al., 1998; Tsukamoto et al., 2001; Li et al., 2010) and rod gap junctions with cones, which then signal through the cone bipolar circuits (Deans et al., 2002; Abd-El-Barr et al., 2009). A previous study of the Gnat2cpfl3 retina also suggested that rod–cone gap junctions were functional despite the lack of cone phototransduction (Altimus et al., 2010).
Figure 5.

Rod-mediated responses in Gnat2cpfl3 ganglion cells show bandpass temporal tuning and adapt to changes in mean luminance. A, LN models for a Gnat2cpfl3 OFF ganglion cell at two light levels below rod saturation (mean luminance, 52 and 520 R*/rod/s). Responses became faster and more biphasic at the higher mean. The response at 520 R*/rod/s was absent after a bleaching stimulus (pink line) (see Results). Stimulus was a spot (1 mm diameter) with a background equal to the mean luminance of spot modulation. B, Fourier transform of the filters in A. The filter in the 520 R*/rod/s condition was normalized with a peak of +1 (ON cells) or −1 (OFF cells) before scaling the 52 R*/rod/s condition (after aligning the nonlinearities) and computing the Fourier transform. The response became more bandpass at the higher mean luminance. Solid lines are fitted by functions comprised of two half Gaussians (see Materials and Methods). C, Zero-cross time at two levels of mean luminance across cells. Here and elsewhere, individual cells are shown in a light shade, and the mean ± 1 SD is shown in a dark shade. D, Averaged Fourier transform of filters measured with mean luminance of 52 and 520 R*/rod/s. Error bars indicate ±1 SEM across cells (n = 12).
Rod-mediated responses were nearly saturated at a mean luminance of 5200 R*/rod/s (see Materials and Methods) (Fig. 4C). However, stimulating at this mean luminance for several minutes did not cause substantial bleaching of rhodopsin, as the responses at lower mean luminance could be subsequently remeasured. Rod-mediated responses could be bleached by exposing the tissue to a green LED stimulus that generated ∼1.6 × 10⁶ R*/rod/s for 2 min (Fig. 5A, pink line). As expected, light responses never recovered following the bleach (measured up to 1 h after bleach; n = 10) (Wang and Kefalov, 2009).
Cone-mediated responses show high temporal frequency tuning
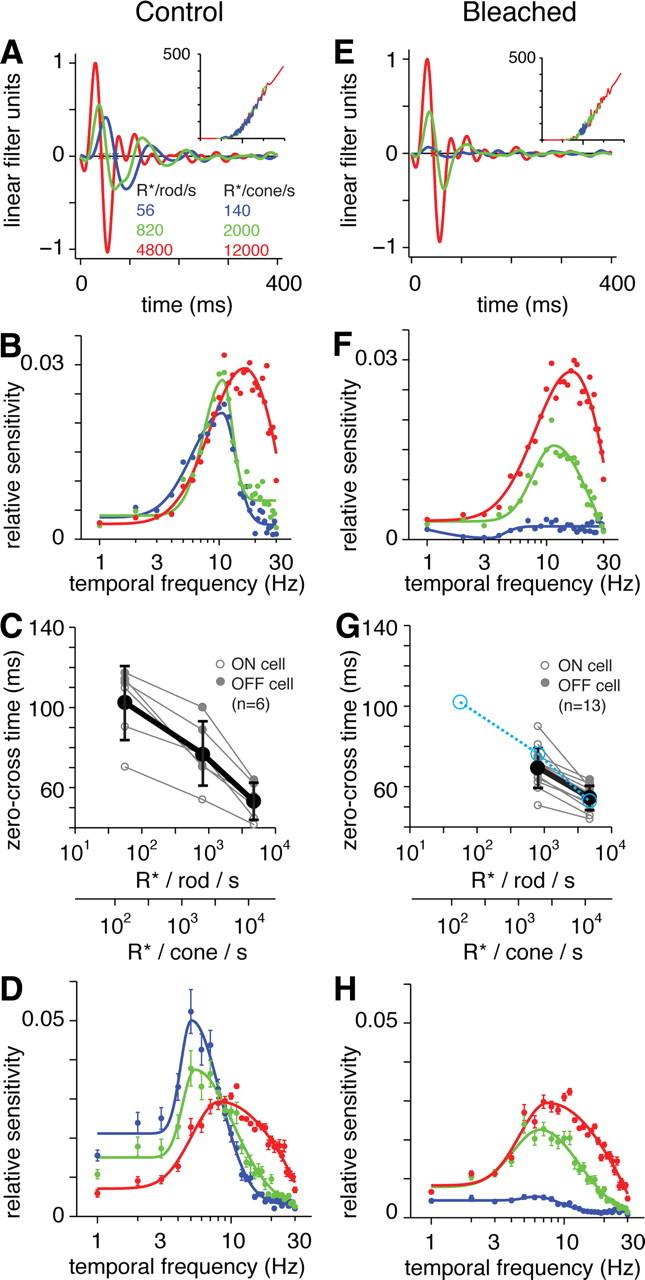
We measured the temporal properties of pure cone-mediated responses in the Gnat1−/− retina. White-noise responses were generated using a UV LED stimulus in the ventral retina, where most cones express >95% S-opsin (Fig. 3C). Responses could be measured with a mean luminance of 140 R*/cone/s (Fig. 6A). These responses were relatively slow, with a zero-cross time of 122 ± 5 ms (mean ± SEM; n = 4). Increasing the mean luminance to brighter levels (2000 and 12,000 R*/cone/s) shortened the zero-cross time substantially, to 81 ± 6 ms at the highest mean (Fig. 6C). Filters were biphasic in time and showed bandpass tuning in the frequency domain (Fig. 6A,B).
Figure 6.

Cone-mediated responses in ventral Gnat1−/− retina are resistant to bleaching with green light. A, LN models for a Gnat1−/− OFF ganglion cell at three light levels (mean luminance, 140, 2000, and 12,000 R*/cone/s). B, Fourier transform of the filters in A. The filter in the 12,000 R*/cone/s condition was normalized with a peak of +1 (ON cells) or −1 (OFF cells) before scaling the other two conditions (after aligning the nonlinearities) and computing the Fourier transform. Other conventions are the same as for Figure 5. C, Zero-cross time at three levels of mean luminance across cells. D, Averaged Fourier transform of filters at three levels of mean luminance across cells. E–H, Same as A–D after bleaching with a green light stimulus sufficient to bleach the rod-mediated response in a Gnat2cpfl3 retina (see Results). Blue points in G show the zero-cross times from the control condition in C. There was a slightly delayed zero-cross time at each mean luminance, possibly caused by bleaching of a small percentage of M-opsin expression in the ventral cones.
We tested the effect of the rod bleaching stimulus used above (i.e., bright green light) on the primarily S-cone-mediated response of ventral Gnat1−/− cells. The bleaching light had only a small impact on the cone-mediated response (Fig. 6E–H). The primary effect was a lengthening of the zero-cross time (Fig. 6G) (increases of 11 ± 3, 9 ± 2, and 5 ± 2 ms at the low, middle, and high mean luminances, respectively; n = 4). This may be caused by a bleaching of the small percentage of M-opsin expressed by the coexpressing cones in ventral retina (Lyubarsky et al., 1999; Nikonov et al., 2006). These results suggest that the bleaching stimulus could be used in the ventral wild-type retina to bleach rods and isolate an unbleached cone-mediated responses driven by S-opsin stimulation.
Cone-mediated responses in the wild-type retina are fast and robust
In the ventral wild-type retina, where the cones express primarily S-opsin, we studied temporal properties of ganglion cell responses across three levels of mean luminance. White-noise modulation of the UV stimulus at the two lower light levels should generate a mixed rod- and cone-mediated response, whereas modulation at the brightest level should saturate the rods and generate a pure cone-mediated response (Fig. 7A). The response became faster with increasing mean luminance, as indicated by a shorter zero-cross time and a higher values of TFpeak (Fig. 7A,B). Across cells, the filter's zero-cross time decreased to 53 ± 4 ms (n = 6) at the highest mean luminance, with an average TFpeak of 10.7 ± 2.3 Hz (mean ± SEM; n = 6) (Fig. 7C,D). Some individual cells showed a TFpeak above 10 Hz (Fig. 7B).
Figure 7.
Isolated cone-mediated responses in ventral wild-type retina show fast temporal kinetics. A, LN models for a wild-type ON ganglion cell at three light levels. B, Fourier transform of the filters in A. The filter in the brightest condition was normalized with a peak of +1 (ON cells) or −1 (OFF cells) before scaling the other two conditions (after aligning the nonlinearities) and computing the Fourier transform. Other conventions are the same as in Figure 5. C, Zero-cross time at three levels of mean luminance across cells. D, Averaged Fourier transform of filters at three levels of mean luminance across cells. E–H, Same as A–D after bleaching with a green light stimulus sufficient to bleach the rod-mediated response in a Gnat2cpfl3 retina (see Results). Blue points in G show the zero-cross times from the control condition in C.
The rods were bleached using the bright green stimulus described previously (Fig. 5A), and the cone-mediated responses were studied in isolation. Responses at the lowest mean luminance were suppressed after the bleach, suggesting a strong contribution from rods in the initial, unbleached condition. At the intermediate level, the response became faster, reflecting the cone contribution, whereas at the highest level, the responses were largely unaffected by the bleach (Fig. 7E–H). Thus, cone-mediated responses in the ventral wild-type retina can be routinely isolated from the rod-mediated response in vitro by a bleaching green light. The isolated cone-mediated response in the wild-type retina showed a TFpeak of 10 ± 1 Hz (n = 10). The amplitude dropped to half the peak (TF50) at 22 ± 2 Hz (Fig. 7D,H). At 30 Hz, the response was, on average, still within a log10 unit of the peak amplitude (Fig. 7H). Thus, mouse cones show substantial responsiveness up to 30 Hz, so long as cones are stimulated sufficiently given the local opsin distribution (Figs. 1, 3).
Rod and cone systems generate a smooth transition in ganglion cell temporal kinetics across light levels with similarly robust responses
We summarize the above results on the linear filter temporal properties by plotting the filter's zero-cross time as a function of the photoisomerization rate in the photoreceptors driving the response. There is a smooth transition in the temporal response across light levels, as reflected in the Gnat2cpfl3 and wild-type recordings (Fig. 8A). The zero-cross time is halved from ∼100 to ∼50 ms across ∼2.5 orders of photoisomerization rates. The Gnat1−/− filters showed relatively longer zero-cross times, compared to wild types. This property of the Gnat1−/− ganglion cell recordings could be explained by the relatively slow kinetics of the Gnat1−/− cones, as shown by single-cell recordings (Nikonov et al., 2006).
Figure 8.

Rod and cone systems generate a smooth transition in ganglion cell temporal kinetics across light levels and drive similarly robust responses. A, There is a gradual speeding of the response (shortened zero-cross time) over a 2.5 log-unit increase in photoisomerization rate. Rod-mediated responses are shown for the Gnat2cpfl3 retina. Cone-mediated responses are shown for the Gnat1−/− retina and for the wild-type retina after saturating or bleaching the rods. A mixed rod- and cone-mediated response is shown for the wild-type retina before bleaching or saturating, and for these points, we indicate the range of photoisomerization rates with a horizontal bar (rod photoisomerization rate on the left; cone photoisomerization rate on the right). There is a smooth transition in the kinetics between the rod- and cone-mediated responses. Gnat1−/− ganglion cell responses were slower than wild-type cone-mediated responses, consistent with previous cone recordings (Nikonov et al., 2006). The dashed line was fit by eye to the wild-type and Gnat2cpfl3 cells. Error bars indicate ±1 SD across cells. B, The firing rate was relatively stable over a 2.5 log-unit increase in photoisomerization rate. Plotted is the maximum firing rate in the nonlinear function minus the estimated firing rate at 0% contrast [i.e., firing rate at f(x) = 0 of the nonlinear function]. Despite having a small percentage of cone photoreceptors (∼3%), firing rate increases slightly in the range of cone-mediated responses. Error bars indicate ±1 SD across cells. C, Temporal tuning extends to higher frequencies under cone-mediated conditions. Functions show the average, normalized responses of light-adapted rod-mediated responses (Gnat2cpfl3, 520 R*/rod/s mean) (from Fig. 5D) and cone-mediated responses (wild-type, 12,000 R*/cone/s mean after the bleaching stimulus) (from Fig. 7H). Error bars indicate ±1 SEM across cells.
We compared the absolute level of rod- and cone-mediated responses by plotting firing rate as a function of the photoisomerization rate of the photoreceptors driving the response. Firing rate was quantified as the peak of the nonlinear function minus the rate at f(x) = 0 (i.e., the maximum rate minus the estimated rate at 0% contrast). The maximum firing rate was ∼150–300 spikes per second across the ∼2.5 order of photoisomerization rates (Fig. 8B). Furthermore, the firing rate increased slightly with mean luminance. Thus, despite having only ∼3% cone photoreceptors in the retina, cone-mediated responses in mouse ganglion cells are robust.
Discussion
Our results provide the first characterization of cone-mediated responses in mouse retinal ganglion cells based on estimated cone photopigment isomerization rates. To perform this characterization, we first mapped M/S-opsin expression ratios across the retina by measuring ganglion cells' relative sensitivity to green and UV light (Fig. 3). Estimated M-opsin expression dropped from ∼70% to <5% along the dorsal–ventral axis, with very low expression throughout the ventral retina (Fig. 3). Ganglion cell temporal properties were characterized with linear systems analysis (Fig. 4), and cone-mediated responses could be isolated in a mouse with rod dysfunction (Gnat1−/−) (Fig. 6) or after bleaching rods in the wild-type retina (Fig. 7). Cone-mediated responses showed maximal response amplitude at ∼10 Hz, with substantial responsiveness up to 30 Hz. The rod system, studied in a mouse with cone dysfunction (Gnat2cpfl3), when light adapted (∼520 R*/rod/s mean luminance) showed maximal responses at ∼7 Hz with a half-maximal drop at 10 ± 0.3 Hz (Fig. 5). Thus, over much of the retina, including the entire ventral retina, cone-mediated responses showed characteristic properties: greater sensitivity to UV than green light and responsiveness at temporal frequencies above 10 Hz, given a mean luminance that generates ∼104 R*/cone/s (Fig. 8C). Notably, bandpass temporal tuning and peak amplitude at ∼7 Hz were not restricted to cone-mediated responses, as these properties were observed under conditions driven by light-adapted rods (Figs. 5, 8C). Furthermore, cone-mediated responses measured near cone threshold (Fig. 6C) were slower than light-adapted rod-mediated responses (Fig. 5C), consistent with psychophysical measurements in humans (Conner and MacLeod, 1977). Our characterization of mouse ganglion cell spectral and temporal properties enables the study of cone-mediated responses at all stages of the visual system and in behavior.
The functional map of opsin expression in coexpressing cones
A change in cone opsin distribution and opsin coexpression along the dorsal–ventral axis is found in several mammals (Calderone and Jacobs, 1995; Applebury et al., 2000; Szél et al., 2000). For example, guinea pig retina shows such a gradient, with a zone of M/S-opsin coexpression in a horizontal region ventral to the optic disc and a high population of S cones in the ventral retina, as demonstrated by immunocytochemistry (Rohlich et al., 1994). Ganglion and horizontal cell responses recorded at dorsal and ventral locations showed the shift in spectral sensitivity predicted by immunostaining (Yin et al., 2006). Qualitatively similar results in mouse in vivo were obtained by ERG measurements at lower spatial resolution (Calderone and Jacobs, 1995) and in recordings at the level of retina (ganglion cells) and superior colliculus (Ekesten et al., 2000; Ekesten and Gouras, 2001). Here, we describe a continuous quantification of M-opsin percentage along the dorsal–ventral axis of mouse retina that could be used in subsequent studies to estimate photoisomerizations per cone per second at any given position (Equation 12).
We consider several factors that limit our ability to estimate opsin coexpression. First, cone bipolar cells mediating ganglion cell responses may not collect inputs selectively from coexpressing cones. A mixed input from coexpressing (∼95%) and genuine S cones (∼5%) could introduce an error in our estimate of S-opsin expression in the coexpressing cones. However, this error should be minor given the small number of genuine S cones and the likelihood that their input to bipolar cell types other than the S-cone bipolar cells is weak (Haverkamp et al., 2005; Li and DeVries, 2006). There is evidence for a small and insensitive rhodopsin-dependent but Gnat1-independent response in rods (Allen et al., 2010). This putative rod-mediated response in the Gnat1−/− cells would enhance the apparent M-opsin percentage at each location (i.e., given the similarity in spectral sensitivity between rhodopsin and M-opsin); but any contribution from this putative mechanism must be small, because estimated M-opsin percentage was very low in ventral retina, and the Gnat1−/− and Rho−/− data were similar. Furthermore, we assumed that M-opsin sensitivity to UV light was explained by the standard template, consistent with single-cone recordings in an “S-opsin knockout” (Daniele et al., 2011). If instead M-opsin showed a ∼50% elevated sensitivity to UV light, as we estimated for rhodopsin, the M-opsin percentage at every retinal position in the Gnat1−/− retina would increase; however, this increase would be small (from ∼70 to ∼81% in dorsal retina and essentially no change in ventral retina). Finally, our cone opsin measurements viewed through the output of ganglion cells (∼300 μm diameter receptive field center) (Stone and Pinto, 1993; Sagdullaev and McCall, 2005) limits the spatial resolution of the measurement. Thus, the gradient in opsin coexpression in the cone population may be slightly steeper than we measured; however, simulations suggest that this effect would be small. We conclude that the above factors should only minimally affect the estimated M-opsin expression in Figure 5C.
Our results are consistent with immunostaining, suggesting a dramatic switch in opsin coexpression over a ∼0.5 mm distance on the retina (Haverkamp et al., 2005). Our measurement of opsin gradient in two transgenic animals should be useful for studying the wild-type C57BL/6 mouse. The two models used (Rho−/− and Gnat1−/−) were generated on different genetic backgrounds (see Materials and Methods) but showed similar gradients in opsin coexpression (Fig. 3C) suggesting minimal strain differences, consistent with immunostaining (Szél et al., 1992).
Our results suggest that the M/S ratio across the entire retina should be ∼1/2.8 (i.e., based on integrating the fitted curve in Fig. 3C). This ratio is close to estimates based on measures of total mRNA (∼1/3) (Applebury et al., 2000) and full-field ERG (∼1/3 to ∼1/5) (Lyubarsky et al., 1999; Jacobs et al., 2004). A behavioral study suggested ∼20% M-opsin expression in the midventral retina (Naarendorp et al., 2010). However, this is likely an overestimate, because an ∼1/3 M/S ratio across the retina requires <20% M-opsin expression in the ventral retina to generate a gradient (Fig. 1B). It is therefore likely that the apparent ∼20% M-opsin expression in the behavioral study is explained by the stimulus extending to the dorsal retina, either because of unmeasured variability in eye position or effects of light scatter.
Temporal frequency tuning in the mouse visual system
Temporal frequency tuning of ganglion cells limits the temporal resolution at all subsequent stages of the visual system. Recordings at multiple levels of the visual system and behavior suggested that mouse vision is relatively sluggish, with peak temporal tuning near ∼2–5 Hz and a cutoff frequency of typically <10 Hz (Porciatti et al., 1999; Krishna et al., 2002; Grubb and Thompson, 2003, 2005; Niell and Stryker, 2008; Umino et al., 2008; Pandarinath et al., 2010a, b; Wang et al., 2010). However, estimated stimulation of mouse cones was commonly based on photometeric measurements of visible light (in candelas per square meter). It now seems likely that sluggish responses at presumed levels of photopic (i.e., cone-mediated) vision can be explained by responses mediated by rods and weakly stimulated cones (depending on retinal position). In rare cases, cells in the lateral geniculate nucleus showed peak tuning at >10 Hz (Grubb and Thompson, 2003, 2005). These measurements were made using a conventional computer monitor (mean luminance, 50 cd/m2) that would stimulate S-opsin weakly; thus, the few cells with peak tuning >10 Hz likely received input from ganglion cells positioned in the far dorsal retina, where cone-mediated responses can be well stimulated by visible light.
Cone-mediated responses in mouse ganglion cells at a mean luminance that generated ∼2000–12,000 R*/cone/s showed fast temporal properties (Figs. 7, 8). The cells comprised three types with large cell bodies, including ON and OFF alpha cells, and can be compared to primate M and P cells (i.e., thalamic relay cells in the magnocellular and parvocellular layers of the lateral geniculate nucleus or their presynaptic ganglion cells). Temporal tuning functions of primate M and P cells show peak amplitudes between ∼10–20 Hz, and linear filters show a corresponding zero-cross time of ∼50–60 ms (Hicks et al., 1983; Derrington and Lennie, 1984; Lee et al., 1989; Benardete and Kaplan, 1999; Hawken et al., 1996; Chander and Chichilnisky, 2001; Solomon et al., 2010). These temporal properties match the mouse cone-mediated responses shown here (Figs. 7, 8). Previous measurements of mouse temporal properties to visible light showed slower responses (zero-cross times of ∼100–200 ms), likely explained by weak cone stimulation by visible light (Soucy et al., 1998; Huberman et al., 2008; Kerschensteiner et al., 2008; Pandarinath et al., 2010a, b). The characteristic properties of rod- and cone-mediated responses described here could be used to further clarify how rod- and cone-pathways combine to generate responses at multiple levels of the visual system and behavior (Deans et al., 2002; Völgyi et al., 2004; Umino et al., 2008; Pang et al., 2010).
Footnotes
This work was supported by Grants EY014454, EY014454-S1, and EY021372 and Core Grant EY07003 from the National Eye Institute. We thank Drs. Bart Borghuis, Daniel Green, Alapakkam Sampath, Josh Singer, and Ben Stafford for helpful comments on this manuscript, and Alapakkam Sampath and Cyrus Arman (University of Southern California Keck School of Medicine) for kindly providing the initial breeding stocks of Gnat1−/− and Gnat2cpfl3 mice.
The authors declare no competing financial interests.
References
- Abd-El-Barr MM, Pennesi ME, Saszik SM, Barrow AJ, Lem J, Bramblett DE, Paul DL, Frishman LJ, Wu SM. Genetic dissection of rod and cone pathways in the dark-adapted mouse retina. J Neurophysiol. 2009;102:1945–1955. doi: 10.1152/jn.00142.2009. [DOI] [PMC free article] [PubMed] [Google Scholar]
- Allen AE, Cameron MA, Brown TM, Vugler AA, Lucas RJ. Visual responses in mice lacking critical components of all known retinal phototransduction cascades. PLoS One. 2010;5:e15063. doi: 10.1371/journal.pone.0015063. [DOI] [PMC free article] [PubMed] [Google Scholar]
- Altimus CM, Güler AD, Alam NM, Arman AC, Prusky GT, Sampath AP, Hattar S. Rod photoreceptors drive circadian photoentrainment across a wide range of light intensities. Nat Neurosci. 2010;13:1107–1112. doi: 10.1038/nn.2617. [DOI] [PMC free article] [PubMed] [Google Scholar]
- Applebury ML, Antoch MP, Baxter LC, Chun LLY, Falk JD, Farhangfar F, Kage K, Krzystolik MG, Lyass LA, Robbins JT. The murine cone photoreceptor: a single cone type expresses both S and M-opsins with retinal spatial patterning. Neuron. 2000;27:513–523. doi: 10.1016/s0896-6273(00)00062-3. [DOI] [PubMed] [Google Scholar]
- Baccus SA, Meister M. Fast and slow contrast adaptation in retinal circuitry. Neuron. 2002;36:909–919. doi: 10.1016/s0896-6273(02)01050-4. [DOI] [PubMed] [Google Scholar]
- Beaudoin DL, Borghuis BG, Demb JB. Cellular basis for contrast gain control over the receptive field center of mammalian retinal ganglion cells. J Neurosci. 2007;27:2636–2645. doi: 10.1523/JNEUROSCI.4610-06.2007. [DOI] [PMC free article] [PubMed] [Google Scholar]
- Benardete EA, Kaplan E. The dynamics of primate M retinal ganglion cells. Vis Neurosci. 1999;16:355–368. doi: 10.1017/s0952523899162151. [DOI] [PubMed] [Google Scholar]
- Borghuis BG, Tian L, Xu Y, Nikonov SS, Vardi N, Zemelman BV, Looger LL. Imaging light responses of targeted neuron populations in the rodent retina. J Neurosci. 2011;31:2855–2867. doi: 10.1523/JNEUROSCI.6064-10.2011. [DOI] [PMC free article] [PubMed] [Google Scholar]
- Calderone JB, Jacobs GH. Regional variations in the relative sensitivity to UV light in the mouse retina. Vis Neurosci. 1995;12:463–468. doi: 10.1017/s0952523800008361. [DOI] [PubMed] [Google Scholar]
- Calvert PD, Krasnoperova NV, Lyubarsky AL, Isayama T, Nicolo M, Kosaras B, Wong G, Gannon KS, Margolskee RF, Sidman RL, Pugh EN, Jr, Makino CL, Lem J. Phototransduction in transgenic mice after targeted deletion of the rod transducin alpha-subunit. Proc Natl Acad Sci U S A. 2000;97:13913–13918. doi: 10.1073/pnas.250478897. [DOI] [PMC free article] [PubMed] [Google Scholar]
- Carter-Dawson LD, LaVail MM. Rods and cones in the mouse retina. J Comp Neurol. 1979;188:245–262. doi: 10.1002/cne.901880204. [DOI] [PubMed] [Google Scholar]
- Chander D, Chichilnisky EJ. Adaptation to temporal contrast in primate and salamander retina. J Neurosci. 2001;21:9904–9916. doi: 10.1523/JNEUROSCI.21-24-09904.2001. [DOI] [PMC free article] [PubMed] [Google Scholar]
- Chang B, Dacey MS, Hawes NL, Hitchcock PF, Milam AH, Atmaca-Sonmez P, Nusinowitz S, Heckenlively JR. Cone photoreceptor function loss-3, a novel mouse model of achromatopsia due to a mutation in Gnat2. Invest Ophthalmol Vis Sci. 2006;47:5017–5021. doi: 10.1167/iovs.05-1468. [DOI] [PubMed] [Google Scholar]
- Chichilnisky EJ. A simple white noise analysis of neuronal light responses. Network. 2001;12:199–213. [PubMed] [Google Scholar]
- Conner JD, MacLeod DI. Rod photoreceptors detect rapid flicker. Science. 1977;195:698–699. doi: 10.1126/science.841308. [DOI] [PubMed] [Google Scholar]
- Daniele LL, Insinna C, Chance R, Wang J, Nikonov SS, Pugh EN., Jr A mouse M-opsin monochromat: Retinal cone photoreceptors have increased M-opsin expression when S-opsin is knocked out. Vision Res. 2011;51:447–458. doi: 10.1016/j.visres.2010.12.017. [DOI] [PMC free article] [PubMed] [Google Scholar]
- Deans MR, Völgyi B, Goodenough DA, Bloomfield SA, Paul DL. Connexin36 is essential for transmission of rod-mediated visual signals in the mammalian retina. Neuron. 2002;36:703–712. doi: 10.1016/s0896-6273(02)01046-2. [DOI] [PMC free article] [PubMed] [Google Scholar]
- Derrington AM, Lennie P. Spatial and temporal contrast sensitivities of neurones in lateral geniculate nucleus of macaque. J Physiol. 1984;357:219–240. doi: 10.1113/jphysiol.1984.sp015498. [DOI] [PMC free article] [PubMed] [Google Scholar]
- Dunn FA, Doan T, Sampath AP, Rieke F. Controlling the gain of rod-mediated signals in the mammalian retina. J Neurosci. 2006;26:3959–3970. doi: 10.1523/JNEUROSCI.5148-05.2006. [DOI] [PMC free article] [PubMed] [Google Scholar]
- Ekesten B, Gouras P. Identifying UV-cone responses in the murine superior colliculus. Vision Res. 2001;41:2819–2825. doi: 10.1016/s0042-6989(01)00113-4. [DOI] [PubMed] [Google Scholar]
- Ekesten B, Gouras P, Yamamoto S. Cone inputs to murine retinal ganglion cells. Vision Res. 2000;40:2573–2577. doi: 10.1016/s0042-6989(00)00122-x. [DOI] [PubMed] [Google Scholar]
- Govardovskii VI, Fyhrquist N, Reuter T, Kuzmin DG, Donner K. In search of the visual pigment template. Vis Neurosci. 2000;17:509–528. doi: 10.1017/s0952523800174036. [DOI] [PubMed] [Google Scholar]
- Grubb MS, Thompson ID. Quantitative characterization of visual response properties in the mouse dorsal lateral geniculate nucleus. J Neurophysiol. 2003;90:3594–3607. doi: 10.1152/jn.00699.2003. [DOI] [PubMed] [Google Scholar]
- Grubb MS, Thompson ID. Visual response properties of burst and tonic firing in the mouse dorsal lateral geniculate nucleus. J Neurophysiol. 2005;93:3224–3247. doi: 10.1152/jn.00445.2004. [DOI] [PubMed] [Google Scholar]
- Haverkamp S, Wässle H, Duebel J, Kuner T, Augustine GJ, Feng G, Euler T. The primordial, blue-cone color system of the mouse retina. J Neurosci. 2005;25:5438–5445. doi: 10.1523/JNEUROSCI.1117-05.2005. [DOI] [PMC free article] [PubMed] [Google Scholar]
- Hawken MJ, Shapley RM, Grosof DH. Temporal-frequency selectivity in monkey visual cortex. Vis Neurosci. 1996;13:477–492. doi: 10.1017/s0952523800008154. [DOI] [PubMed] [Google Scholar]
- Hicks TP, Lee BB, Vidyasagar TR. The responses of cells in macaque lateral geniculate nucleus to sinusoidal gratings. J Physiol. 1983;337:183–200. doi: 10.1113/jphysiol.1983.sp014619. [DOI] [PMC free article] [PubMed] [Google Scholar]
- Hübener M. Mouse visual cortex. Curr Opin Neurobiol. 2003;13:413–420. doi: 10.1016/s0959-4388(03)00102-8. [DOI] [PubMed] [Google Scholar]
- Huberman AD, Manu M, Koch SM, Susman MW, Lutz AB, Ullian EM, Baccus SA, Barres BA. Architecture and activity-mediated refinement of axonal projections from a mosaic of genetically identified retinal ganglion cells. Neuron. 2008;59:425–438. doi: 10.1016/j.neuron.2008.07.018. [DOI] [PMC free article] [PubMed] [Google Scholar]
- Humphries MM, Rancourt D, Farrar GJ, Kenna P, Hazel M, Bush RA, Sieving PA, Sheils DM, McNally N, Creighton P, Erven A, Boros A, Gulya K, Capecchi MR, Humphries P. Retinopathy induced in mice by targeted disruption of the rhodopsin gene. Nat Genet. 1997;15:216–219. doi: 10.1038/ng0297-216. [DOI] [PubMed] [Google Scholar]
- Jacobs GH, Neitz J, Deegan JF II. Retinal receptors in rodents maximally sensitive to ultraviolet light. Nature. 1991;353:655–656. doi: 10.1038/353655a0. [DOI] [PubMed] [Google Scholar]
- Jacobs GH, Williams GA, Fenwick JA. Influence of cone pigment coexpression on spectral sensitivity and color vision in the mouse. Vision Res. 2004;44:1615–1622. doi: 10.1016/j.visres.2004.01.016. [DOI] [PubMed] [Google Scholar]
- Jeon CJ, Strettoi E, Masland RH. The major cell populations of the mouse retina. J Neurosci. 1998;18:8936–8946. doi: 10.1523/JNEUROSCI.18-21-08936.1998. [DOI] [PMC free article] [PubMed] [Google Scholar]
- Kerschensteiner D, Liu H, Cheng CW, Demas J, Cheng SH, Hui CC, Chow RL, Wong RO. Genetic control of circuit function: Vsx1 and Irx5 transcription factors regulate contrast adaptation in the mouse retina. J Neurosci. 2008;28:2342–2352. doi: 10.1523/JNEUROSCI.4784-07.2008. [DOI] [PMC free article] [PubMed] [Google Scholar]
- Kim IJ, Zhang Y, Yamagata M, Meister M, Sanes JR. Molecular identification of a retinal cell type that responds to upward motion. Nature. 2008;452:478–482. doi: 10.1038/nature06739. [DOI] [PubMed] [Google Scholar]
- Kim KJ, Rieke F. Temporal contrast adaptation in the input and output signals of salamander retinal ganglion cells. J Neurosci. 2001;21:287–299. doi: 10.1523/JNEUROSCI.21-01-00287.2001. [DOI] [PMC free article] [PubMed] [Google Scholar]
- Krishna VR, Alexander KR, Peachey NS. Temporal properties of the mouse cone electroretinogram. J Neurophysiol. 2002;87:42–48. doi: 10.1152/jn.00489.2001. [DOI] [PubMed] [Google Scholar]
- Lee BB, Martin PR, Valberg A. Sensitivity of macaque retinal ganglion cells to chromatic and luminance flicker. J Physiol. 1989;414:223–243. doi: 10.1113/jphysiol.1989.sp017685. [DOI] [PMC free article] [PubMed] [Google Scholar]
- Li W, DeVries SH. Bipolar cell pathways for color and luminance vision in a dichromatic mammalian retina. Nat Neurosci. 2006;9:669–675. doi: 10.1038/nn1686. [DOI] [PubMed] [Google Scholar]
- Li W, Chen S, DeVries SH. A fast rod photoreceptor signaling pathway in the mammalian retina. Nat Neurosci. 2010;13:414–416. doi: 10.1038/nn.2507. [DOI] [PMC free article] [PubMed] [Google Scholar]
- Lyubarsky AL, Falsini B, Pennesi ME, Valentini P, Pugh EN., Jr UV- and midwave-sensitive cone-driven retinal responses of the mouse: a phenotype for coexpression of cone photopigments. J Neurosci. 1999;19:442–455. doi: 10.1523/JNEUROSCI.19-01-00442.1999. [DOI] [PMC free article] [PubMed] [Google Scholar]
- Lyubarsky AL, Daniele LL, Pugh EN., Jr From candelas to photoisomerizations in the mouse eye by rhodopsin bleaching in situ and the light-rearing dependence of the major components of the mouse ERG. Vision Res. 2004;44:3235–3251. doi: 10.1016/j.visres.2004.09.019. [DOI] [PubMed] [Google Scholar]
- Manookin MB, Beaudoin DL, Ernst ZR, Flagel LJ, Demb JB. Disinhibition combines with excitation to extend the operating range of the OFF visual pathway in daylight. J Neurosci. 2008;28:4136–4150. doi: 10.1523/JNEUROSCI.4274-07.2008. [DOI] [PMC free article] [PubMed] [Google Scholar]
- Manookin MB, Weick M, Stafford BK, Demb JB. NMDA receptor contributions to visual contrast coding. Neuron. 2010;67:280–293. doi: 10.1016/j.neuron.2010.06.020. [DOI] [PMC free article] [PubMed] [Google Scholar]
- Margolis DJ, Detwiler PB. Different mechanisms generate maintained activity in ON and OFF retinal ganglion cells. J Neurosci. 2007;27:5994–6005. doi: 10.1523/JNEUROSCI.0130-07.2007. [DOI] [PMC free article] [PubMed] [Google Scholar]
- Murphy GJ, Rieke F. Network variability limits stimulus-evoked spike timing precision in retinal ganglion cells. Neuron. 2006;52:511–524. doi: 10.1016/j.neuron.2006.09.014. [DOI] [PMC free article] [PubMed] [Google Scholar]
- Naarendorp F, Esdaille TM, Banden SM, Andrews-Labenski J, Gross OP, Pugh EN., Jr Dark light, rod saturation, and the absolute and incremental sensitivity of mouse cone vision. J Neurosci. 2010;30:12495–12507. doi: 10.1523/JNEUROSCI.2186-10.2010. [DOI] [PMC free article] [PubMed] [Google Scholar]
- Niell CM, Stryker MP. Highly selective receptive fields in mouse visual cortex. J Neurosci. 2008;28:7520–7536. doi: 10.1523/JNEUROSCI.0623-08.2008. [DOI] [PMC free article] [PubMed] [Google Scholar]
- Nikonov SS, Kholodenko R, Lem J, Pugh EN., Jr Physiological features of the S- and M-cone photoreceptors of wild-type mice from single-cell recordings. J Gen Physiol. 2006;127:359–374. doi: 10.1085/jgp.200609490. [DOI] [PMC free article] [PubMed] [Google Scholar]
- Nirenberg SA, Meister M. The light response of retinal ganglion cells is truncated by a displaced amacrine circuit. Neuron. 1995;18:637–650. doi: 10.1016/s0896-6273(00)80304-9. [DOI] [PubMed] [Google Scholar]
- Okawa H, Miyagishima KJ, Arman AC, Hurley JB, Field GD, Sampath AP. Optimal processing of photoreceptor signals is required to maximize behavioural sensitivity. J Physiol. 2010;588:1947–1960. doi: 10.1113/jphysiol.2010.188573. [DOI] [PMC free article] [PubMed] [Google Scholar]
- Pandarinath C, Bomash I, Victor JD, Prusky GT, Tschetter WW, Nirenberg S. A novel mechanism for switching a neural system from one state to another. Front Comput Neurosci. 2010a;4:2. doi: 10.3389/fncom.2010.00002. [DOI] [PMC free article] [PubMed] [Google Scholar]
- Pandarinath C, Victor JD, Nirenberg S. Symmetry breakdown in the ON and OFF pathways of the retina at night: functional implications. J Neurosci. 2010b;30:10006–10014. doi: 10.1523/JNEUROSCI.5616-09.2010. [DOI] [PMC free article] [PubMed] [Google Scholar]
- Pang JJ, Gao F, Wu SM. Light-evoked excitatory and inhibitory synaptic inputs to ON and OFF {alpha} ganglion cells in the mouse retina. J Neurosci. 2003;23:6063–6073. doi: 10.1523/JNEUROSCI.23-14-06063.2003. [DOI] [PMC free article] [PubMed] [Google Scholar]
- Pang JJ, Gao F, Lem J, Bramblett DE, Paul DL, Wu SM. Direct rod input to cone BCs and direct cone input to rod BCs challenge the traditional view of mammalian BC circuitry. Proc Natl Acad Sci U S A. 2010;107:395–400. doi: 10.1073/pnas.0907178107. [DOI] [PMC free article] [PubMed] [Google Scholar]
- Porciatti V, Pizzorusso T, Maffei L. The visual physiology of the wild type mouse determined with pattern VEPs. Vision Res. 1999;39:3071–3081. doi: 10.1016/s0042-6989(99)00022-x. [DOI] [PubMed] [Google Scholar]
- Prusky GT, Douglas RM. Characterization of mouse cortical spatial vision. Vision Res. 2004;44:3411–3418. doi: 10.1016/j.visres.2004.09.001. [DOI] [PubMed] [Google Scholar]
- Rohlich P, van Veen T, Szel A. Two different visual pigments in one retinal cone cell. Neuron. 1994;13:1159–1166. doi: 10.1016/0896-6273(94)90053-1. [DOI] [PubMed] [Google Scholar]
- Sagdullaev BT, McCall MA. Stimulus size and intensity alter fundamental receptive-field properties of mouse retinal ganglion cells in vivo. Vis Neurosci. 2005;22:649–659. doi: 10.1017/S0952523805225142. [DOI] [PubMed] [Google Scholar]
- Solomon SG, Tailby C, Cheong SK, Camp AJ. Linear and nonlinear contributions to the visual sensitivity of neurons in primate lateral geniculate nucleus. J Neurophysiol. 2010;104:1884–1898. doi: 10.1152/jn.01118.2009. [DOI] [PubMed] [Google Scholar]
- Soucy E, Wang Y, Nirenberg S, Nathans J, Meister M. A novel signaling pathway from rod photoreceptors to ganglion cells in mammalian retina. Neuron. 1998;21:481–493. doi: 10.1016/s0896-6273(00)80560-7. [DOI] [PubMed] [Google Scholar]
- Stone C, Pinto LH. Response properties of ganglion cells in the isolated mouse retina. Vis Neurosci. 1993;10:31–39. doi: 10.1017/s0952523800003205. [DOI] [PubMed] [Google Scholar]
- Szél A, Rohlich P, Caffe AR, Juliusson B, Aguirre G, van Veen T. Unique topographic separation of two spectral classes of cones in the mouse retina. J Comp Neurol. 1992;325:327–342. doi: 10.1002/cne.903250302. [DOI] [PubMed] [Google Scholar]
- Szél A, Lukáts A, Fekete T, Szepessy Z, Röhlich P. Photoreceptor distribution in the retinas of subprimate mammals. J Opt Soc Am A. 2000;17:568–579. doi: 10.1364/josaa.17.000568. [DOI] [PubMed] [Google Scholar]
- Tsukamoto Y, Morigiwa K, Ueda M, Sterling P. Microcircuits for night vision in mouse retina. J Neurosci. 2001;21:8616–8623. doi: 10.1523/JNEUROSCI.21-21-08616.2001. [DOI] [PMC free article] [PubMed] [Google Scholar]
- Umino Y, Solessio E, Barlow RB. Speed, spatial, and temporal tuning of rod and cone vision in mouse. J Neurosci. 2008;28:189–198. doi: 10.1523/JNEUROSCI.3551-07.2008. [DOI] [PMC free article] [PubMed] [Google Scholar]
- van Wyk M, Wässle H, Taylor WR. Receptive field properties of ON- and OFF-ganglion cells in the mouse retina. Vis Neurosci. 2009;26:297–308. doi: 10.1017/S0952523809990137. [DOI] [PMC free article] [PubMed] [Google Scholar]
- Völgyi B, Deans MR, Paul DL, Bloomfield SA. Convergence and segregation of the multiple rod pathways in mammalian retina. J Neurosci. 2004;24:11182–11192. doi: 10.1523/JNEUROSCI.3096-04.2004. [DOI] [PMC free article] [PubMed] [Google Scholar]
- Wang JS, Kefalov VJ. An alternative pathway mediates the mouse and human cone visual cycle. Curr Biol. 2009;19:1665–1669. doi: 10.1016/j.cub.2009.07.054. [DOI] [PMC free article] [PubMed] [Google Scholar]
- Wang L, Sarnaik R, Rangarajan K, Liu X, Cang J. Visual receptive field properties of neurons in the superficial superior colliculus of the mouse. J Neurosci. 2010;30:16573–16584. doi: 10.1523/JNEUROSCI.3305-10.2010. [DOI] [PMC free article] [PubMed] [Google Scholar]
- Wässle H, Puller C, Müller F, Haverkamp S. Cone contacts, mosaics, and territories of bipolar cells in the mouse retina. J Neurosci. 2009;29:106–117. doi: 10.1523/JNEUROSCI.4442-08.2009. [DOI] [PMC free article] [PubMed] [Google Scholar]
- Wei W, Elstrott J, Feller MB. Two-photon targeted recording of GFP-expressing neurons for light responses and live-cell imaging in the mouse retina. Nat Protoc. 2010;5:1347–1352. doi: 10.1038/nprot.2010.106. [DOI] [PMC free article] [PubMed] [Google Scholar]
- Wei W, Hamby AM, Zhou K, Feller MB. Development of asymmetric inhibition underlying direction selectivity in the retina. Nature. 2011;469:402–406. doi: 10.1038/nature09600. [DOI] [PMC free article] [PubMed] [Google Scholar]
- Yin L, Smith RG, Sterling P, Brainard DH. Chromatic properties of horizontal and ganglion cell responses follow a dual gradient in cone opsin expression. J Neurosci. 2006;26:12351–12361. doi: 10.1523/JNEUROSCI.1071-06.2006. [DOI] [PMC free article] [PubMed] [Google Scholar]
- Yonehara K, Balint K, Noda M, Nagel G, Bamberg E, Roska B. Spatially asymmetric reorganization of inhibition establishes a motion-sensitive circuit. Nature. 2011;469:407–410. doi: 10.1038/nature09711. [DOI] [PubMed] [Google Scholar]
- Zaghloul KA, Boahen K, Demb JB. Different circuits for ON and OFF retinal ganglion cells cause different contrast sensitivities. J Neurosci. 2003;23:2645–2654. doi: 10.1523/JNEUROSCI.23-07-02645.2003. [DOI] [PMC free article] [PubMed] [Google Scholar]
- Zaghloul KA, Boahen K, Demb JB. Contrast adaptation in subthreshold and spiking responses of mammalian Y-type retinal ganglion cells. J Neurosci. 2005;25:860–868. doi: 10.1523/JNEUROSCI.2782-04.2005. [DOI] [PMC free article] [PubMed] [Google Scholar]