Abstract
We have observed that, in renal proximal tubular cells, cardiotonic steroids such as ouabain in vitro signal through Na/K-ATPase, which results in inhibition of transepithelial 22Na+ transport by redistributing Na/K-ATPase and NHE3. In the present study, we investigate the role of Na/K-ATPase signaling in renal sodium excretion and blood pressure regulation in vivo. In Sprague-Dawley rats, high salt diet activated c-Src and induced redistribution of Na/K-ATPase and NHE3 in renal proximal tubules. In Dahl salt sensitive (S) and resistant (R) rats given high dietary salt, we found different effects on blood pressure but, more interestingly, different effects on renal salt handling. These differences could be explained by different signaling through the proximal tubular Na/K-ATPase. Specifically, in Dahl R rats, high salt diet significantly stimulated phosphorylation of c-Src and ERK1/2, reduced Na/K-ATPase activity and NHE3 activity, and caused redistribution of Na/K-ATPase and NHE3. In contrast, these adaptations were either much less effective or not seen in the Dahl S rats. We also studied the primary culture of renal proximal tubule isolated from Dahl S and R rats fed a low salt diet. In this system, ouabain induced Na/K-ATPase/c-Src signaling and redistribution of Na/K-ATPase and NHE3 in the Dahl R rats, but not in the Dahl S rats. Our data suggested that impairment of Na/K-ATPase signaling and consequent regulation of Na/K-ATPase and NHE3 in renal proximal tubule may contribute to salt-induced hypertension in the Dahl S rat.
Keywords: Na,K-ATPase; Signal Transduction; Sodium Transport; Sodium Proton Exchange; Src; Hypertension; Renal Proximal Tubule; Salt Sensitivity
Introduction
The Dahl salt-resistant (R) and -sensitive (S) strains were developed by selective breeding of the outbred Sprague-Dawley rat strain for resistance or susceptibility to the hypertensive effects of high dietary sodium (1). Whereas the blood pressure (BP)2 response to salt-loading in Dahl R and S rats involves many regulatory factors (2), it has been proposed that renal proximal tubule (RPT) Na+ handling may be a critical determinant of the different BP responses in these strains (3, 4).
Cardiotonic steroids (CTS) such as ouabain and marinobufagenin (MBG) appear to be involved in the regulation of BP and renal Na+ handling in vivo (5–7) as well as the ion handling of both primary cultures and proximal tubular cell lines in vitro (7–12). Based on this background, we performed the following studies to examine whether the proximal tubules of Dahl R and S rats had different responses to CTS.
MATERIALS AND METHODS
Animals
Male Sprague-Dawley rats (290–310 g body weight) were purchased from Charles River. Male, age-matched Dahl R (SS/JrHsd) and S (SR/JrHsd) rats were bred and maintained in-house and used at the age of 12–14 weeks. Rats were maintained with 12 h dark/light cycle and had ad libitum access to the food (Teklad Laboratory animal diets from Harlan Laboratories) and water. All animal experimentation was conducted in accordance with the National Institutes of Health Guide for the Care and Use of Laboratory Animals using protocols approved by the University of Toledo Institutional Animal Use and Care Committee.
Chemicals and Antibodies
All chemicals, except otherwise mentioned, were obtained from Sigma-Aldrich. EZ-Link sulfo-NHS-ss-biotin and ImmunoPure immobilized streptavidin-agarose beads were from Pierce Biotechnology. Antibodies against Rab7, integrin-β1, and c-Src were from Santa Cruz Biotechnology (Santa Cruz, CA). Monoclonal antibody against the Na/K-ATPase α1 subunit (clone α6F) was from the Developmental Studies Hybridoma Bank at the University of Iowa (Iowa City, IA). Monoclonal antibodies against NHE3 (clone 4F5) and early endosome antigen-1 (EEA-1) were from Millipore Chemicon (Temecula, CA). Polyclonal anti-Src [pY418] phosphospecific antibody was from Invitrogen (Camarillo, CA). Antibodies against phosphor-p44/42 ERK1/2 (Thr202/Tyr204) and p44/42 were from Cell Signaling Technology (Danvers, MA). Type 2 collagenase (activity of 323U/mg) was from Worthington Biochemical Corp (Lakewood, NJ). Sterile Percoll was from GE Healthcare (Piscataway, NJ). Biomol Green was from BIOMOL Research Laboratories (Plymouth Meeting, PA). Radioactive 22Na+ was from DuPont NEN Life Science (Boston, MA).
Experimental Groups and Treatments
For salt-loading studies in Sprague-Dawley rats, the rats were randomly divided into two groups (10 rats per group) after adjustment to the new environment. The rats were then fed with 0.3% NaCl (as low salt diet) or 4% NaCl chow for 7 days.
For salt-loading studies in Dahl rats, age-matched, male R and S rats (total 48 rats) were given either 0.3% NaCl (low salt, LS, n = 12 per strain) or 2% NaCl (high salt, HS, n = 12 per strain) diet for 7 days. Only 2% NaCl loading was used with the Dahl rats because of the profound effects on BP and food consumption (inferred from urinary Na+ excretion data, see Table 2) salt-loading has on the S animals.
TABLE 2.
HS diet (2% NaCl, 7 days) caused differential regulation between the R and S rats
Absolute Na+ excretion (UNa+V) was calculated as Urine Na+ × 24-h urine volume. Fractional Na+ excretion (FENa+) was calculated as 100 × (Urine Na+ × Plasma creatinine)/(Plasma Na+ × Urine creatinine). Creatinine clearance was calculated as (Urine creatinine × 24-h urine volume)/(Plasma creatinine × 24 × 60 min). **, p < 0.01 compared to control low salt diet (LS, 0.3% NaCl) of the same strain. #, p < 0.01 the R rats with HS compared to the S rats with HS. n = rat number, per treatment, per group.
| Strain | LS | HS | |
|---|---|---|---|
| BP | R | 133 ± 2.2 (n = 12) | 134 ± 2.6# (n = 12) |
| S | 146 ± 3.1 (n = 12) | 169 ± 5.6** (n = 12) | |
| Plasma Na+ | R | 145 ± 2.8 (n = 12) | 146 ± 1.4 (n = 12) |
| S | 146 ± 2.1 (n = 12) | 147 ± 3.6 (n = 12) | |
| Plasma K+ | R | 8.7 ± 1.8 (n = 12) | 8.6 ± 1.3 (n = 12) |
| S | 8.8 ± 1.4 (n = 12) | 8.7 ± 1.5 (n = 12) | |
| UNa+V (mmol/24 h) | R | 2.9 ± 0.6 (n = 8) | 20.1 ± 1.6**,# (n = 8) |
| S | 2.7 ± 0.25 (n = 8) | 6.5 ± 1.0** (n = 8) | |
| FENa+ | R | 0.073 ± 0.008 (n = 8) | 0.287 ± 0.064**,# (n = 8) |
| S | 0.071 ± 0.004 (n = 8) | 0.132 ± 0.021** (n = 8) | |
| Creatinine clearance (ml/min) | R | 1.99 ± 0.14 (n = 8) | 2.66 ± 0.38 (n = 8) |
| S | 2.06 ± 0.32 (n = 8) | 2.67 ± 0.64 (n = 8) |
Tail-cuff Measurement of BP
At days 0 and 7, BP was measured in conscious rats by the tail-cuff plethysmography with the aid of a computerized system (Amplifier model 229, Monitor model 31, Test chamber Model 306; IITC Life Science). All rats were first trained for BP measurement over a period of 2 days before day 0 to accustom them to the apparatus and restraint (13). After that, the actual BP (average of at least three measurements) was recorded.
Isolation and Primary Culture of RPTs
RPTs were isolated from the outer cortices as described by Vinay et al. (14) with minor modifications. Briefly, harvested kidneys were decapsulated and rinsed with ice-cold oxygenized PBS. Cortices were dissected, minced, and digested in digesting solution (oxygenized DMEM with 1 mg/ml collagenase Type 2, 0.5% filtered BSA Fraction V) four times at 37 °C, 15 min each. Pooled tubular segments were further separated with 42% Percoll gradient (pH 7.4), and the RPT segments were collected from the lowest two bands. The enrichment and purity of RPT isolation was determined by measuring RPT brush-border membrane vehicles (BBMVs) marker enzyme alkaline phosphatase activity (∼10-fold increases).
For in vitro primary culture, RPTs were isolated from R and S rats fed with low salt diet. Isolated RPTs were cultured in collagen I-coated culture dishes in DMEM/F-12 medium (1:1 mixture, with 10% FBS and insulin-transferrin-sodium selenite media supplement, Sigma) until 90–100% confluency in a 5% CO2-humidified incubator. Before ouabain treatment, cells were serum-starved (cultured in medium with 0.5% FBS) for 16–18 h.
Cell Fractionation and Biochemical Studies
Early endosome (EE, EEA-1- and Rab5-positive) and late endosome (LE, Rab7-positive) fractions were isolated by sucrose flotation centrifugation as previously reported (7, 15). The enrichment of EE and LE fractions was assessed by the EE marker EEA1 and LE marker Rab7, respectively; Equal amounts of total proteins from EE or LE fraction of each sample were precipitated with trichloroacetic acid for subsequent Western blot. Surface biotinylation studies were conducted as previously described (8, 15). Crude membrane isolation and Na/K-ATPase enzymatic activity determinations (each performed in triplicate) were performed as previously described (9). The ouabain-sensitive Na/K-ATPase activity assay was performed by measuring the Pi released from hydrolysis of ATP. Before assay, the samples were treated with alamethicin (1:10, μg:μg, alamethicin: protein) for 30 min on ice and exposed to about 100× volume reaction solution.
RPT BBMVs Preparation and NHE3 Activity Assay (22Na+ Uptake)
RPT BBMVs were prepared from isolated RPTs using the protocol described by Murer's Laboratory (16). After homogenization, BBMVs were isolated with Mg2+ precipitation method (final concentration of MgCl2 is 12 mm, 15 min on ice) and differential centrifugation. Alkaline phosphatase activity was enriched ∼10-fold by this procedure. NHE3 activity (H+-driven 22Na+ uptake) in RPT BBMVs was determined in triplicate using the filtration protocol described by Moe's Laboratory (17).
Measurement of c-Src Phosphorylation
RPT whole cell lysates were prepared with Nonidet P-40 buffer containing 1% Nonidet P-40, 0.25% sodium deoxycholate, 50 mm NaCl, 50 mm HEPES, 10% glycerol (pH 7.4), 1 mm sodium vanadate, 0.5 mm sodium fluoride, 1 mm phenylmethanesulfonyl fluoride, and protease inhibitor mixture for general use (Sigma). After clarification, 300 μg of total protein was immunoprecipitated with antibody against c-Src and protein G-agarose beads (Millipore), and then eluted with 2× Laemmli buffer. After immunoblotting for phospho-c-Src (p-Src), the same membrane was stripped and immunoblotted for total c-Src (t-Src). The activation of c-Src was expressed as ratio of p-Src/t-Src with both measurements normalized to 1.0 for the control samples.
Western Blotting
For Western blot analysis, equal amounts of total protein were resolved by 10% SDS-PAGE and immunoblotted with indicated antibodies. The same membrane was also immunoblotted with antibodies against integrin-β1 (for surface biotinylation) or EEA-1 (for EE fractionation) to serve as loading controls, respectively. Signal detection was performed with an enhanced chemiluminescence super signal kit (Pierce). Multiple exposures were analyzed to assure that the signals were within the linear range of the film. The signal density was determined using Molecular Analyst software (Bio-Rad).
Statistical Analysis
Data were tested for normality (all data passed) and then subjected to parametric analysis. When more than two groups were compared, one-way ANOVA was performed prior to comparison of individual groups, and the post-hoc t-tests were adjusted for multiple comparisons using Bonferroni's correction. Statistical significance was reported at the p < 0.05 and p < 0.01 levels. SPSS software was used for all analysis. Values are given as mean ± S.E (18).
RESULTS
Effect of High Salt Diet on RPT Na/K-ATPase and NHE3 in Sprague-Dawley Rats
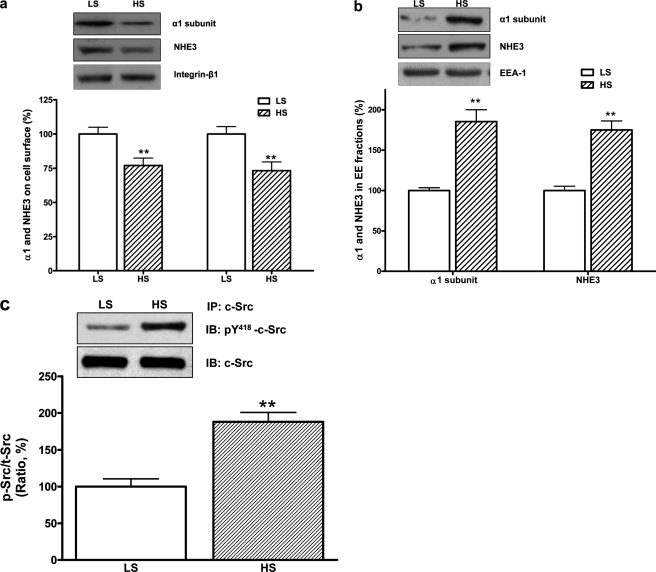
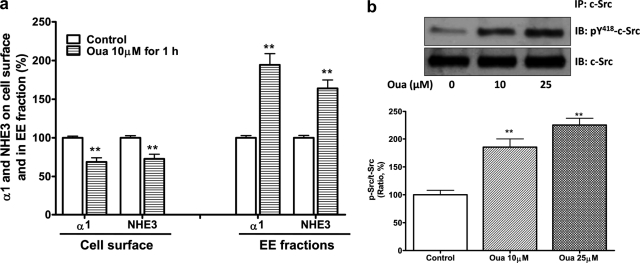
As shown in Table 1, the high salt diet significantly increased absolute urinary Na+ excretion compared with control rats. The high salt diet also had a small effect on systolic BP. The high salt diet reduced the Na/K-ATPase activity in RPT crude plasma membrane fractions and NHE3 activity in RPT BBMVs (Table 1). To assess the redistribution of the Na/K-ATPase α1 subunit and NHE3 in RPT, the protein contents on cell surface (assayed by cell surface biotinylation) and in isolated EE fraction were determined as described under “Materials and Methods.” The high salt diet not only decreased RPT surface contents of both transporters (Fig. 1a), but also caused both transporters in RPTs to accumulate in the EE fraction (Fig. 1b). The inhibition of the Na/K-ATPase activity and NHE3 activity was well correlated with reduced protein content of the α1 subunit and NHE3 on the cell surface. Furthermore, the high salt diet stimulated c-Src phosphorylation in RPT whole cell lysates (Fig. 1c). RPT primary cultures isolated from control rats fed with low salt diet were treated with ouabain or vehicle. Ouabain treatment (10 μmol/liter for 1 h) accumulated the α1 subunit and NHE3 in the EE fractions, reduced the surface protein content of these two ion transporters (Fig. 2a), and caused an inhibition of both Na/K-ATPase activity (in μmol/mg protein/hour, control 58.9 ± 3.6 versus ouabain 48.1 ± 3.1, n = 4, p < 0.01 compared with control) and NHE3 activities by measuring H+-driven 22Na+ uptake (in relative value, control 100 ± 4.5 versus ouabain-treated 76.5 ± 6.8, n = 4, p < 0.01 compared with control). Moreover, ouabain (10 or 25 μmol/liter for 5 min) stimulated c-Src phosphorylation (Fig. 2b).
TABLE 1.
The effect of an HS diet (4% NaCl for 7 days) on Sprague Dawley rats
Absolute Na+ excretion (UNa+V) was calculated as urinary Na+ concentration x 24-h urine volume. The Na/K-ATPase activity was measured from isolated RPT crude heavy membrane fractions and expressed as μmol/mg protein/hour from four independent experiments (each performed in triplicate). NHE3 activity (22Na+ uptake) in BBMVs was measured from isolated RPTs and expressed as relative values (%, control was normalized as 100%) from four independent experiments (each performed in triplicate). **, p < 0.01 compared to control rats fed with low salt diet (LS, 0.3% NaCl). n = rat number (for UNa+V and BP) or experiment number (for Na/K-ATPase and NHE3 activity).
| UNa+V | BP | Na/K-ATPase activity | NHE3 activity | |
|---|---|---|---|---|
| mmol/24 h | mmHg | % | ||
| LS | 2.7 ± 0.4 (n = 10) | 102.6 ± 2.5 (n = 10) | 56.4 ± 4.2 (n = 4) | 100 ± 4.8 (n = 4) |
| HS | 18.1 ± 1.7 (n = 10)** | 115.3 ± 3.2 (n = 10)** | 40.2 ± 6.8 (n = 4)** | 67.6 ± 10.5 (n = 4)** |
FIGURE 1.
HS diet activated RPT c-Src and stimulated redistribution of RPT Na/K-ATPase α1 and NHE3. In Sprague-Dawley rats, 7-day HS (4% NaCl) reduced RPT cell surface contents of the α1 subunit and NHE3, n = 5 (a), accumulated the α1 subunit and NHE3 in RPT EE fractions, n = 5 (b), and stimulated c-Src phosphorylation in RPT whole cell lysates, n = 4. The c-Src phosphorylation was expressed as the ratio of phosphorylated c-Src (p-Src, measured by anti-c-Src pY418 antibody) versus total c-Src (t-Src) (c). **, p < 0.01 compared with control rats fed with low salt diet (LS, 0.3% NaCl). RPT isolation, surface biotinylation and EE fraction isolation from control and treated rats were conducted in pairs concurrently. Immunoblotting of integrin-β1 and EEA-1 served as loading control for surface biotinylation and EE fraction, respectively.
FIGURE 2.
Ouabain activated RPT c-Src and stimulated redistribution of RPT Na/K-ATPase α1 and NHE3. In RPT primary culture derived from Sprague-Dawley rats fed with low salt diet (0.3% NaCl), ouabain treatment (Oua, 10 μmol/liter for 1 h) not only caused redistribution of the Na/K-ATPase α1 subunit and NHE3, n = 5 (a), but it (Oua, 10 and 25 μmol/liter for 5 min) also stimulated RPT c-Src phosphorylation, n = 4 (b). **, p < 0.01 compared with control. The experiments in a were performed as in Fig. 1, with integrin-β1 and EEA-1 as loading control.
Effect of High Salt Diet on RPT Na/K-ATPase and NHE3 from Dahl R and S Rats
Male age-matched Dahl R and S rats were given a low salt (0.3% NaCl, n = 12 per strain) or high salt (2% NaCl, n = 12 per strain) diet for 7 days. As briefly mentioned earlier, we used only a 2% high salt diet as the Dahl S (but not R) rats showed profound increases in blood pressure as well as very substantial decreases in food consumed as evidenced by the relative decrease in UNa+V compared with the R rats (Table 2). There were no significant differences among the groups in the plasma concentrations of Na+ and K+ at the end of the experiments. These and additional data are summarized in Table 2.
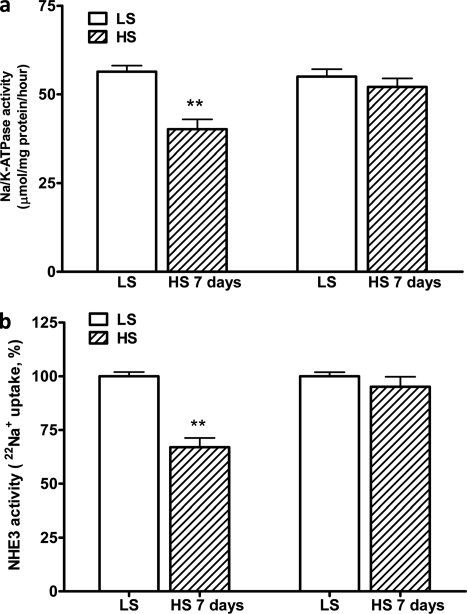
In the isolated RPTs from Dahl R and S rats fed a low salt diet, there were no differences in the expression of Na/K-ATPase α1 subunit and NHE3 or Na/K-ATPase and NHE3 activities. High salt diet has no significant effect on total expression of Na/K-ATPase α1 and NHE3 in isolated RPTs from the R and S rats (data not shown). However, the high salt diet significantly decreased both Na/K-ATPase and NHE3 activities in the R but not the S rats (Fig. 3).
FIGURE 3.
HS diet caused decreases in the activities of the Na/K-ATPase and NHE3 in Dahl R rats. In Dahl R but not S rats, HS (2% NaCl for 7 days) decreased both the Na/K-ATPase activity in RPT crude heavy membrane fractions (a) and NHE3 activity in RPT BBMVs (b). Male, age-matched Dahl R and S rats were paired for salt-loading study. Crude heavy plasma membrane fractions and RPT BBMVs were prepared from isolated RPTs at the end of experiments. The Na/K-ATPase enzymatic activity (expressed as μmol/mg protein/hour) and relative NHE3 activity (H+-driven 22Na+ uptake) were measured as described under “Materials and Methods.” n = 6. **, p < 0.01 compared with control rats fed with low salt diet (LS, 0.3% NaCl).
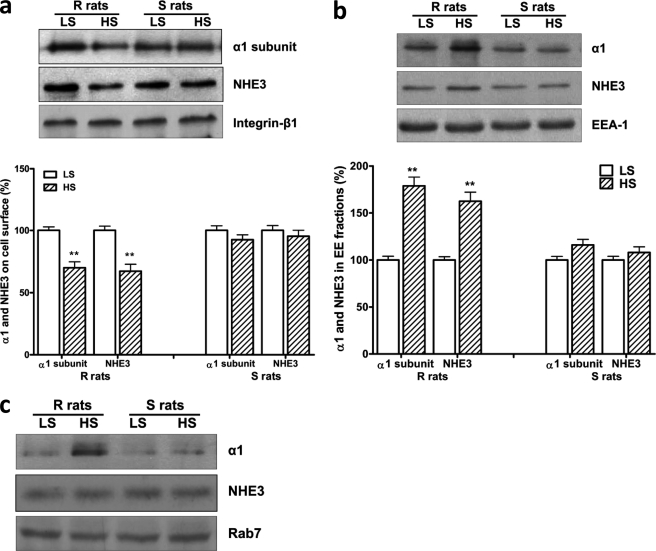
In the isolated RPTs from the R rats, the high salt diet not only decreased the RPT surface content of both Na/K-ATPase α1 and NHE3 (Fig. 4a) but also caused the accumulation of both transporters in the EE fraction (Fig. 4b). Interestingly, the high salt diet did not cause redistribution of the α1 subunit and NHE3 in the S rat RPTs (Fig. 4, a and b). While the high salt diet caused the α1 subunit to also accumulate in the LE fractions in the R rats (relative to control 100 ± 3.5, high salt diet 246.5 ± 7.6, n = 3, p < 0.01), the NHE3 did not accumulate in the LE fraction (Fig. 4c). This suggests that the NHE3, which moves to the EE fraction remains available for recycling, but in any case does not accumulate in the LE fraction.
FIGURE 4.
HS diet stimulated redistribution of the Na/K-ATPase α1 and NHE3 in Dahl R rats. In Dahl rats, HS caused redistribution of the Na/K-ATPase α1 and NHE3 in RPTs isolated from the R rats, but not the S rats. Male, age-matched Dahl R and S rats were paired for salt-loading study. Cell surface α1 subunit and NHE3 were determined by surface biotinylation (a) with integrin-β1 blotting as loading control, and internalized α1 subunit and NHE3 were determined by the protein content in EE fractions (b) with EEA-1 blotting as loading control. n = 6. **, p < 0.01 compared with control rats fed with low salt diet (LS, 0.3% NaCl). In LE fractions, HS accumulated α1 subunit only in the R rats, but NHE3 protein content was not significantly affected by HS in both R and S rats (c). Rab7 blotting served as loading control.
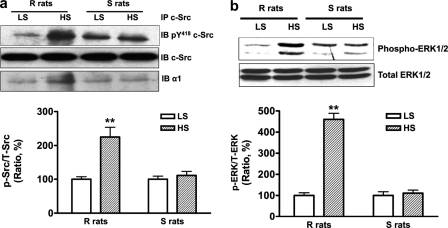
In the RPTs isolated from the R but not the S rats, high salt diet stimulated activation of c-Src (Fig. 5a) and ERK1/2 (Fig. 5b). In the same immunoprecipitation studies shown in Fig. 5a, high salt diet also significantly enhanced association between c-Src and Na/K-ATPase α1 (relative to the low salt control diet 100 ± 3.7, high salt diet 184.6 ± 9.3, n = 3, p < 0.01) in the R rats, but not in the S rats.
FIGURE 5.
HS diet activated c-Src and ERK1/2 and enhanced association between c-Src and the α1 subunit in RPTs of the R rats, but not the S rats. a, HS stimulated c-Src phosphorylation and its association with the α1 subunit. b, HS activated ERK1/2. Values are expressed relative to a control value of 100. n = 4. **, p < 0.01 compared with control rats fed with low salt diet (LS, 0.3% NaCl). The phosphorylation of c-Src and ERK1/2 was expressed as the ratio of phosphorylated c-Src (p-Src) and ERK1/2 (p-ERK) versus total c-Src (t-Src) and ERK1/2 (t-ERK), respectively.
Effects of Ouabain on RPT Primary Cultures Derived from Dahl R and S Rats
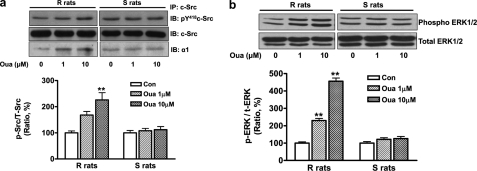
RPTs were isolated from age-matched male R and S rats (20 R rats and 20 S rats) fed with a low salt diet (0.3% NaCl), and cultured to reach confluence. As observed in salt-loading experiment with intact animals, ouabain treatment also caused differential regulations in the RPT primary culture derived from the R and S rats. Whereas ouabain demonstrated no regulatory effect in the RPTs derived from the S rats, ouabain had dramatic consequences in the RPTs derived from the R rats. Specifically, ouabain treatment (10 μmol/liter for 1 h) caused the accumulation of the α1 subunit and NHE3 in the EE fractions (Fig. 6a); reduced the surface protein content of these two ion transporters (Fig. 6b); and inhibited both the membrane Na/K-ATPase and NHE3 activities in RPT crude membrane fraction and BBMVs, respectively (Table 3). Moreover, ouabain treatment (1 and 10 μmol/liter for 5 min) stimulated phosphorylation of c-Src and ERK1/2 (Fig. 7, a and b). In the same immunoprecipitation studies shown in Fig. 7a, ouabain also enhanced the association between c-Src and Na/K-ATPase α1 (in values relative to control 100 ± 4.2, ouabain 1 μmol/liter 167.6 ± 8.2 and ouabain 10 μmol/liter 192.8 ± 6.3, n = 4, both p < 0.01 compared with control) in the R rats. No significant association between c-Src and Na/K-ATPase α1 was observed in the S rats in response to either dose of ouabain.
FIGURE 6.
Ouabain treatment (Oua, 10 μmol/liter for 1 h) caused redistribution of the Na/K-ATPase and NHE3 in RPT primary culture of the R rats, but not the S rats. RPTs were isolated from the R and S rats fed with low salt (0.3% NaCl) diet. Cell surface NHE3 and α1 subunit were determined by surface biotinylation (a), and internalized NHE3 and α1 subunit were determined by the protein content in EE fractions (b). n = 4. **, p < 0.01 compared with control. Immunoblotting of integrin-β1 and EEA-1 served as loading control for surface biotinylation and EE fraction, respectively.
TABLE 3.
The effect of ouabain on the Na/K-ATPase activity and NHE3 activity in RPT primary cultures derived from the R and S rats
RPTs were isolated from the R and S rats fed with low salt (0.3% NaCl) diet and cultured as described under “Materials and Methods.” After ouabain treatment, cells were washed three times with ice-cold 1× PBS before isolation of crude heavy membrane fractions and BBMVs. The Na/K-ATPase enzymatic activity in crude heavy membrane fractions was expressed as μmol/mg protein/hour from four independent experiments (each performed in triplicate). NHE3 activity (22Na+ uptake) in BBMVs was expressed as relative values (% of control as 100%) from four independent experiments (each performed in triplicate). **, p < 0.01 compared to control.
| Strain | Control | Ouabain | |
|---|---|---|---|
| 10 μmol/liter, 1h | |||
| Na/K-ATPase activity | R | 61.2 ± 3.6 (n = 4) | 46.8 ± 3.5** (n = 4) |
| S | 60.8 ± 4.1 (n = 4) | 57.9 ± 4.5 (n = 4) | |
| NHE3 activity (%) | R | 100 ± 5.2 (n = 4) | 71.2 ± 5.5** (n = 4) |
| S | 100 ± 6.1 (n = 4) | 96.4 ± 6.5 (n = 4) |
FIGURE 7.
Ouabain activated c-Src and ERK1/2 and enhanced association between c-Src and the α1 subunit in RPTs of the R rats, but not the S rats. RPTs were isolated from the R and S rats fed with low salt (0.3% NaCl) diet. Ouabain treatments (Oua, 1 and 10 μmol/liter for 5 min) stimulated c-Src phosphorylation and its association with the α1 subunit (a) and activated ERK1/2 (b). Values are expressed relative to a control value of 100. n = 4. **, p < 0.01.
DISCUSSION
The significance of endogenous CTS functioning as natriuretic hormones by inhibiting the renal Na/K-ATPase has been a subject of debate for some time (19). While volume expansion is considered to be the main cause of the salt-sensitive hypertension in the S rats (2, 20), accumulating evidence, some from our laboratories, suggest that endogenous CTS regulate renal Na+ handling and BP through the Na/K-ATPase signaling (5, 6, 21–26). A role for endogenous CTS in salt sensitive hypertension has also been suggested by a number of authors (10, 27–29). On this background, the Dahl R and S rats have been extensively studied for insight into the pathogenesis of salt sensitive hypertension. Fedorova et al. (5, 6) have established that increases in circulating MBG are, in fact, greater during acute and chronic salt-loading in Dahl S as compared with R rats.
In the current study, we observed that the outbred Sprague-Dawley rats developed redistribution of the Na/K-ATPase in RPTs in response to a shift to a high salt diet. As we have previously observed (7), this redistribution of the Na/K-ATPase appears to depend on increases in the production of the CTS, MBG. In addition to what we had previously seen, we also noted what appeared to be a coordinated redistribution of the apical NHE3 into the EE but not LE fraction, a phenomenon, which we have documented to be a consequence of Na/K-ATPase-c-Src signaling in LLC-PK1 cells (15). Interestingly, works from the laboratory of McDonough using immunofluorescence have shown that a high salt diet causes the redistribution of NHE3 to a deeper portion of microvilli whereas this high salt diet causes the sodium-phosphate cotransporter to move completely into cells (30). We believe that our data with the NHE3 are consistent with this report.
We further demonstrated that CTS signaling also appeared to occur in a similar fashion in Dahl R but not S rats. Specifically, we saw that high salt diet induced redistribution of the Na/K-ATPase and NHE3 along with evidence for c-Src and ERK1/2 activation in RPTs isolated from the Dahl R but not S rats. Impaired CTS signaling in the RPTs of the S rats was further implicated by the failure of these RPTs isolated from the S rats on a low salt diet to show ouabain signaling in vitro, which was readily apparent in parallel studies performed in the RPTs isolated from the R rats. As the S rats developed profound hypertension when dietary Na+ is increased to 2% whereas the R rat demonstrated little change in BP with this dietary manipulation, these data implicated the CTS-Na/K-ATPase-c-Src signal cascade in the control of BP in these animals. Furthermore, since the S rats develop greater increases in the production of as well as circulating levels of CTS following increases in dietary Na+ (5, 6), diminished sensitivity of the signaling cascade to CTS would appear to be involved. However, as the α1 subunit sequence of the Na/K-ATPase does not differ between Dahl S and R rats (31), one must implicate the environment of the signaling Na/K-ATPase and/or the interactions between the Na/K-ATPase and its signaling partners (32).
We believe that these data are interesting for several reasons. First, they implicate CTS in the pathogenesis of salt sensitive hypertension by a renal mechanism, namely the failure of the Dahl S to demonstrate the normal response to CTS seen with the Dahl R and the outbred Sprague-Dawley rats. This may give pause to implementing the therapeutic strategy of antagonizing CTS-Na/K-ATPase signaling in vascular tissue which has been proposed by pioneering workers in this field (10, 11). Second, these data suggest that CTS may induce increases in renal sodium excretion by multiple mechanisms. Specifically, these agents may increase vascular resistance as others have demonstrated (33–35) while also working through the renal mechanism discussed above. Although other hormonal systems no doubt interact with both of these pathways, such as the opposite effect of atrial natriuretic peptides on MBG-induced regulation of Na/K-ATPase activity in renal medulla and aortic rings (36), it does appear that the vascular mechanism is much more intact in the Dahl S rats suggesting that the molecular mechanisms of CTS signaling might be different in these different tissues. Whether this is explained by Na/K-ATPase isoform differences, differences in specific CTS and/or mechanistic differences in the way that CTS signal in vascular as compared with renal tissues is still quite unclear. On this latter point, we might speculate that the classic ionic signal mechanism involving actual pump inhibition might dominate in vascular tissue as proposed by Blaustein and Hamlyn (10) whereas the CTS-c-Src signaling might be more important in the RPTs. Of course, further work must be done to address this complex area. Last, these data might possibly provide the basis for developing a tool for clinical practice. If the sensitivity of the Na/K-ATPase-c-Src signaling pathway to CTS is something that is impaired either on a genetic or acquired basis, it might be possible to use this phenomenon to develop a biomarker for salt-sensitive hypertension.
This work was supported, in whole or in part, by Grants GM78565 and HL36573 (to Z. X.) and HL020176 and HL076709 (to B. J.) from the National Institutes of Health and the American Heart Association Ohio Valley Affiliate (to J. L.).
- BP
- blood pressure
- CTS
- cardiotonic steroids
- EE
- early endosome
- ERK1/2
- extracellular signal-regulated kinases 1 and 2
- MBG
- marinobufagenin
- NHE3
- sodium/hydrogen exchanger isoform 3
- RPT
- renal proximal tubule
- HS
- high salt diet
- LS
- low salt diet.
REFERENCES
- 1. Dahl L. K., Heine M., Tassinari L. (1962) Nature 194, 480–482 [DOI] [PubMed] [Google Scholar]
- 2. Rapp J. P. (1982) Hypertension 4, 753–763 [DOI] [PubMed] [Google Scholar]
- 3. Dahl L. K., Heine M., Thompson K. (1974) Circ. Res. 40, 94–101 [DOI] [PubMed] [Google Scholar]
- 4. Dahl L. K., Knudsen K. D., Iwai J. (1969) Circ. Res. 24, (suppl.) 21–33 [PubMed] [Google Scholar]
- 5. Fedorova O. V., Talan M. I., Agalakova N. I., Lakatta E. G., Bagrov A. Y. (2002) Circulation 105, 1122–1127 [DOI] [PubMed] [Google Scholar]
- 6. Fedorova O. V., Lakatta E. G., Bagrov A. Y. (2000) Circulation 102, 3009–3014 [DOI] [PubMed] [Google Scholar]
- 7. Periyasamy S. M., Liu J., Tanta F., Kabak B., Wakefield B., Malhotra D., Kennedy D. J., Nadoor A., Fedorova O. V., Gunning W., Xie Z., Bagrov A. Y., Shapiro J. I. (2005) Kidney Int. 67, 1868–1877 [DOI] [PubMed] [Google Scholar]
- 8. Liu J., Kesiry R., Periyasamy S. M., Malhotra D., Xie Z., Shapiro J. I. (2004) Kidney Int. 66, 227–241 [DOI] [PubMed] [Google Scholar]
- 9. Liu J., Periyasamy S. M., Gunning W., Fedorova O. V., Bagrov A. Y., Malhotra D., Xie Z., Shapiro J. I. (2002) Kidney Int. 62, 2118–2125 [DOI] [PubMed] [Google Scholar]
- 10. Blaustein M. P., Hamlyn J. M. (2010) Biochim. Biophys. Acta 1802, 1219–1229 [DOI] [PMC free article] [PubMed] [Google Scholar]
- 11. Yuan C., Manunta P., Chen S., Hamlyn J. M., Haddy F. J., Pamnani M. B. (1993) J. Cardiovasc. Pharmacol. 22, Suppl. 2, S10–S12 [DOI] [PubMed] [Google Scholar]
- 12. Blaustein M. P., Hamlyn J. M. (1991) Hypertension 18, III184–195 [DOI] [PubMed] [Google Scholar]
- 13. Kennedy D. J., Vetteth S., Periyasamy S. M., Kanj M., Fedorova L., Khouri S., Kahaleh M. B., Xie Z., Malhotra D., Kolodkin N. I., Lakatta E. G., Fedorova O. V., Bagrov A. Y., Shapiro J. I. (2006) Hypertension 47, 488–495 [DOI] [PubMed] [Google Scholar]
- 14. Vinay P., Gougoux A., Lemieux G. (1981) Am. J. Physiol. 241, F403–F411 [DOI] [PubMed] [Google Scholar]
- 15. Cai H., Wu L., Qu W., Malhotra D., Xie Z., Shapiro J. I., Liu J. (2008) Am. J. Physiol. Cell Physiol. 294, C555–C563 [DOI] [PubMed] [Google Scholar]
- 16. Biber J., Stieger B., Stange G., Murer H. (2007) Nat. Protoc. 2, 1356–1359 [DOI] [PubMed] [Google Scholar]
- 17. Bacic D., Kaissling B., McLeroy P., Zou L., Baum M., Moe O. W. (2003) Kidney Int. 64, 2133–2141 [DOI] [PMC free article] [PubMed] [Google Scholar]
- 18. Wallenstein S., Zucker C. L., Fleiss J. L. (1980) Circ. Res. 47, 1–9 [DOI] [PubMed] [Google Scholar]
- 19. Bagrov A. Y., Shapiro J. I., Fedorova O. V. (2009) Pharmacol. Rev. 61, 9–38 [DOI] [PMC free article] [PubMed] [Google Scholar]
- 20. Roman R. J., Osborn J. L. (1987) Am. J. Physiol. 252, R833–841 [DOI] [PubMed] [Google Scholar]
- 21. Loreaux E. L., Kaul B., Lorenz J. N., Lingrel J. B. (2008) J. Am. Soc. Nephrol. 19, 1947–1954 [DOI] [PMC free article] [PubMed] [Google Scholar]
- 22. Nesher M., Dvela M., Igbokwe V. U., Rosen H., Lichtstein D. (2009) Am. J. Physiol. Heart Circ. Physiol. 297, H2026–H2034 [DOI] [PubMed] [Google Scholar]
- 23. Dostanic I., Paul R. J., Lorenz J. N., Theriault S., Van Huysse J. W., Lingrel J. B. (2005) Am. J. Physiol. Heart Circ. Physiol. 288, H477–H485 [DOI] [PubMed] [Google Scholar]
- 24. Zhang J., Lee M. Y., Cavalli M., Chen L., Berra-Romani R., Balke C. W., Bianchi G., Ferrari P., Hamlyn J. M., Iwamoto T., Lingrel J. B., Matteson D. R., Wier W. G., Blaustein M. P. (2005) J. Physiol. 569, 243–256 [DOI] [PMC free article] [PubMed] [Google Scholar]
- 25. Fedorova O. V., Shapiro J. I., Bagrov A. Y. (2010) Biochim. Biophys. Acta (BBA) – Mol. Basis Dis. 1802, 1230–1236 [DOI] [PMC free article] [PubMed] [Google Scholar]
- 26. Liu J., Xie Z. J. (2010) Biochim. Biophys. Acta (BBA) – Mol. Basis Dis. 1802, 1237–1245 [DOI] [PMC free article] [PubMed] [Google Scholar]
- 27. Ritz E. (2010) Nephrology 15, Suppl. 2, 49–52 [DOI] [PubMed] [Google Scholar]
- 28. Jaitovich A., Bertorello A. M. (2010) Life Sci. 86, 73–78 [DOI] [PubMed] [Google Scholar]
- 29. Schoner W., Scheiner-Bobis G. (2008) Nephrol. Dial Transplant. 23, 2723–2729 [DOI] [PubMed] [Google Scholar]
- 30. Yang L. E., Sandberg M. B., Can A. D., Pihakaski-Maunsbach K., McDonough A. A. (2008) Am. J. Physiol. Renal Physiol. 295, F1003–F1016 [DOI] [PMC free article] [PubMed] [Google Scholar]
- 31. Mokry M., Cuppen E. (2008) Hypertension 51, 922–927 [DOI] [PubMed] [Google Scholar]
- 32. Pierre S. V., Xie Z. (2006) Cell Biochem. Biophys. 46, 303–316 [DOI] [PubMed] [Google Scholar]
- 33. Kashkin V. A., Zvartau E. E., Fedorova O. V., Bagrov Y. Y., Lakatta E. G., Bagrov A. Y. (2008) Eur. Neuropsychopharmacol. 18, 74–77 [DOI] [PMC free article] [PubMed] [Google Scholar]
- 34. Bagrov A. Y., Fedorova O. V. (2005) Front Biosci. 10, 2250–2256 [DOI] [PubMed] [Google Scholar]
- 35. Fedorova O. V., Kolodkin N. I., Agalakova N. I., Namikas A. R., Bzhelyansky A., St-Louis J., Lakatta E. G., Bagrov A. Y. (2005) J. Hypertens 23, 835–842 [DOI] [PubMed] [Google Scholar]
- 36. Fedorova O. V., Agalakova N. I., Morrell C. H., Lakatta E. G., Bagrov A. Y. (2006) Hypertension 48, 1160–1168 [DOI] [PubMed] [Google Scholar]


